Related Categories
Related Articles
Articles
GOLD - Seasonality (30year-range)
From the 20 year-charts of Gold one may take following implicit/possible buy/sell-"rules" /Weakness and strength points. The 5-year to 30-year seasonal studies show following weakness points of gold: Mid March, Mid June and to lower extend Mid October.
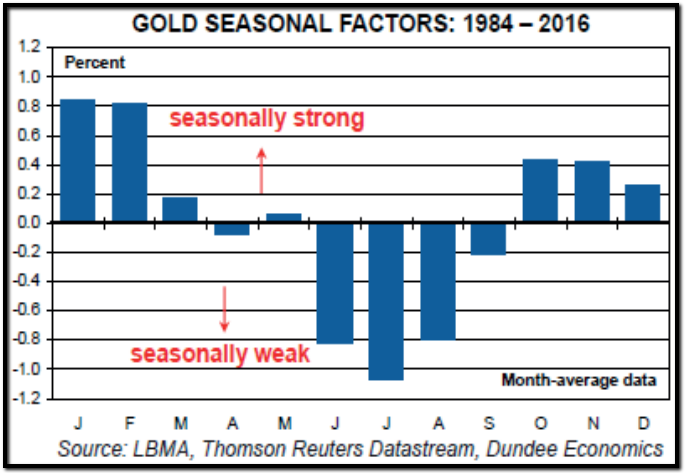
On the other hand, strength points might be ("are"): The "magic" 19th February, Early June, Mid September, Mid November as said: the best point in the year...
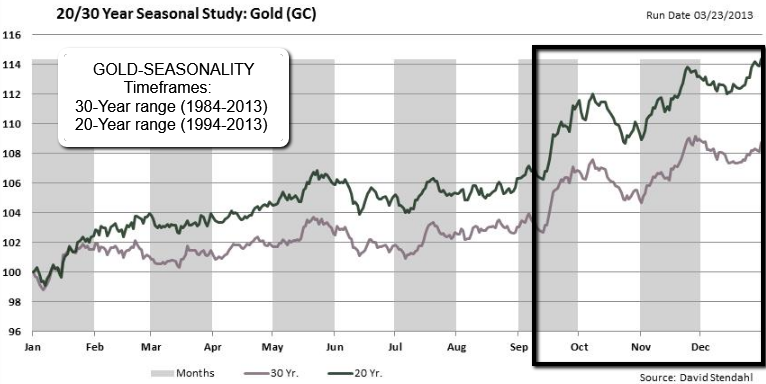
Speaking about a 20-year-chart of GOLD, one may take a closer look at following chart, covering the 20-year AND the 30-year-period in the past:
What does this visual "effect" means, if you break some of the historical, monthly data down into %-gains per month? Well, here you go - this are the results for the 20-year-period from 1995 up to Dec. 2014:
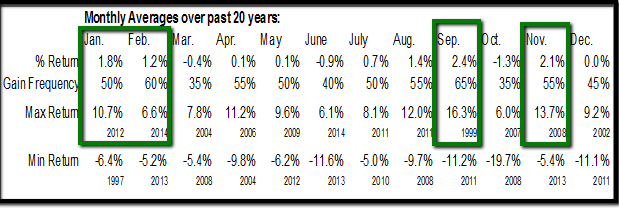
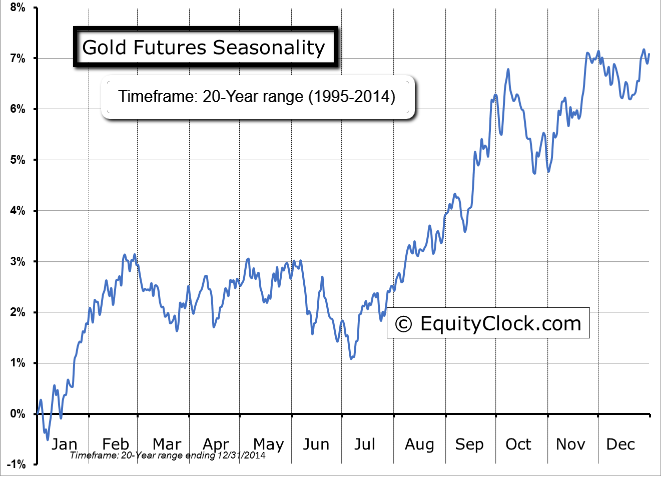
Eventually, the months of Sep., Nov., as well as January and February seem to be "good months" for the Gold-Investor. Let's recap on the the visual part of checking seasonalities, Let's again take a look at follwoing Chart covering the same period (1995 - Dec. 2014):
Analysis for the AMEX-Gold Bugs Index has revealed that with a buy date of 27th July and a sell date of 22nd February, investors have benefited from a total return of 327.02% over the period of 1986 - Dec. 2010 (period covered: 14 years). This scenario has shown positive results in 10 of those periods. Timeframe: 14-year range ending 12/31/2010
AMEX GOLD BUGS INDEX (^HUI) Seasonality
Analysis has revealed that with a buy date of July 27 and a sell date of February 22, investors have benefited from a total return of 327.02% over the last 14 years. This scenario has shown positive results in 10 of those periods.
Monthly Averages over 14 years (from 1996 until Dec. 2010):
Jan. Feb.
1.74% 4.15%
Mar. Apr.
-0.03% 0.59%
May June
4.59% -0.05%
July Aug.
-3.46% 2.71%
Sep. Oct.
8.9% -6.57%
Nov. Dec.
4.82% 1.73%
The buy and hold return for the 14 period (range from 1995 up to Dec. 2010) years was 284.88%.
http://charts.equityclock.com/amex-gold-bugs-index-hui-seasonal-chart
Gold-Seasonality (30years), Period: 1982 - 2012
source: Dimitri Speck (seasonalcharts.com)
http://www.seasonalcharts.de/classics_gold
Mega-Big-Picture: http://charts.equityclock.com/seasonal_charts/futures
link for long-term seasonal-charts: https://snbchf.com/swissgold/gold/seasonal-factors-on-gold


