Related Categories
Articles
Dow Jones might look juicy (to me)
I really like the pattern, the Dow Jones Industrial Average (Index consisting of only 30stocks) built over the last 2years. It seems to me, that momentum is building up and that might lead to some more upward moves. No Financial Advice!
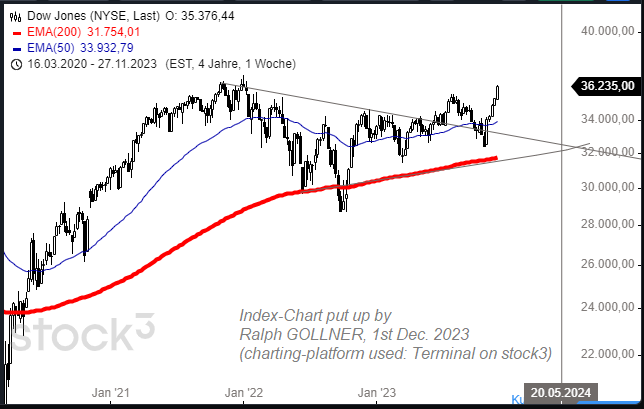
If the "DOW" is capable of keeping up that momentum during December or at least during the 1st quarter of the upcoming year - the levels which can be seen in the following chart might even be attainable within the next 12 to 18 months. I am speaking about Index-levels of 39,000 points or even 42,600.
Important to ...
Dow Jones mit 3 dicken 1.000 Minuspunkten-Tagen
(Status: 27. Feb. 2020)
Die letzten 10 Tage im Chart und der Markt macht in den letzten Tagen und Stunden keine Anstalten, nach oben umzukehren (grosse Entfernung zum gleitenden 21- und 42 Stunden-Durchschnitt), Chart laufend aktualisiert:
Die Indikatoren auf Stundenbasis geben kein Zeichen für einen Turnaround per 27. Februar 2020 (intraday) und zum Market-Closing!
Dow Jones versus US-GDP (Status: 2019)
Schauen wir uns die faszinierende "Ähnlichkeit" zwischen dem Dow Jones Index (altehrwürdiger preisgewichteter US-Aktienindex) und dem US-Bruttoinlandsprodukt (US-BIP / US-GDP in english) im Zeitfenster 2010 bis 2019 näher an:
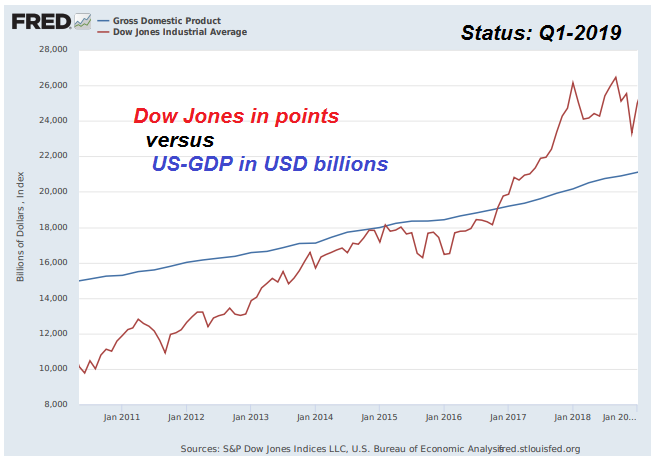
Mir ist das Ganze vor einigen Jahren aufgefallen und ich habe die Historie bis zu den 50er-Jahren des letzten Jahrhunderts zurückverfolgt. Resumé: Frappierende Ähnlichkeit - wohl ein Zufall...
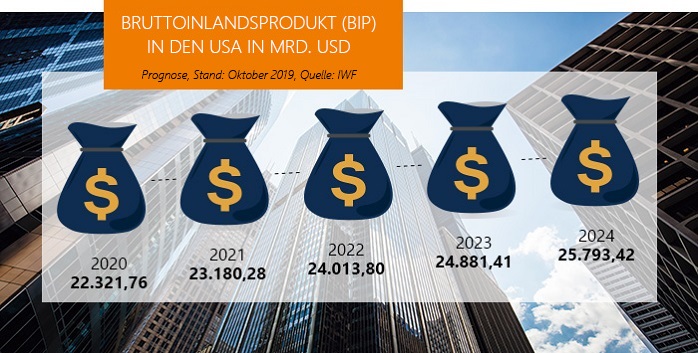
Folgend das erwartete US-BIP in den nächsten Jahren laut dem Internationalen Währungsfonds (IWF):
Dow to US-GDP-ratio (um einen ...
Look at this Support-line:
Check out the DOW JONES Industrial Average bouncing off near his EMA-180 - weekly
pretty obvious - that there might be a bottom...
Ein Quartal ist kein Quartal.
Q1-2019 wird uns eventuell ein bissl mehr Feedback geben, wo wir denn wirklich stehen könnten...
Also, Tee trinken, oder Neujahrs-Sekt und auf 2019 hoffen.
Cheers und einen guten Rutsch
Ralph
Dow Jones Industrial Average
Notierungen über 23.800 Punkte im DOW sollten zu keinen weiteren Panikattacken (mehr) führen. Sollte der Index jedoch in den nächsten Wochen abrupt abrutschen und gar unter 22.700 Punkte fallen, wird es spannend.
Der Index befindet sich bei einem Abrutschen unter die erwähnten 22.700 Punkte dann in einem ca. 2.800 Punkte breiten Korridor, welcher für eine volatille Seitwärtsbewegung (19.900 bis 22.700) genutzt werden könnte.
Dow Jones Industrial Average
(in the box until Jan. 2019?)
Following the recent turmoil in the (global) markets, one should re-assess the Status Quo (BIG PICTURE) for the leading, most well known Index on a broader Timeline (here from Q2-2015 onwards):
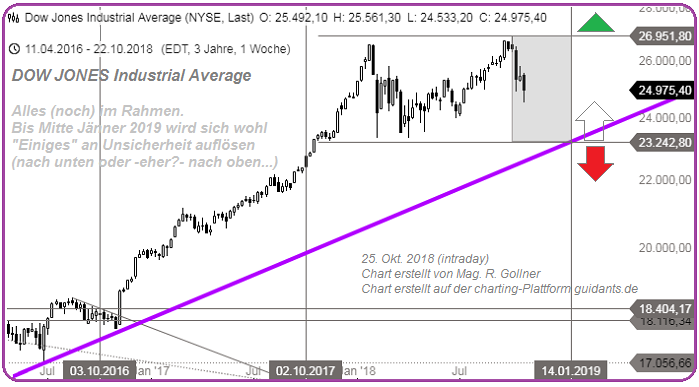
Let's focus on this box (the shaded area = framing the Q4-2018 for the DOW between the index level of 23.2k and 26.95k) for the upcoming weeks. As long the DOW stays in the grey-shaded box I feel no obligation to execute further erratic sales of single stock-positions in my portfolio. But well, depending on the quick daily movements (aka ...
DOW Jones near magic 24.7k (Oct. 2018)
Wenn der Dow Jones Industrial Average über den -nun etablierten- 24.700 Punkten verbleiben kann, bin ich postiv gestimmt für ein -relativ- schönes Q4-2018, also einen versöhnlichen Jahresausklang für die US-Märkte...
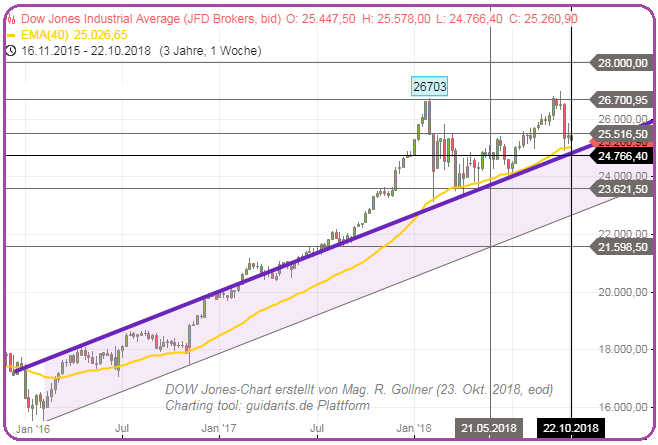
Die heutigen Intraday-Bewegungen am US-amerikanischen Aktienmarkt haben etwas Hoffnungen gegeben, dass wir evtl. einen mittelfristigen "Turnaround-Tuesday" gesehen haben. Aber man muss sich auch eingestehen, dass hier keine dicken grünen Ampeln geschalten wurden (Closing war "still in the red", trotz Intraday-Turnarounds in den ...
KISS
(keep it short and simple!)
Great Strategy, easy rules, for Longterm-Investors and Medium-Term Investors. Underlying Index: Dow Jones Industrial Average (Monitoring Period/Backtest: 2003 - Sep. 2018). I will not give you all the instructions, how to implement and follow-up...
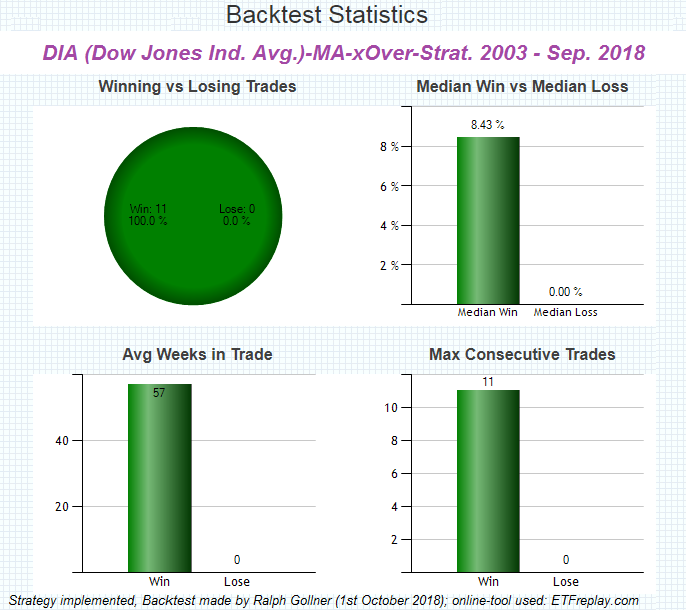
... this strategy, but just one hint: It's "all about the Moving Averages"...
Invested periods:
Buy Sell Return (Weeks In Trade)
Feb 07, 2003 Mar 21, 2003 +8.43% (6)
Jun 13, 2003 Jul 09, 2004 +14.28% (56)
Dec 03, 2004 Jun 17, 2005 +1.47% (28)
Aug 26, 2005 Jan 18, 2008 ...
Dow Jones in "Momentum-mode"
(September 2018)
A combination of rising quotations are confirmed by a DMI-crossing in the last weeks and a bullish MACD-crossing just some days ago. Additionally BIG VOLUME came into the market yesterday, Friday (21st Sep. 2018):
Dow Jones Industrial Average (Juni 2018)
Risk "Level 1": Abrutschen würde dann zu einem Minus von ca. 3% führen
Ein zusätzlicher Rutsch in Richtung "Risk-Level 2" würde dann in Summe zu einem Minus von 5% führen...
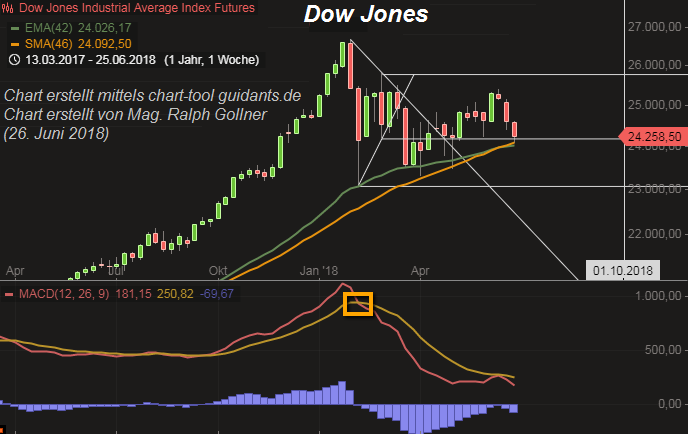
Allerdings lässt sich auch im Chart ein mögliches Support-level bei ca. 24.000 Punkten ausmachen (siehe SMA und EMA-Linien auf Wochenbasis). Aktuell ist der MACD auf Wochenbasis noch immer recht bearish, bzw. definitiv NICHT BULLISH !
Dow Jones Ind. Average VERSUS US-Staatsanleihen
Der relativ rasche Zinsanstieg am langen Ende (10year-Treasuries, US-Staatsanleihen) ist eine "kleine" Herausforderung für die US-Aktienmärkte. Die Rendite zehnjähriger US-Anleihen schaffte fast 3 %, was der höchste...
...Stand seit längerer Zeit ist. Innerhalb einer Woche stieg die Rendite damit um 14 Basispunkte, was den den Dow Jones widerum im Wochenverlauf um ca. 400 Punkte fallen ließ. Eventuell ist das nächste Ziel bei den US-Staatsanleihen (sofern ein nachhatiger Ausbruch über 3 % gelingt) das Hoch vom März 2011 bei ca. 3,47 % ...
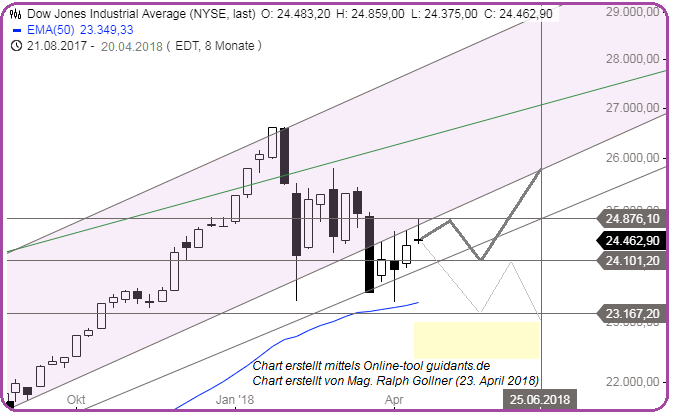
Dow Jones & Magic 23k
...the magic stories about that level (area) are accompanied -mainly- by the SMA200-daily and/or the EMA200-daily. These Moving-Averages may give support (or eventually serve as resistance) in the next days or weeks.
We will have to follow and see the reactions of the daily closing-candles. In the end, the weekly candles (finalised as per each friday in April-2018) will tell es more in the upcoming month (the trading-month of April just started today).
I also added a daily Moving Average showing the rolling periods of the last 255 trading-days!
Dow Jones Industrial Average
This was a historic day! The Dow Jones Industrial Average fell nearly 1,600 points at its lows on Monday (5th Feb. 2018), after a period of selling accelerated sharply heading into the close of the session. Eventually, the Dow shed...
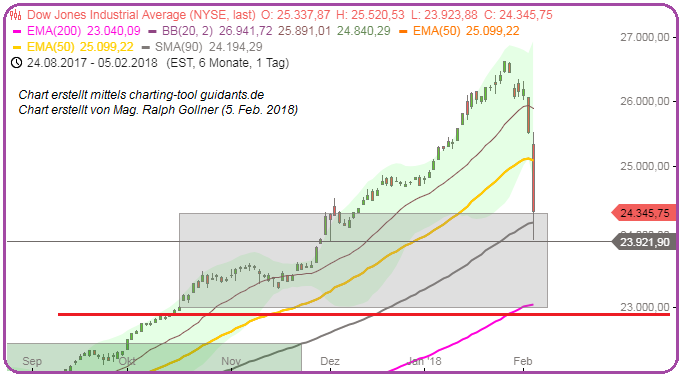
...as much as 1,597 points at its low, and closed out the session 1,175 points, or 4.6%, down at 24,345.
Dow Jones Industrial Average
(600 points-fall)
A drop of more than 600 points in the Dow is very rare. The last time the Dow Jones industrial average posted a drop of more than 600 points was on 24th June 2016, the day after Brexit-Voting. The Dow has only...
...closed more than 600 points lower eight times in history, with all occurrences taking place in the last 18 years.The eight times the Dow has closed more than 600 points lower all took place in the last 18 years. Half occurred during the financial crisis in 2008.
Another important point for the fall may have been that the ...
Dow Jones Industrial Average (tailwind & support)
Remember: The weaker dollar could boost the earnings growth of US-multinationals and commodity-companies even more! (Reminder: TAX-Refom impact on earnings will also follow "soon"). Furthermore: The 38days-Moving-Average is signaling...
...as a guideline for the moment.
With the latest drubbing, strategists have been taking a look at the impact of the slumping dollar on corporate profits, and it could provide a nice windfall. The U.S. Dollar index is falling for several quarters now.
"The buck should boost, not bite," said Sam ...
Dow Jones hits another milestone, climbing over the 25,000-hurdle!
The Dow reached 24,000 points on 30th Nov. 2017, just 23 trading days "ago". Stocks have climbed since then as investors hoped the Republican-backed tax package would boost company profits this year. The law cuts the...
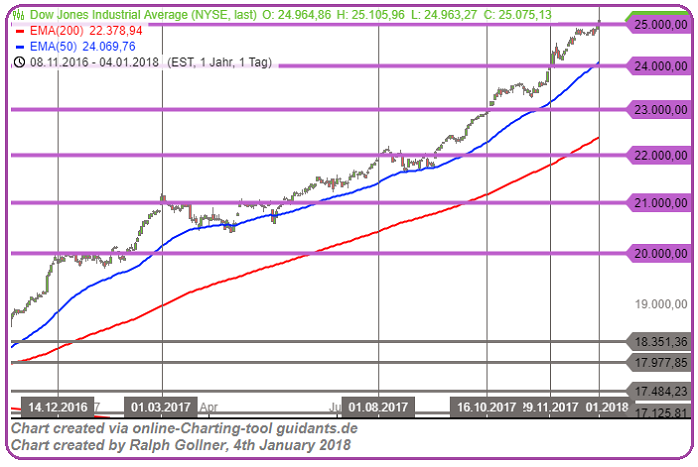
... U.S. corporate tax rate substantially. The Dow broke through five 1,000-point milestones in 2017, on its way to a 25% gain for the year (2017).
Meanwhile business activity in the 19-country eurozone reached its highest level in almost seven years. That's based on a survey of manufacturing and ...
Dogs of the Dow (Strategy)
The dogs of the Dow theory is a classic investment strategy where one invests in the 10 Dow stocks with the highest dividend yield at the end of each year and hold those stocks for exactly one year. The strategy has yielded nice gains through the years.
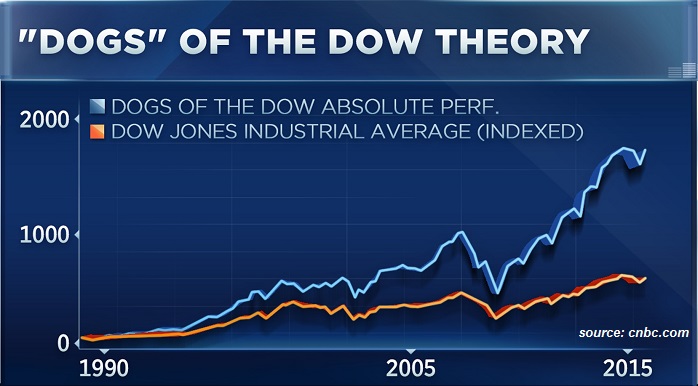
So how have the high dividend paying Dogs of the Dow and the Small Dogs of the Dow performed? The following table should answer that question. The following table presents the total returns for various calendar years 2012 up to 2016:
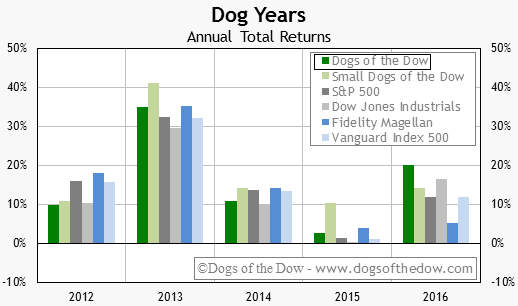
Quite impressive? wuff...
What the data shows is that, over the ...
Dow Jones Industrial Average (Sep. & Q4-2017)
Ausgehend von meiner persönlichen Idee, dass die restlichen 4 August-Handelstage das Kraut auch nicht mehr fett machen und ich mir auch nicht allzuviel von denen erwarte, nun meine Strategie / Idee für Sep. und Q4-2017...
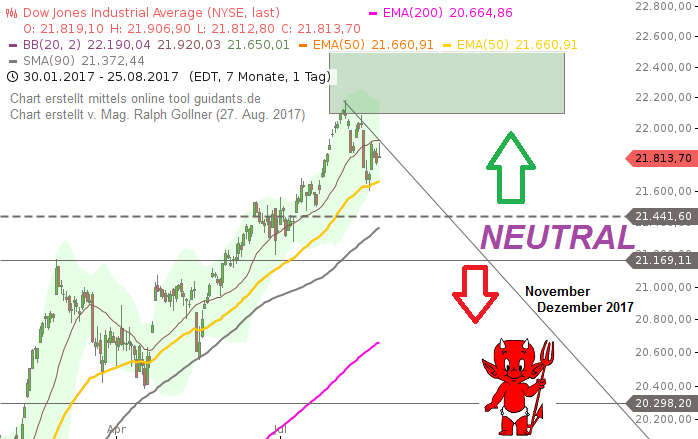
...im angeführten "Dow Jones-Chart". Folgend 2 Absätze zu meinen Gedanken bzgl. meiner weiteren Vorgehensweise im restlichen Börsenjahr 2017 (dynamische Anpassung meiner Investitionsquote folgend mehrjährigem Aufbau eines Aktiendepots in den Jahren zuvor):
Im August-Monat konnte man offensichtlich sehen, dass der Dow ...
Dow Jones Ind. Average nahe 22.000
Am 14. Nov. 2016 notierte der Dow noch bei ca. 18.888 Punkten. Vor noch längerer Zeit -damals - im Jahr 2000, hat der Dow Jones bereits fast die 12.000 Punkte erreicht. Somit ist der Dow Jones in den letzten 16 Jahren in Summe ca. 10.000 Punkte gestiegen.
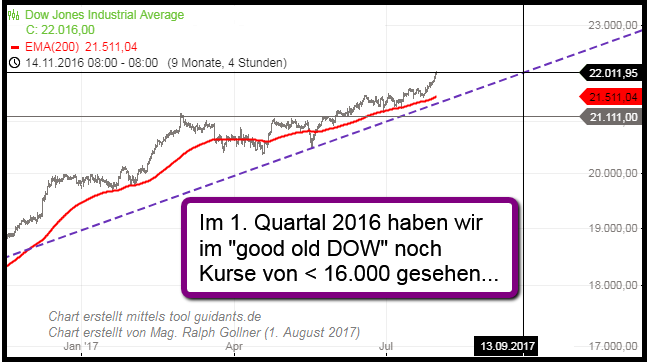
Reminder: In einer reinen Performance-Betrachtung sind hier aber KEINE Dividenden miteingerechnet! Der Dow Jones Industrial Average ist nämlich ein reiner Kursindex (im Gegensatz zum DAX = PerformanceIndex).
Reminder-Nachschlag: Durch diese relativ dürftigen Renditen im Zeitraum 2000 bis Dez. 2009 ...
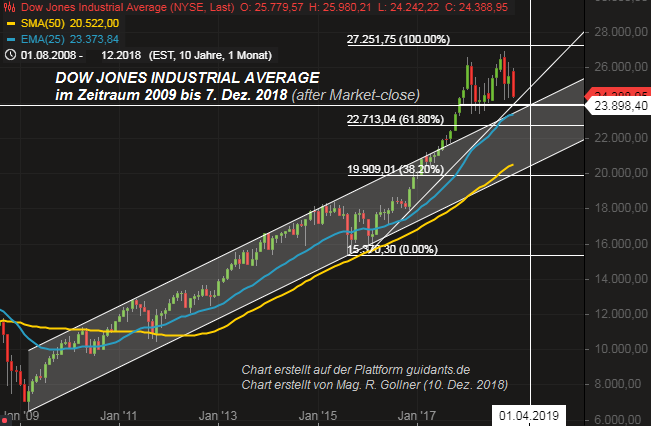
Dow Jones Ind. Average (Fibos, Fear-levels)
A question we may want to explore is simply: "how big of a correction is coming?" A quick explanation on Fibonacci retracements in case you are unfamiliar from StockCharts.com: "Fibonacci Retracements are ratios used to identify potential...
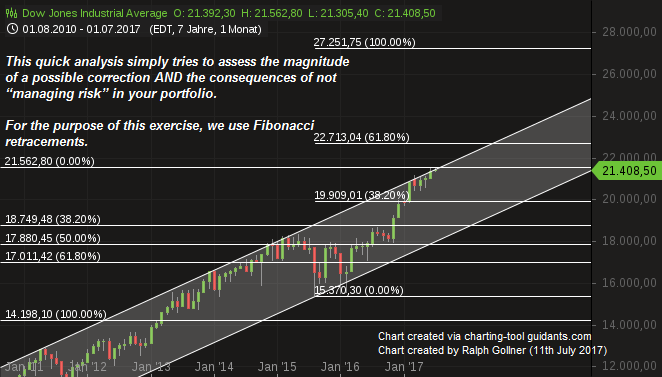
...reversal levels. These ratios are found in the Fibonacci sequence. The most popular Fibonacci Retracements are 61.8% and 38.2%. Note that 38.2% is often rounded to 38% and 61.8 is rounded to 62%. After an advance, chartists apply Fibonacci ratios to define retracement levels and forecast the extent of ...
Dow Jones Industrial Average (Trading Volume)
Rising stock-prices accompanied by higher Trading-Volume = leading to support for higher stock prices...In the following (updated) quarterly line-chart, you can follow the rising trading volume in the Dow Jones the last quarters:
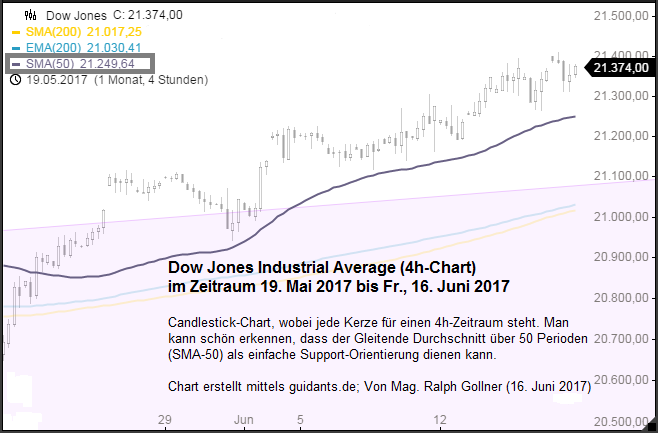
Dow Jones Industrial Average (16. Juni 2017)
Der SMA 50 im 4h-Chart des Dow Jones dient bereits seit einigen Wochen als praktischer Support für eine mittelfristige Aktienportfolio-Strategie, welche sich auf US-Aktien konzentriert, bzw. die 30 Aktien des Dow verfolgt...
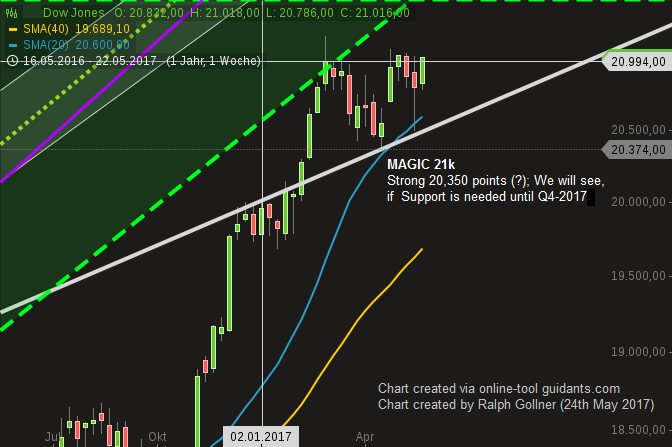
Dow Jones Ind. Average @ magic 21k
The week is not yet over - I will fly over to NYC to check out the everyday-life near Wall Street, Dow & Co. :-) ...the next days ... will be back in Vienna by 7th June 2017 !
Dow Jones Industrial Average (12. Mai 2017)
Linien, Support-Levels, "MAGIC" bis Juli 2017...
Bis Juli 2017 könnten wohl im Falle des (Not-)FALLES des Dow Jones...die 20.374 als "last support" dienen. Auf Tagesbais kann aber auch der brav horizontal verlaufende (gelbe) 40-Tages SMA...
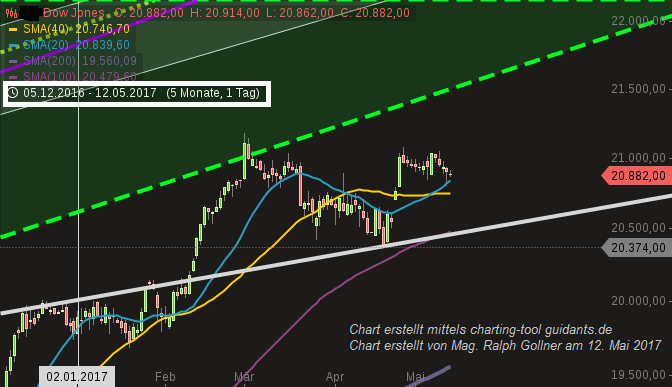
...als Support herhalten - aktuell verläuft diese (beinahe-) Horizontale bei ca. 20.740 Punkten. "Am Besten" wäre aber wohl ein Wiedererstarken beim SMA100, welcher aktuell bei ca. 20.480 Punkten verläuft, somit ein möglicher Turnaround bei den runden 20.500 Punkten (sofern notwendig).
Zur Info: Der ...
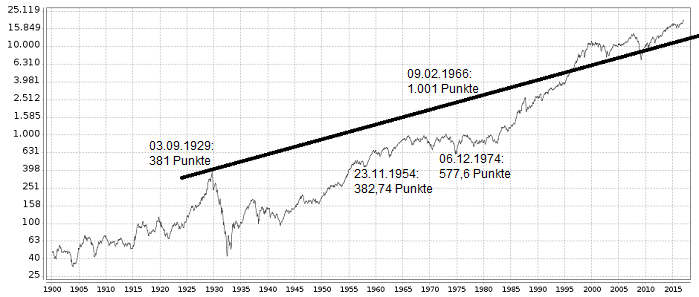
Dow Jones Industrial Average (inflation-adjusted)
With the Dow continuing to trade above the 20,000 milestone, following chart provides some long-term perspective by illustrating the inflation-adjusted Dow since 1900 - there are several points of interest. Take for example an unlucky...
...buy-and-hold investor that invested in the Dow right at the dot-com peak of December 1999. A decade and a half later, the inflation-adjusted Dow is up a mere 25%. That is not altogether an impressive performance considering that 17 years have passed. On the other hand, take the investor who bought ...
Dow Jones-Drawdowns
(Jan. 2000 - Feb. 2017)
Der Dow Jones beweist in globalen Börsen-Korrekturphasen ein gewisses Maß an defensiver Stärke. Ruhmlose Ausnahme ist aber wohl das Jahr 2009, in welchem auch der Dow Jones einen Einbruch um bis zu 54% verzeichnete. Ebenso wie das Jahr 1929 wird...
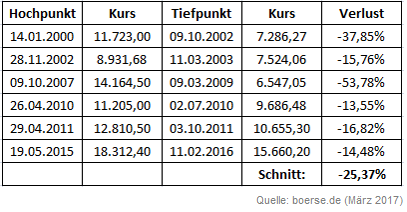
...das Jahr 2009 in die Geschichtsbücher eingehen. In der Aufstellung oben sehen Sie die Auswertung der Dow-Jones-Rücksetzer seit Jan. 2000. Beim Dow Jones gab es seit Ende 1999 sechs Zeiträume mit Rücksetzern von über 10%. Der durchschnittliche Verlust lag dann bei -25,4%.
Exklusive der starken ...
Dow Theory (Charles Dow)
On 31st January 1901 Charles H. Dow compared the stock market to the tides of the ocean when he wrote in the Wall Street Journal:
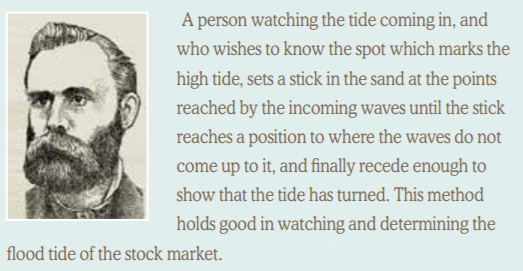
If you think of the Dow Jones Industrial Average as being the measure of the tide on one part of the beach, and the Dow Jones Transportation Average as a measure on another part of the beach, both used to determine that the tide is indeed coming in or going out all along the seashore, rather than rogue waves in one place or the other, you will understand what Dow was getting at. Confirmation by both is an integral part of the Dow ...
Dow Jones Ind. Average (History)
Jahr 1896 bis zu 20.000 Punkten
Der Dow Jones Industrial Average ist am Meilenstein "20.000 Indexpunkte" angekommen. Dieser Index ist zwar nicht der wichtigste amerikanische Aktienindex, aber sicherlich einer der bekanntesten US-Aktienindizes mit...
...einer hohen Symbolik für die Wall Street und die Kurstendenz am US-Aktienmarkt.
Achim Matzke, einer der bekannteren Analysten Deutschlands, hat sich mit der Erfolgsgeschichte beschäftigt; hiermit präsentiere ich einige Auszüge aus seinem Artikel, bzw. kürze ihn auf das Wesentlichste. Der Dow Jones ...
Dow Jones Industrial Average near 20,000
The Dow Jones Industrial Average came within a third of a point of hitting 20,000 for the first time ever. On Friday afternoon (6th Jan. 2017), the Dow hit 19,999.63, its highest point of all time.
The strong rally to close the week followed the release of the final jobs report of 2016. The Bureau of Labor Statistics recorded its 75th consecutive month of employment gains - the longest streak since 1939. The rate of non-farm job creation slowed for December 2016, with about 156,000 jobs added compared to a November sum of 204,000 and the ...
Dow Jones Industrial Average
27th Dec. 2016 - March 2017 (future, yes ;-)
To be perfectly clear, nobody knows where the Dow Jones Industrial Average will be at the end of 2017. Even those who get it right will have made nothing more than a lucky educated guess...
For a start: I am happy with everything between 19,440 and 20,950 points in the first half year of 2017.
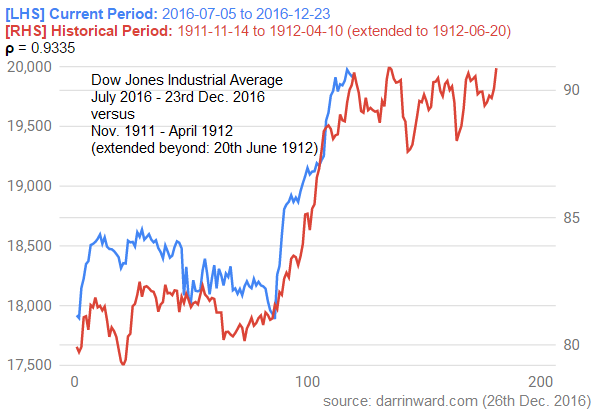
The Pearson correlation coefficient (here, see the "p-value" in the chart above) is used to measure the strength of a linear association between two variables, where the value r = 1 means a perfect positive correlation and ...
Do I hear 20,000 for the Dow Jones Industrial Average?
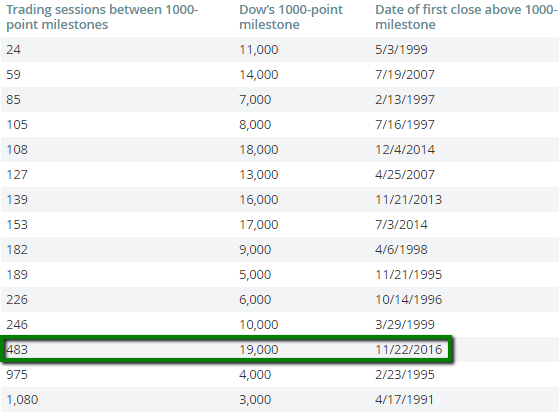
The Dow closed above 19,000 on 22nd Nov. 2016 and took 483 trading days to span the 1,000-point bridge. The blue-chip gauge as of Friday, 9th Dec. 2016 is now just about 244 points away from hitting...
 source: www.marketwatch.com
...the psychologically significant level of 20,000. Assuming that the indexes continue to lurch forward into the next week or two, that puts the gauge on pace to log the fastest 1,000-point rally since the Dow moved from 10,000 to 11,000 in from 29th March 29 1999, to 3rd May 1999 — a 24-day trading day ...
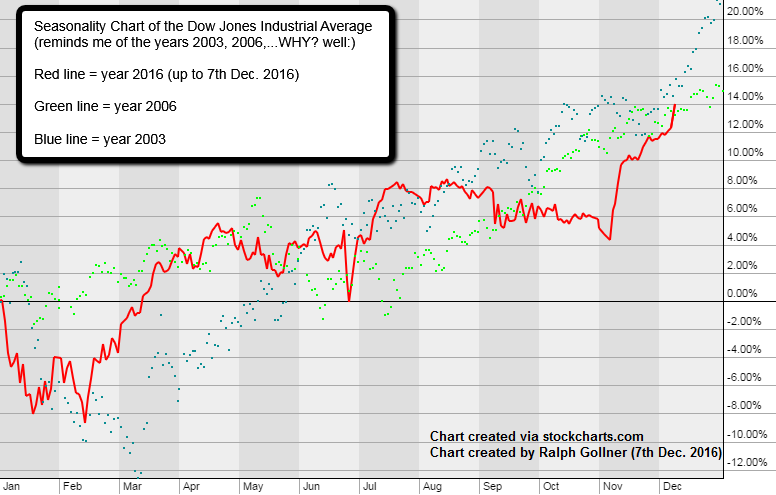
Dow Jones Ind. Average (Déjà-vu 2003 & 2006)
Do you remember the years 2003 and 2006?
Dow Jones Ind. Average @ 19k (>19k ;-)
What can happen, after the DOW breaks that magic "K"/ round 19,000-level (psychological TRIPPLE-ZERO-barrier)
Check out the video here (15th Nov. 2016):
www.kensho.com/#/statsbox
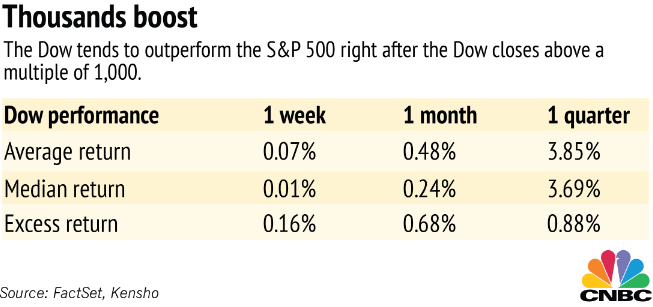
Apart from that special issue on the tripple-zero-break (which I will turn back again in the lower part of this posting!) let's recap on the history of the "Dow": Over the 119 calendar years since the Dow Jones Industrial Average was created in the late 1800s, it has risen 65.6% of the time. Over the 119 calendar years since the Dow Jones Industrial Average was created in ...
Dow Jones Industrial Average
(Price-weighted vs. Equal-weighted)
The Dow Jones Industrial Average (DJIA) is by far the eldest of the indexes, with roots dating back over 100 years to Charles Dow's introduction of the index in 1896. The DJIA attempts to use 30 stocks as a proxy for...
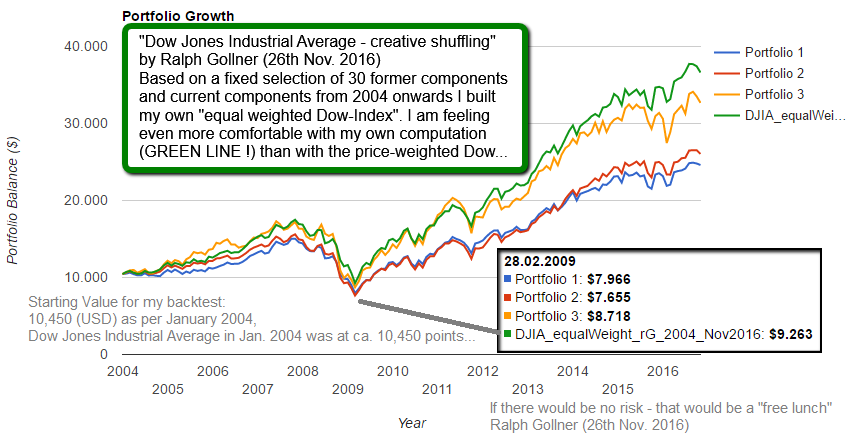
...the U.S. stock market. It does not include transport or utility companies. "But" In this posting and with the illustration above (Backtest from 2004 - Oct. 2016) I would like to outline the difference between a price-weighted index (which is a pretty old-fashioned method of calculating a benchmark), a ...
Dow Jones Industrial Average
(04/2013 - 24th Nov. 2016)
It could be, that the Dow Jones Industrial Average says goodbye to 15k forever?? Could it be?
Well, the monthly Trading-Volume may have reached its medium-term-bottom hovering at a level of ca. 1.7bn per month. From here onwards the Dow Jones IA may even try to attack the round (psychological important) level of 20k?! But what we can also see in the chart above: At an index-level of ca. 17,750 there seems to be high interest in "buying the dips" (see long volume-bar by price / red horizontal bars on the left side of the chart).
...
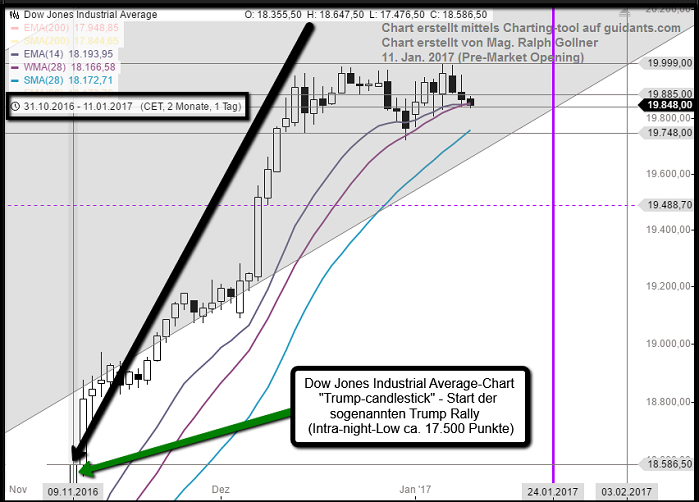
Dow Jones Industrial Average
(Trump-Impact)
Die 10 stärksten Aktien im Dow Jones Ind. Average (besteht ja "nur" aus 30 Firmen) waren am 9. Nov.: CAT, PFE, MRK, GS, JPM, JNJ, AXP, BA, WMT, DD (darunter 3 Pharma-firmen, 3 Finanz-Firmen, die nun steigen, nachdem Mr. Trump Präsident wurde...).
Die 8 Aktien im Dow Jones Ind. Average, die gestern gar mit Verlust (!) aus dem Handel gingen: PG, KO (Trump mag keine globalen Mega-Consumer-Firmen?) TRV, UNH (Zinspolitik unter Trump?, bzw. Obamacare verschwindet?), MSFT, MMM, IBM, AAPL (Trump hat sich einmal negativ geäussert bzgl. der ...
Dow Jones Ind. Average (pre US-Presidential Election)
Does the well known Stock-Index Dow Jones (Industrial Average) give you a hint - BEFORE the final voting takes place on the 8th Nov. 2016?
Dow Jones Ind. Average (Status 13. Sep. 2016)
Entweder die 18.000 Punkte im Dow Jones halten, oder es sind auch 17.500 (recht rasch) möglich. Sollte auch dieses Niveau nicht gehalten werden, könnte der Pfad bis 26. Dez. 2016 auch anders ausgehen...(als grau eingezeichnet).
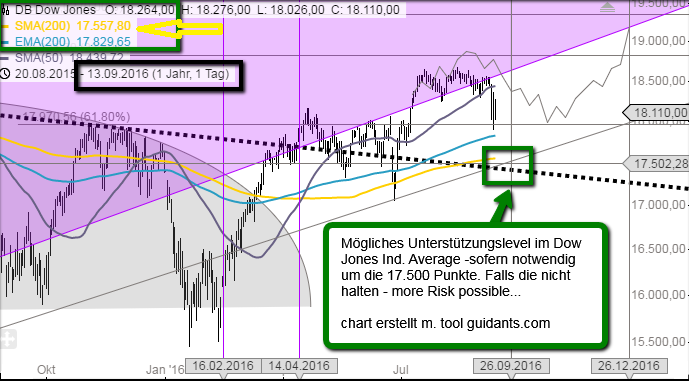
Grauer Pfad von Mag. Ralph Gollner Ende Juli 2016 in den Chart eingezeichnet. Der Schlangenpfad soll einen möglichen Weg des Aktienindex vorzeichnen, sowohl im Rahmen der Vorwahlperiode zu den US-amerikanischen Präsidentschafts-wahlen am 8. Nov. 2016, als auch für die restlichen Wochen danach bis zum ...
Dow Jones IA (inflation-adjusted)
Between the year 2000 and now (April 2016) Dow Jones-Investors did not gain much. My personal opinion: The investors in the two decades BEFORE 2000 have taken gains from the future!
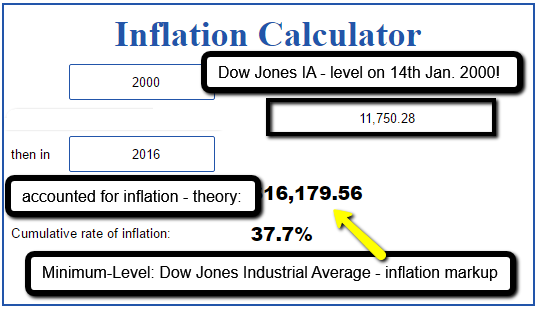 do your own calculations (e.g.) http://www.usinflationcalculator.com
hint: DJIA-level in the year 1984 +inflation-markup up to year 2000 (theory vs. reality)
Inflation-adjusted the Dow Jones Industrial Average did not really move the last 16 years (since the Boom-Peak in the year 2000). In the following chart a wrap-up of the period between 1970 and 2013 (DJIA then @ level ...
Dow Jones Ind. Average (sharp drop follow-up)
Over the 29 trading sessions from 29th December 2015 onwards until Thursday, 11th Feb. 2016 (Market-Close), the Dow has fallen more than 11%. Mark Hulbert analyzed all data back to the late 1800s, when the Dow was created.
 What he found is summarized in the chart above. Notice that the stock market’s subsequent returns following losses this big and fast were, on balance, better than the average of all days over the last 120 years.
The last time prior to this year (2016) in which the market fell at least 11% in 29 trading sessions was in the ...
Dow Jones Ind. Average/Monthly Moving Average
The Dow Jones Industrial Average managed to close above the psychological important level of 16k and above its 40-Monthly-Average in January 2016. The monthly candlestick (Jan. 2016) looks somewhat ok, but still not perfectly bullish.
So Q1-2016 may still be a bumpy ride, especially, IF the DOW will drop below 16,000 points...(any quotations below 16,000 in the weeks ahead may signal high Risk, potential further losses - otherwise a possible sharp turnaround should also be kept in mind - since BOJ fired "negative interest rates" out of the ...
DJIA-stocks above SMA200-d (as per 20th Jan. 2016 INTRADAY-CET p.m.)
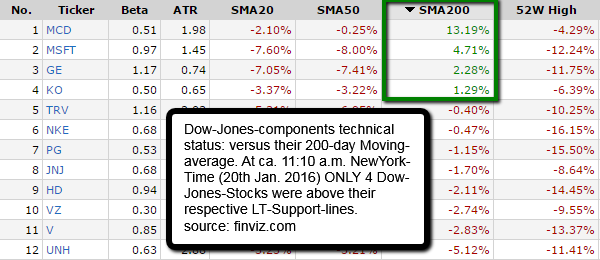
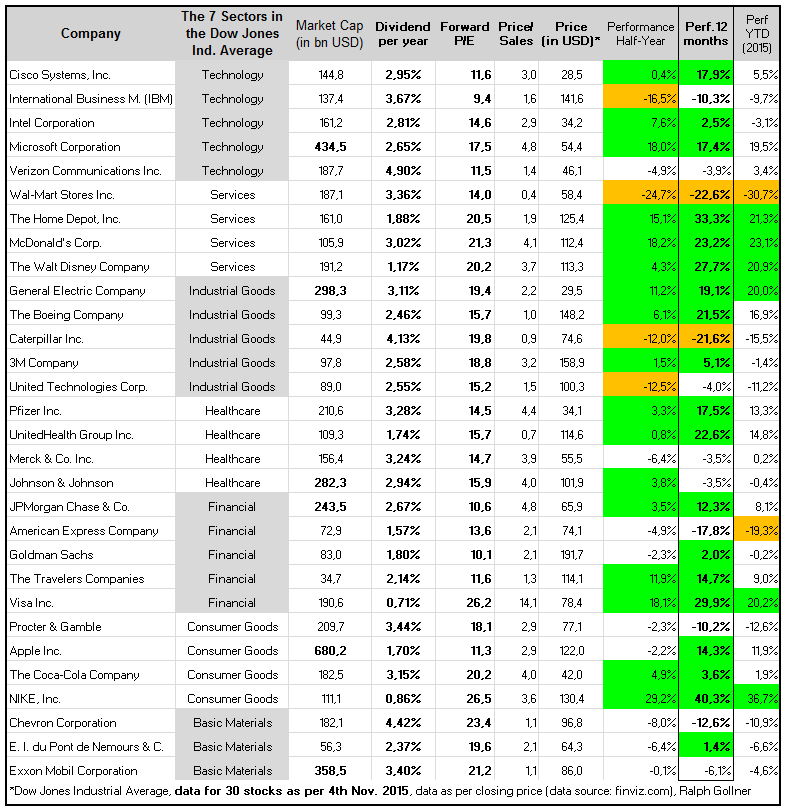
30 stocks data as per 4th Nov. '15 (after market close)
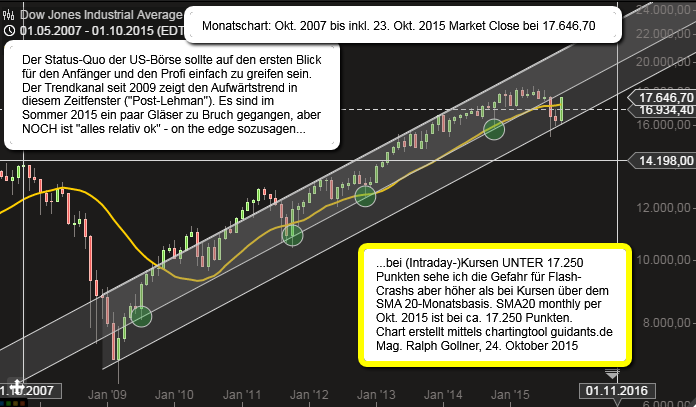
Status Quo Dow Jones Industrial Average
(Q4-2007 bis 23. Okt. 2015)
quarterly losing streaks Dow Jones (1896-Sep. 2015)
Following a research done by marketwatch with data from FactSet I rechecked a possible "redo" of Q1 1977 up to Q1 1978, which would lead to a 25% drop implying a Dow Jones (IA)-level of of between 13,100 and 14,000 points in Q1 2016.
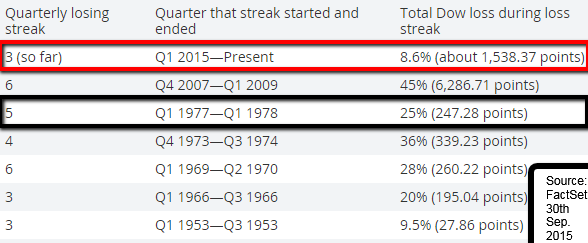
source with complete data since the year 1896: http://www.marketwatch.com
Dow Jones Industrial Average / Death Cross (Aug. 2015)
Below a chart of the famous Dow Jones (DJIA) from Aug. 2014 up to Tuesday, 11th Aug. 2015 and the famous Death Cross:
 A rare “death cross” appeared Tuesday, 11th Aug. 2015, in the chart of the Dow Jones Industrial Average, suggesting the stock market may have already begun a new long-term downtrend (my remark: this still has to be confirmed...).
A death cross is said to have occurred when the 50-day simple moving average, which many use to track the short-term trend, crosses below the 200-day moving average, which is widely used to ...
Dow Jones Industrial Average Trendchannel 2011 - 2015, 24th July (monthly candles)
Below a trendchannel of the famous Dow Jones (DJIA) from the starting point 2011 (the last time some real turmoil was going on especially in the European financial markets) up to now, 24th July 2015.
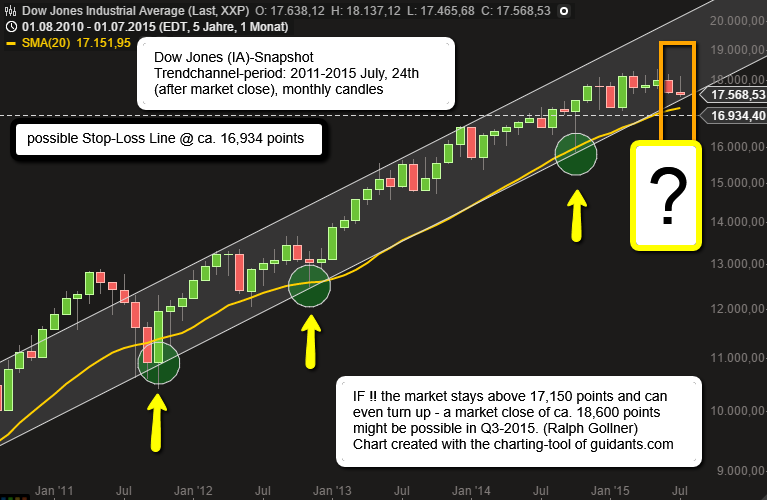
At this point now the market is (short-term) on the edge. As Q3 has the tendency to be a nervous period of the year one should rethink twice if one wants to reduce ones exposure now or even come back to the markets only again in mid-October (Q4) for a possible year-end-rally?
Tagesaktuelle Dow-Jones-Industrial Average Entwicklung (tgl. aktualisiert)
http://bigcharts.marketwatch.com
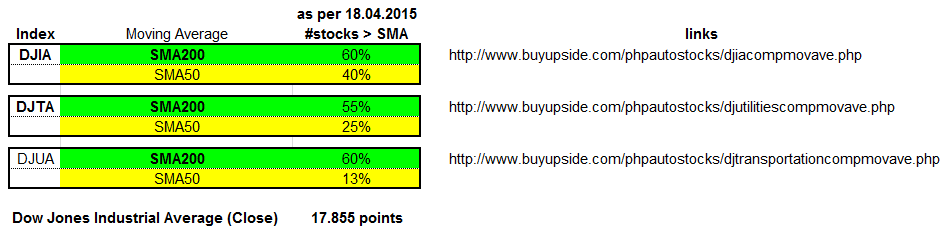
Aktuelle Ausgangslage (SMA200, SMA50) im DJT, DJU, und DJIA per 18. April 2015 (Market Close);
DJT = Dow Jones Transportation, DJU = Dow Jones Utility, DJIA = Dow J. Industrial Average
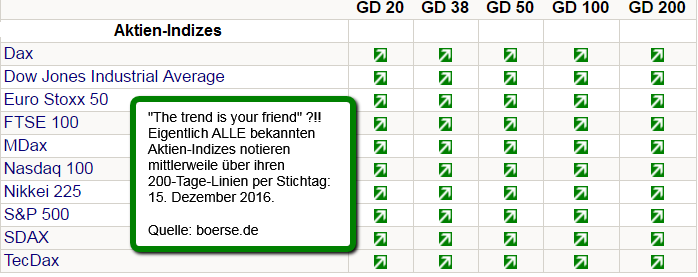
Dow Jones ("the trend is your friend")
Chart wird automatisch tagesaktuell geladen (posted on 17th May 2015 - then backdated 20th April 2015)
Danger ahead in the Dow Jones Transportation Index? check out also the famous "Dow Theory"
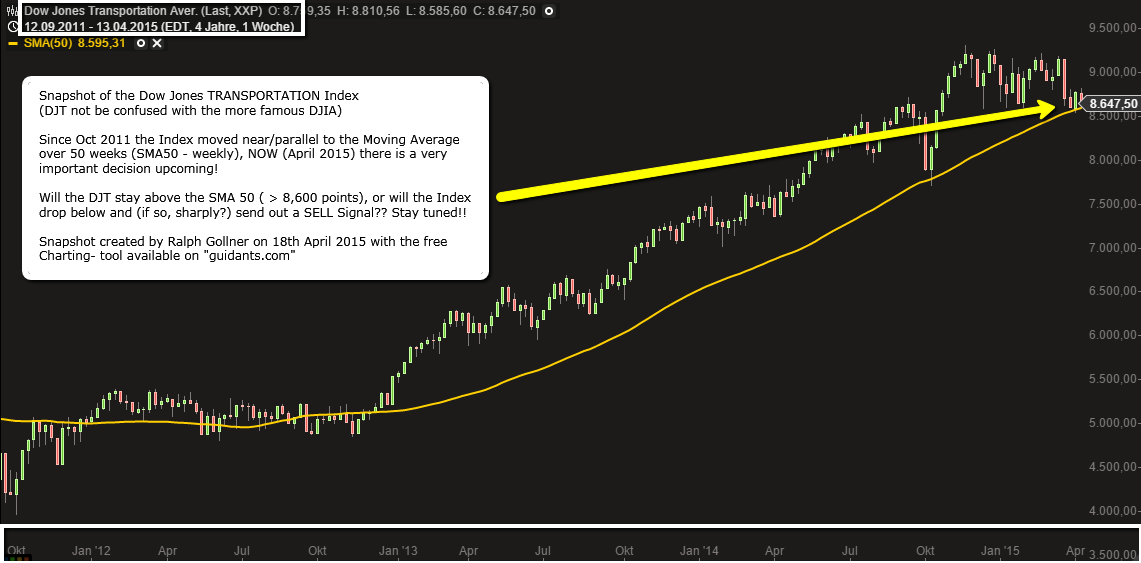
If the DJT should fall below its SMA50-weekly => This should make us very cautious !!!
updated DJT incl. SMA50-weekly:
http://bigcharts.marketwatch.com
Related Articles
South Africa (since 1900 one of the world's most successful equity markets)
Today, South Africa has 90% of the world's platinum, 80% of its manganese, 75% of its chrome and 41% of its gold, as weel as vital deposits of diamonds, vanadium, and coal. As per 2015, South Africa is the largest ...
Standard Deviations SMA 200 versus the US-Indices lies in 2015 @ max. ca. 4
(DAX only 3SD-difference as per 3rd Oct. 2015 = more room to correct?)
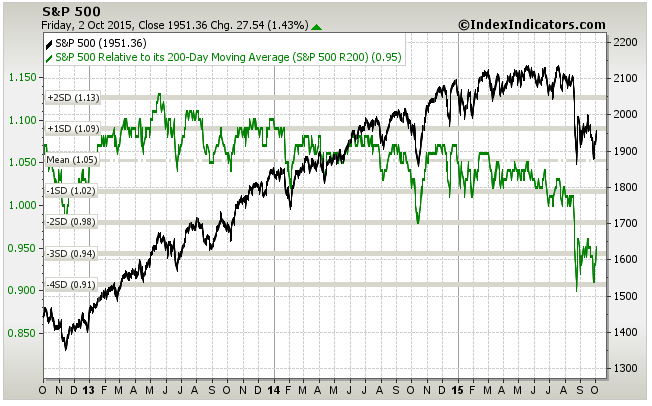
DAX (please click): http://www.indexindicators.com/charts/dax-vs-dax-200d-rsma-params-3y-x-x-x/
more data and current charts available for free ...
Thumbs up (DAX > SMA 200-daily)
Let us REFOCUS on the 200-daily Moving Average...as long as the Index stays above 11.111 points, or at least 11k the index looks stable. Still, there lies a gap around 10,5k - who knows if (and/or when) it will be closed?
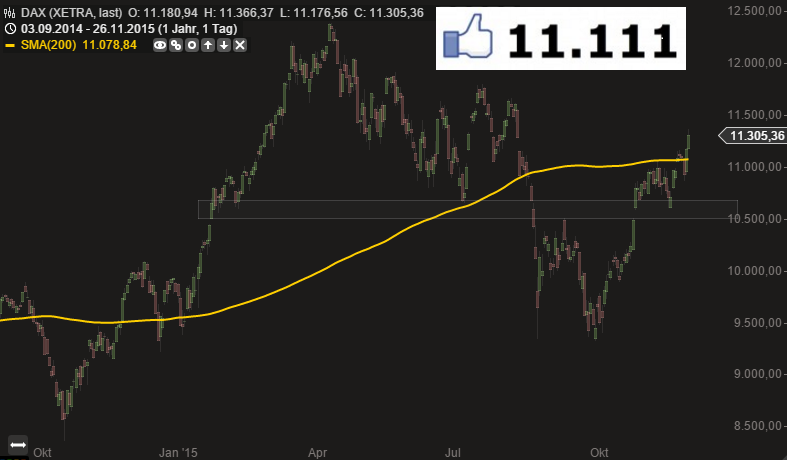
Chart was created with the ...
World GDP / "World-Stock-Market"
It remains most important to keep the idea of worldwide diversification in mind, as global growth remains most of the time positive yoy (see Figure 1):

Too often one can see that private investors are concentrating their investments in one region, sometimes ...
CECE-Index (in EUR), Anfang Dez. 2015
Der CECE-EUR Index (Osteuropa-Phantasie) ist auf einem Vier-Jahres-Tief, wie Stefan Mayriedl per boerse-online anmerkt.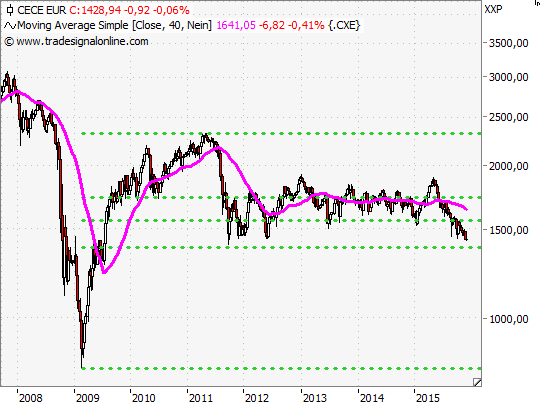 Quelle: http://www.boerse-online.de
Osteuropäsiche Aktien sind im Moment völlig out (Q4-2015, Anfang Dez.). Der bekannte ...
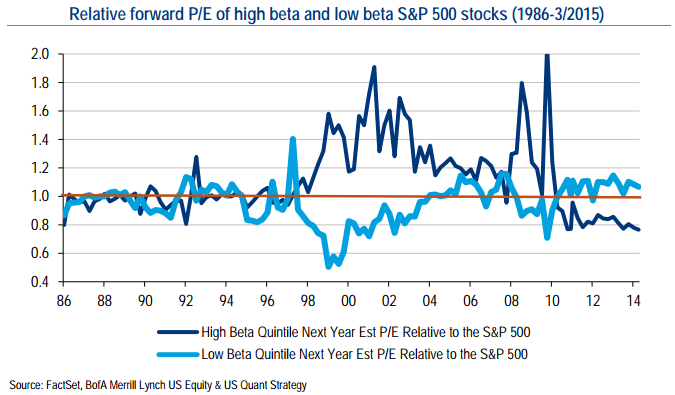
US-Stocks (Valuation-History up to 2015)
S&P 500 und der WTI-Ölpreis (Korrelation auf 26-Jahres-Hoch)
Die Korrelation zwischen Öl (Sorte WTI) und dem S&P 500 bewegte sich im Januar 2016 auf einem Niveau, welches in den letzten 26 Jahren nicht mehr erreicht worden ist.
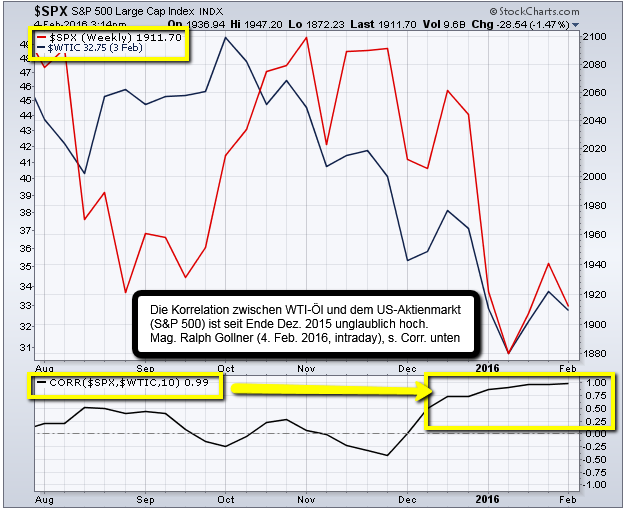
Die Korrelation im Jänner 2016 hat ca. 0,97 betragen, höher als ...
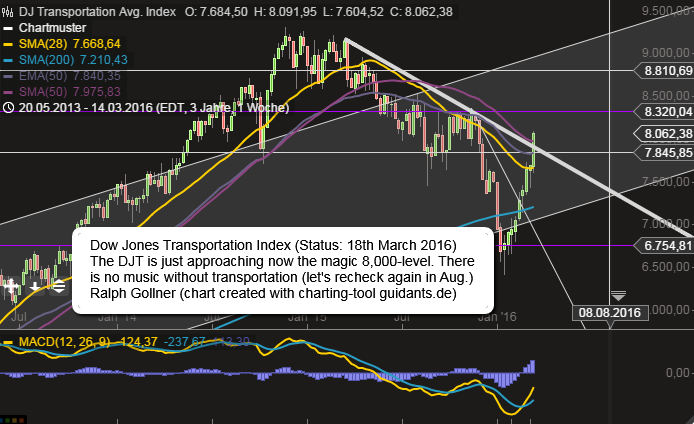
Dow Jones Transportation Index
In April 2015, "private-investment.at" looked at the DJT-Index and remarked, that is was of utmost importance to follow the Index and its fight with the SMA50-line (weekly). The Index lost, broke through and found an intermediate bottom some weeks ago:
Golden Cross April 2016 (Dow Jones IA)
Bullish Crossover Moving Average 50days/200 days
A bullish ‘golden cross’ chart pattern has appeared in the Dow Jones Industrial Average, and this one may have a better shot of working out for investors than the one that failed just four months ago.

...
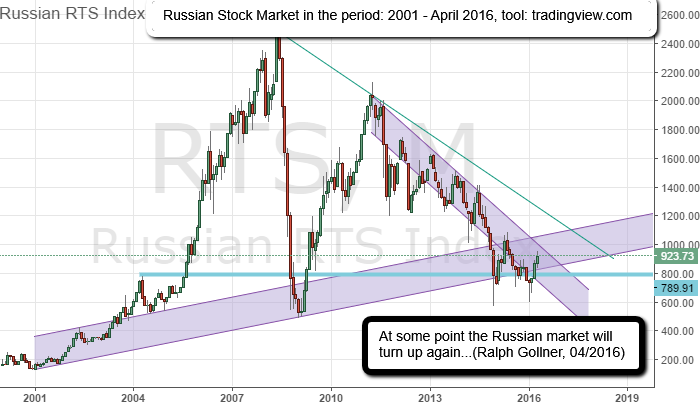
Russischer Aktienmarkt (RDX-USD, RTS)
Bewertung (CAPE), Langfrist-Chart
Der russische Aktienmarkt wurde, final mit dem Ölpreis-Absturz im Jahr 2015, die letzten Jahre tief ins Minus gedrückt:
Als ATX-Investor ist man sich dessen besonders bewusst, da teilweise doch eine Korrelation zwischen ...
S&P 500 "the 50s"
Although we tend to think of the 1950’s as "Happy Days" made up of greasers and hot rods, the "Fifties" were not all peaceful and roses. The 1950’s began with the "Cold War" between the United States and the Soviet Union...
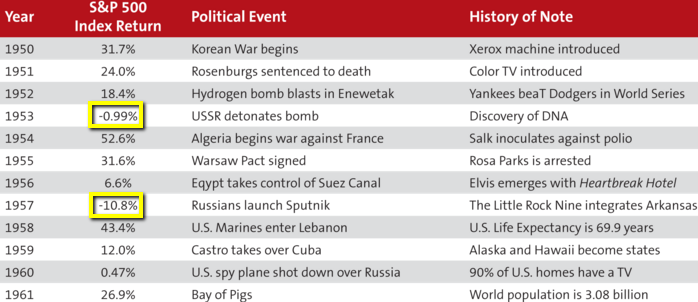
...as clashes between communism and capitalism ...
S&P 500 ("the odds")
Aktien (US-Aktien) steigen im langfristigen Bild die überwiegende Mehrheit der Zeit. Meine Berechnung (unter Verwendung von Daten von NYU Stern) hat ergeben, dass in 66 der letzten 88 Jahre der S&P 500 positive Jahre hatte. 73% positive Jahre!
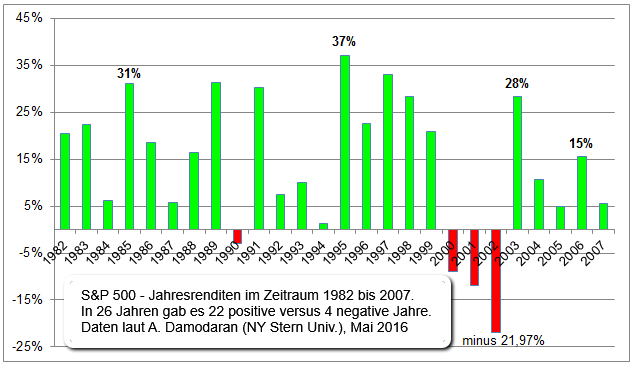
Wenn man also in die ...
SDAX (German Small Caps)
Mit mehr als 9.300 Punkten hat der SDax sich zum renditeträchtigsten Index in der deutschen Börsenlandschaft emporgeschwungen. Dax, MDax und TecDax notieren zum Teil deutlich unter ihren hist. Höchstständen, der SDax stand zeit seiner Geschichte noch nie so hoch.
...
Dow Jones Industrial Average (Pre-Brexit-Voting)
The famous Dow Jones (DJIA/Dow Jones Industrial Average) has been buidling up momentum lately (again), since the widely known Index broke its 200-Day Simple Moving Average (but also the Exponential Moving Average and the WMA):
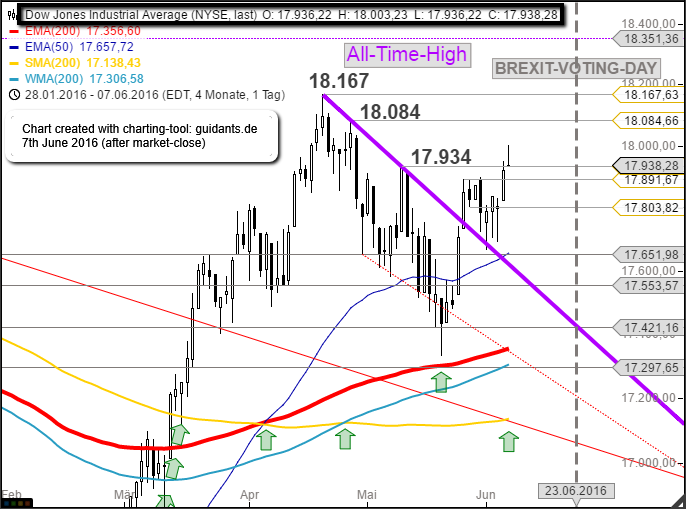
Stay cautious!
Investors in European stocks are fearful - since the Brexit-voting will take place on the 23rd June 2016 with unknown consequences.
DAX-Rollercoaster (03/2012-06/2016)
Geschüttelt, nicht gerührt...Folgend dem BREXIT-Voting gingen kfr. mal alle Sicherungen durch. Derzeit wird am Versuch einer Stabilisierung im Bereich 9.100 bis 9.800 Punkte gearbeitet - RISKY!
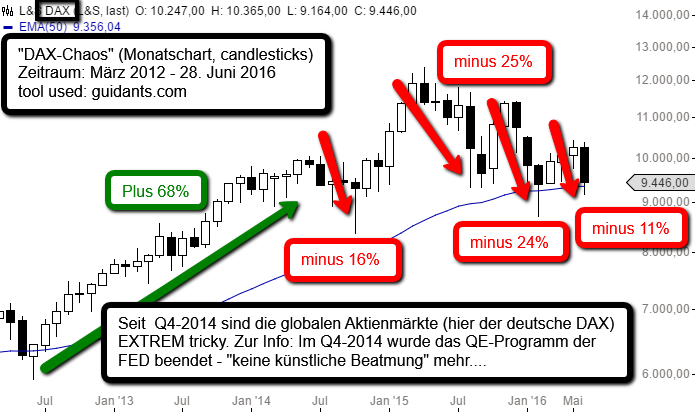
DAX-Betrachtung (Bild oben) wurde kommentiert von Mag. Ralph ...
S&P 500 reached an All-time high weekly close!
Record highs around the corner? "Close" doesn't even come close to describing it. The S&P 500 rose as high as 2,131.71 on Friday (8th July 2016), its highest level in nearly a year, as it surged 1.5 percent...
DAILY updated/weekly updated ...
Dow Jones Industrial Average (2. Halbjahr 2016)
"Alles ist möglich"
Im Nov. wird ein neuer US-Präsident gewählt. Wie könnte es bis zum Jahresende mit dem Dow Jones Ind. Average weitergehen? Mit dem Wahltermin im Hinterkopf kann ich mir einen Schlangenpfad bis Silvester vorstellen:
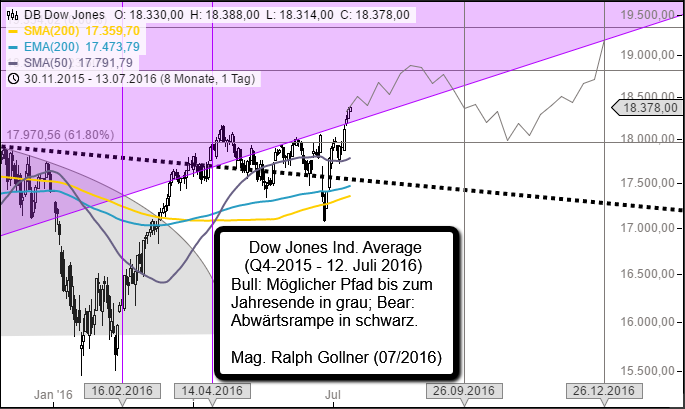 Chart ...
Dow Jones Industrial Average (Renko-Chart)
July 2011 - July 2016
Developed in the 18th century in Japan to trade rice, Renko charting is a trend following technique. Lateron Renko-Charts were found useful in trading any other financial instrument, like stocks for instance.
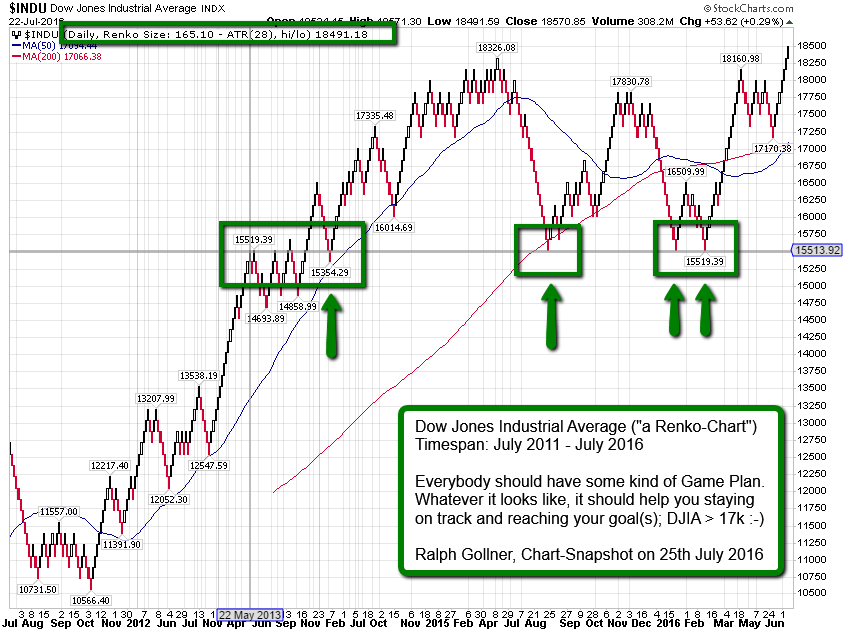
It is excellent ...
EmergingMarkets-Debt-Index
Investor appetite for emerging-market bonds has pushed buying in debt-oriented funds tied to those regions to records. Net inflows to funds that buy EM-bonds reached an all-time high in the week through 20th July.

Roughly USD 14 billion has poured into ...
Choosing the "best" Benchmark
S&P 600 maybe?
An ETF on the S&P SmallCap 600 provides diversified exposure to U.S. small-cap stocks. The S&P SmallCap 600 Index is well diversified by sector and security with the highest exposure to financials, industrials and information technology.
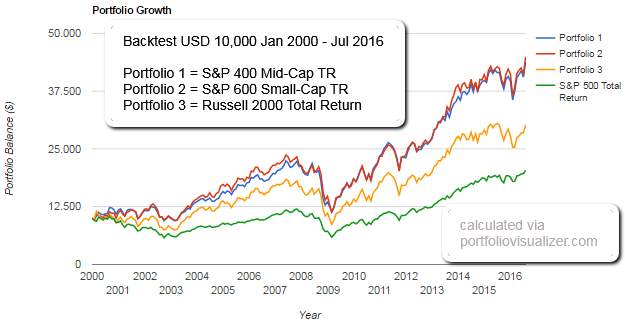
Although ...
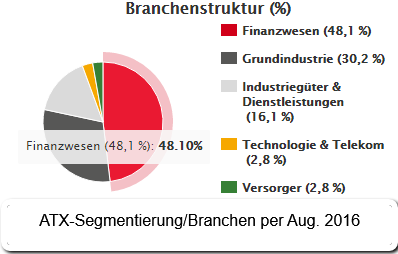
ATX (Back in the game?)
Der österreichische Aktienindex, kurz ATX, ist relativ volatil, weil er denn auch zyklische Branchen schwer gewichtet hat. So ist beinahe die Hälfte des Index mit Finanzdienstleistern oder Industrieunternehmen bestückt, wie z.B. Banken oder Versicherungsunternehmen.
...
S&P 500 (Volume by Price)
Let's hope, the volume is coming back in the next few weeks and the Volume-pulling (see red bricks on the left) levels between 2,070 and 2,120 are giving Support - if EVER-NEEDED? Let'see (Reminder: US-Election on 8th Nov. '16)
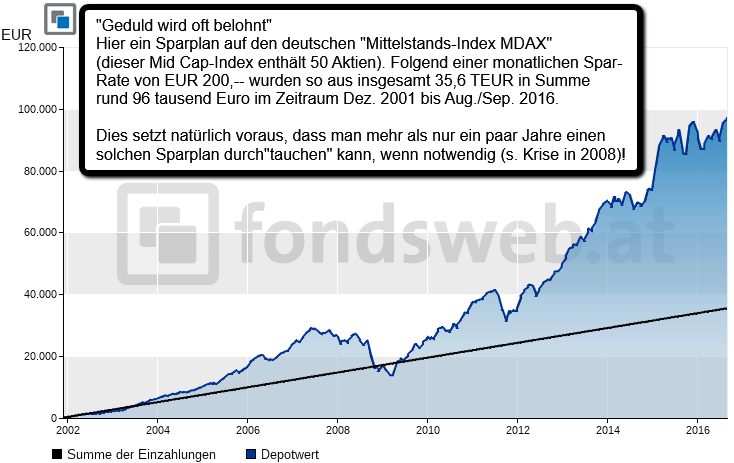
MDAX ( "2002 - 2016" )
Bei meinen Recherche nach den langfristig interessanten Möglichkeiten im Bereich Geldanlage kommen mir immer wieder Sparpläne unter. Das Problem ist hier jedoch oft, dass der interessierte Anleger teilweise garnicht versteht, was hinter dem Sparplan eigentlich steht.
...
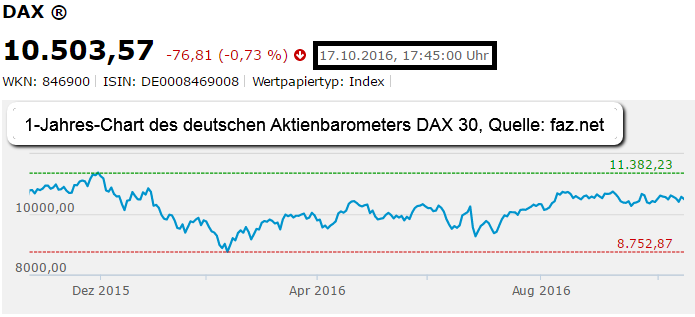
DAX 30 zwischen 8.700 und 11.400 Punkten
Seit Okt. 2015 schwankt der deutsche Aktienindex DAX in einem Korridor von ca. 2.600 Punkten. Sowohl die Themen "China-Unsicherheiten" im Q1-2016, sowie das Brexit-Voting im Juni 2016 fallen in diesen Zeitraum/Demarkationslinie: ca. 10.000 Punkte.
...
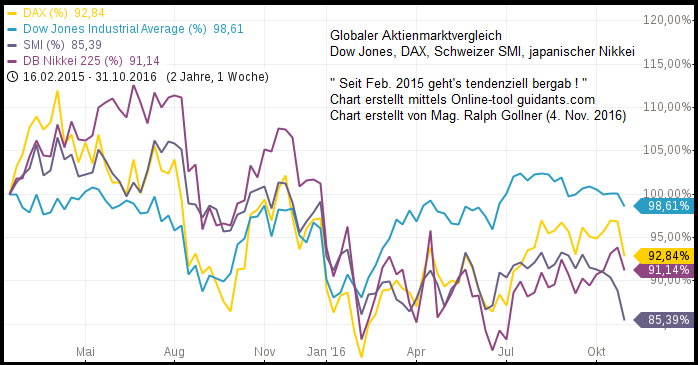
Zickzack-Börsen seit Feb. 2015
(Status: 4. Nov. 2016)
Seit Feb. 2015 stocken die globalen Leitbörsen der Welt. Zwischendurch haben jedoch einige Teilbörsen (wie der brasilianische BOVISPA) durchstarten können. Warren Buffet hatte insbesondere in 2015 einige Probleme!
 Im folgenden Schaubild ...
XLF (Financial Sector ETF)
(Nov. 2012 - 18th Nov. 2016)
The Financial Select Sector SPDR Fund tracks an index of S&P 500 financial stocks, weighted by market cap. XLF offers liquid exposure to the heavyweights in the US Financials segment. Check out the breakout this month:
Its cap-weighted ...
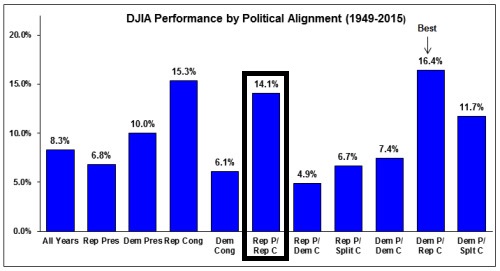
Dow Jones Ind. Average (Rep./Democr. President)
Data presented in the chart below begins in 1949 with the first full presidential term following WWII to focus on the modern era. First looking at just the historical performance of the DJIA under Democratic and Republican Presidents...
S&P 500-TR vs. DAX-Performance-Index (SPX vs. DAX)
Im den folgenden Chart sieht man einen Vergleich über 2 Jahre - und zwar zwischen dem S&P 500 TR (Total Return-Index, also inkl. Dividenden) und dem DAX-Performance-Index (ebenfalls inkl. Dividenden):
In folgendem Chart werden beide ...
Die "magische" 200-Tage-Linie
Die 200-Tage-Linie ist ein einfaches Mittel um Trends zu ermitteln und um Kauf- und Verkaufssignale zu erkennen. Die Methode gehört zu den bekanntesten und besticht durch ihre Einfachheit...
Die 200-Tage-Linie gehört zu den einfachsten und bekanntesten ...
5 years NASDAQ vs. DAX vs. M/DAX vs. ATX
One should compare apples with apples, but this is pretty hard. Just remember that each of the Indices is in local currencies. Examples: Nasdaq-stocks in USD, DAX in Euro, etc.
Still, here are the last years in retrospect
(MDAX vs. NASDAQ-Comp.)
MDAX ...
Magic 1,000 level in the S&P 100 Index
conquered as per weekly close (6th Jan. 2017)
We could wait and see if that level will also be defended as per month close of Jan. 2017. Furthermore the technological-oriented "sister" NASDAQ 100 (Tech-Index) also surpassed a psychological level: 5,000!
S&P 500 Rainbow Chart of the "90s"

Always remember: Keep the market as stupid and simple as it can be...Developed by Mel Widner and originally described in the July 1997 issue of Technical Analysis of Stocks and Commodities magazine, the Rainbow Charts indicator is a trend-following one. The ...
Famous Investors, Economists &
the Dow Jones IA
Michael Batnick analyzed the birth dates of the most important investors of all time. Without further ado, the most important investors of all time (up to the maximum birth year of 1941) are stated in following Dow Jones-Chart:
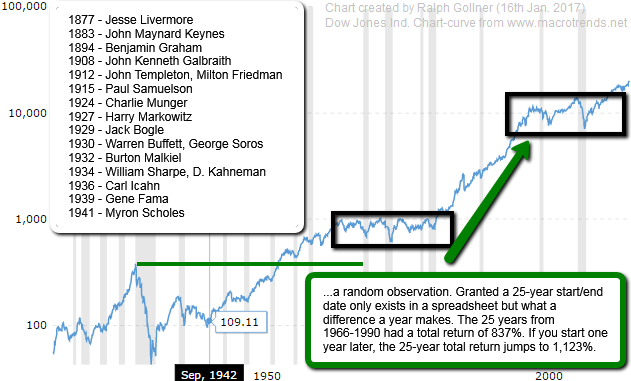
But this is an ...
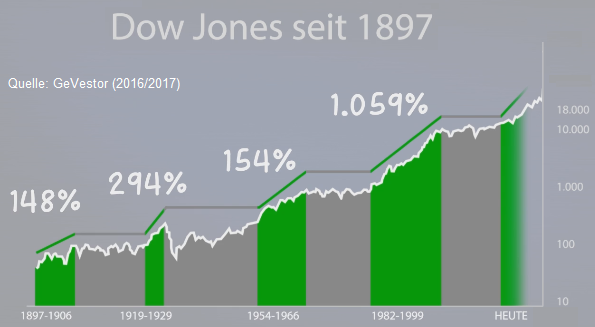
S&P 500 Rendite, DJIA seit 1896
(...bis 20.000 Punkte per 01/2017)
Der Dow Jones Industrial Average (aka DOW) ist ein preisgewichter Index und besteht nur aus 30 Werten. Der marktbreite Index ist eher der S&P 500 (kapitalgewichtet), welchen ich zur Renditeberechnung herangezogen habe:
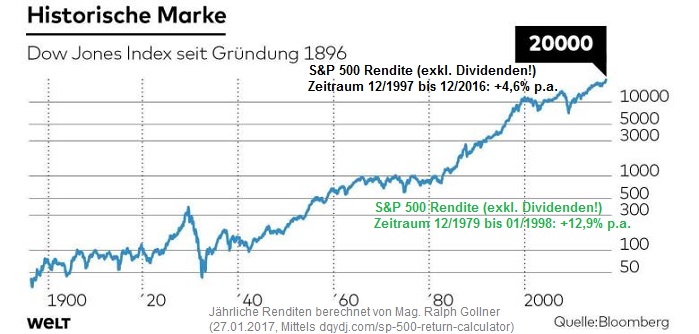
Die ...
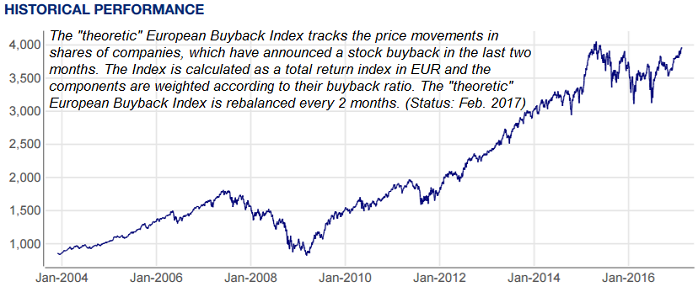
Aktienrückkäufe: Wenn Firmen sich selbst kaufen
Buy-back-Programme erhöhen den Gewinn je Aktie für Anleger. Dennoch sollten die Motive immer kritisch hinterfragt werden. Manche Unternehmen sorgen für einen Kursanstieg, indem sie eigene Aktien von den Aktionären zurückkaufen. Achtung: Doch...
 ...
...
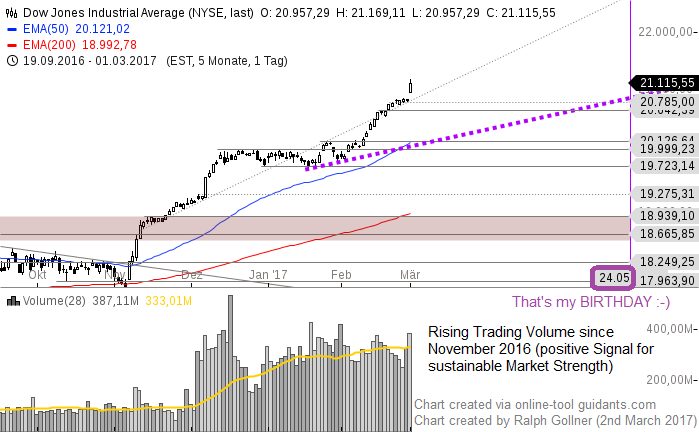
Rising Trading Volume (US-Stock Markets)
Dow Jones, S&P 500
UNTIL Oct. 2016 the US-stock market has been marked by declining trading volumes in the last years. The trading volumes story is a somewhat complex. Some argued that it was a sign of "low confirmation," meaning investors didn't...
...
S&P 500 (Under the hood)
All cylinders firing at the same time? (cylinders being here ALL the big sectors of the economy); Definition: The S&P 500 stands for the Standard and Poor's 500. It is a stock market index that tracks the 500 most widely held...

...stocks on the New York Stock ...
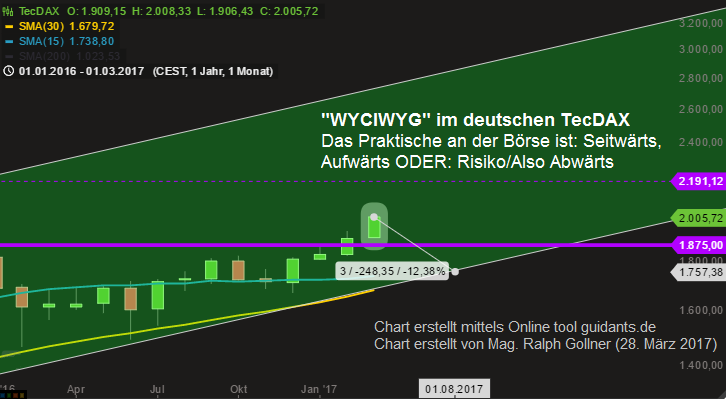
TecDAX (magic 2k, Risiko 12% darunter ?)
TecDAX, der würdige(re) Nachfolger vom Chaos-Index "NEMAX 50", oder Neuer-Markt. Hier versammeln sich die 30 größten deutschen Technologiewerte. Durch die sog. 35/35-Regel wird zweimal jährlich jeweils zum März und September die Zusammensetzung...
...
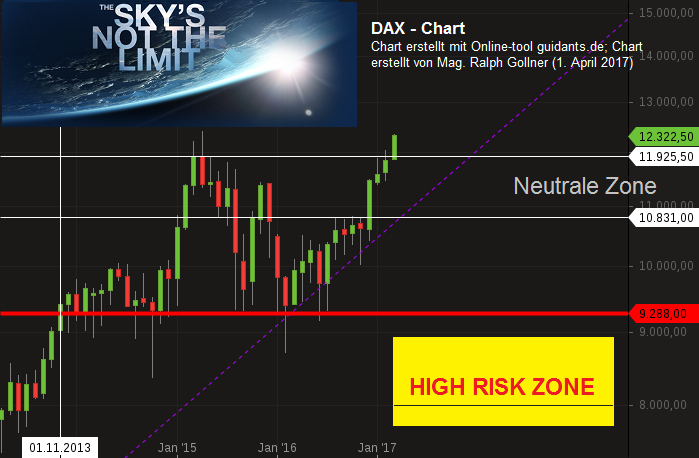
DAX - Sky(high), Neutral, Or Risk-Zone (?)
Eigentlich müsste man das folgende Chartbild nicht kommentieren. Es sollte selbsterklärend sein! Im Hintergrund sollte man sich wohl -zumindest- auch die Bewertungskennzahlen KGV, KUV, KBV ansehen (auch im historischen Vergleich) !
great ...
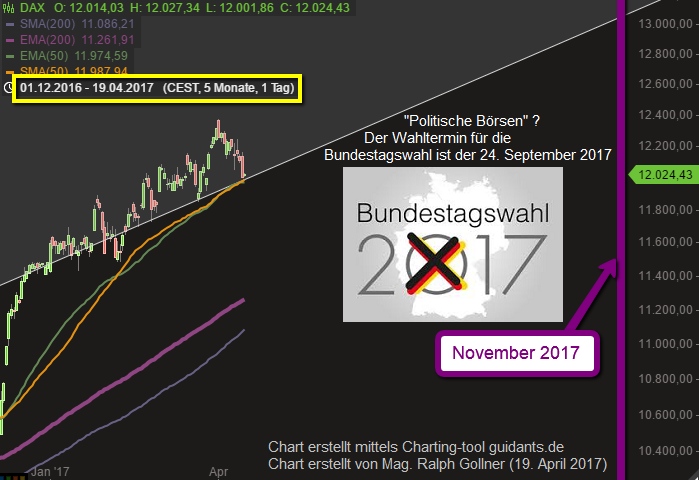
DAX vor dem Sommer im Wahljahr 2017
Die 200-Tage-Durchschnittslinien sind noch in sicherer Ferne und könnten -im Notfall- als (letzte) Unterstützung dienen. Soweit sollte es aber doch nicht kommen - sofern dieses Wahljahr glimpflich verläuft...
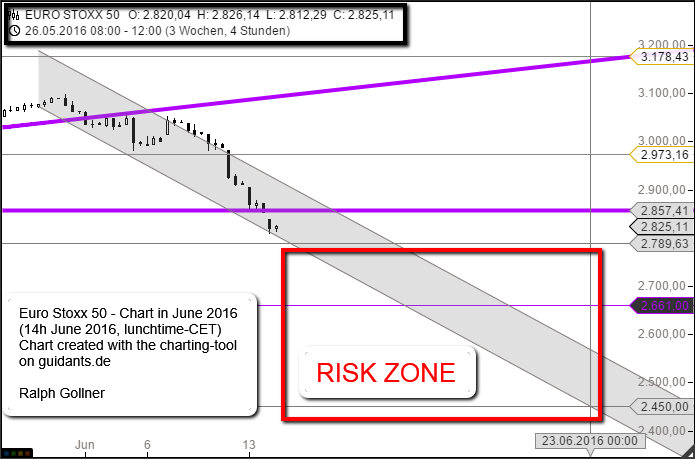
EuroStoxx 50
(April 1992 - April 2017)
oder: "Nichts ist unmöglich"
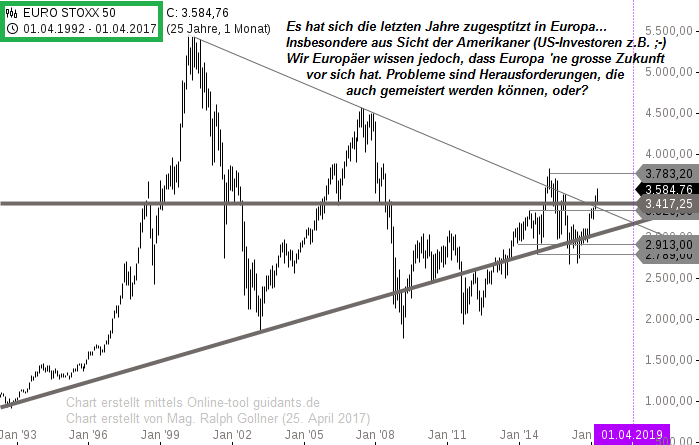
Im Dow Jones Industrial Average gibt es seit 1897 eine Abfolge von Bullenmärkten und temporärem Seitwärtsgeschiebe (bzw. Bärenmärkten, die tlw. gar 17 Jahre angehalten haben). Spannender UP-RollerCoaster-Ride seit Gründung des Dow Jones Industrial Average im 19. ...
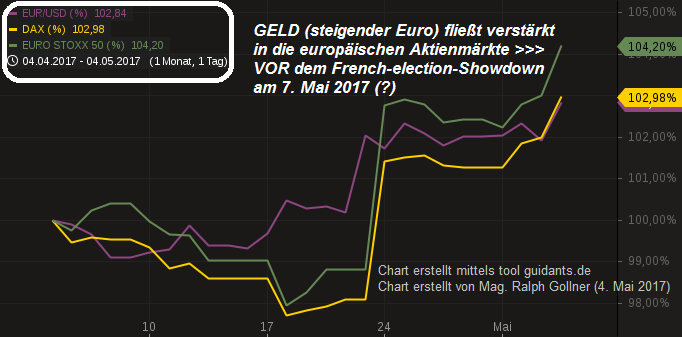
Euro steigt, Europas Aktienmärkte steigen
(04/2017 - 4. Mai 2017)
Parallel zum steigenden Euro (EUR/USD-Währungspaar) - mittlerweile bei ca. 1,095 EUR/USD - steigen auch Europas Aktienmärkte (z.B. Spanien - Index bei ca. 11.000 Punkten), Euro Stoxx 50 > 3.650 Punkte, DAX > 12.500 Punkte...
 ...
...
US-Market and Non-US (Rest of World)
US-Markets had their final hooray in the tailwind-environment of Mr. Trump (election-month November 2016). Maybe it's time for the Rest of the world to start their Stock-Market Gains? sustainable Gains?
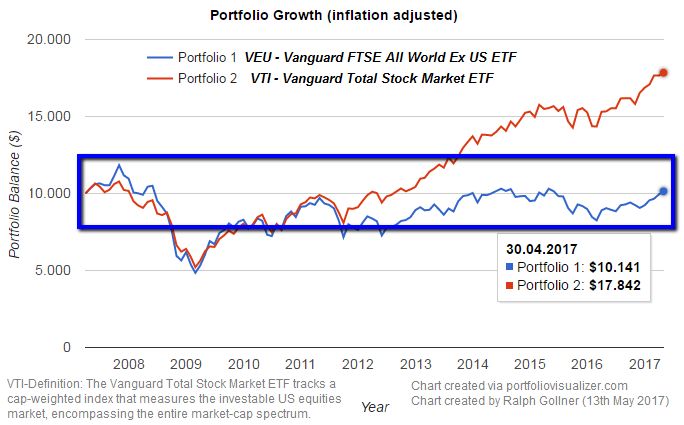
Well, I used the two different ETFs "VEU and VTI" ...
S&P 500 Global Exposure (IT-Sector)
Sill, the S&P 500 relies highly on the domestic economy (being the United States). But recheck the IT-Sector, but also the companies from the Industrial Sector, which have a relevant portion of their sales abroad.
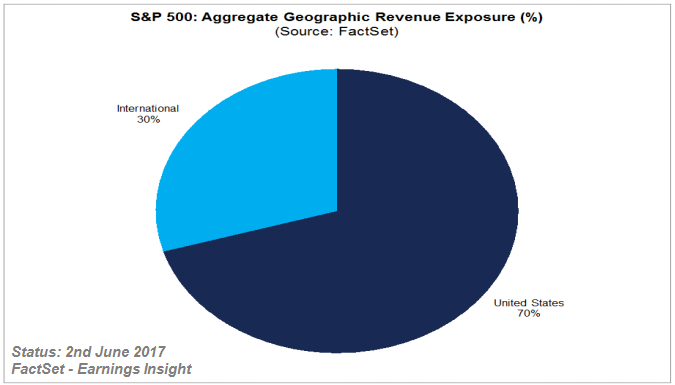
The ongoing global recovery is especially ...
Dow Jones Utility Average
A bullish signal in U.S. stocks is being issued by an indicator that few investors ever focus on: the Dow Jones Utility Average. That's because this benchmark which was created 88 years ago, in 1929, is thought to be a leading indicator...
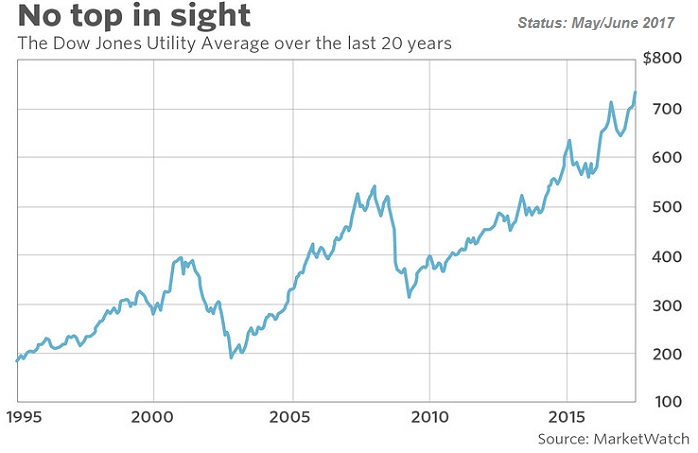
...of tops and bottoms in ...
Nasdaq Composite (Momentum-Catch up)
If there is a trend and the Index and its components are gaining momentum then "everything is possible". Remember the crazy Momentum in the final years of the 90s (last century):
In the following period, including the Financial Crisis Breakdown in the ...
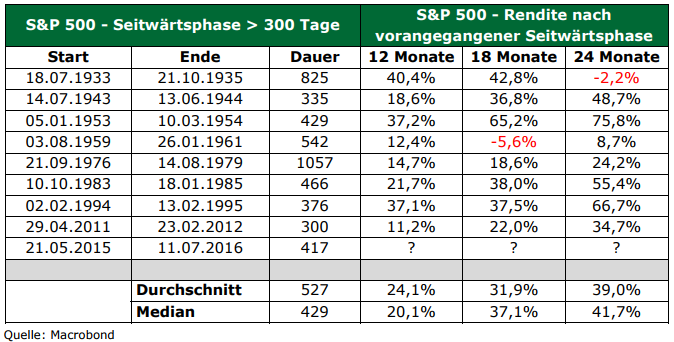
S&P 500 Seitwärtsphasen ( > 300 Tage)
Am 11. Juli 2016 stand der Index bei ca. 2.137 Punkten. Würde nun der Index am Ende einer Seitwärtsperiode so stark ansteigen, wie bisher, würde der S&P 500 im Juli 2018 bei ca. 2.970 Punkten stehen (siehe Durchschnitt lt. Schaubild)...
 ...
...
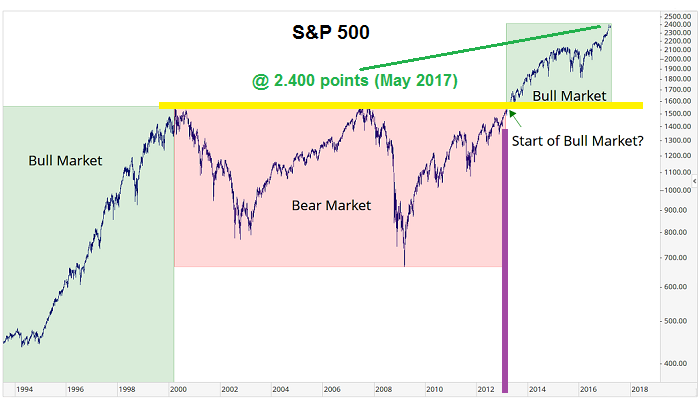
S&P 500 @ magic 2,400 - level
The broad US-Stock Market (S&P 500) is currently at an interesting level near 2,400 points. Furthermore also two weekly Moving Averages are crossing this level soon > relevant decision may be upcoming...
In following chart one can clearly see, that an ...
The MSCI Emerging Markets Index
The "EM-Index" captures large and mid cap representation across 24 Emerging Markets (EM) countries*. With 845 constituents (as per July 2017), the index covers approximately 85% of the free float-adjusted market capitalization in each country.
*EM countries ...
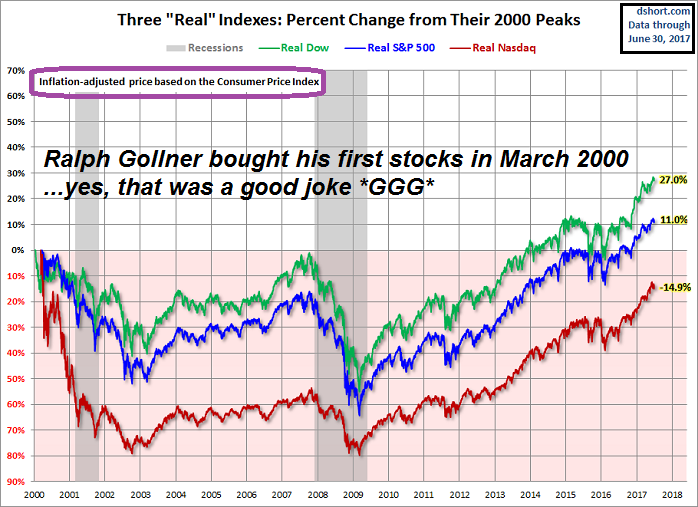
"Real Indexes" from the year 2000 onwards
(Status: June 2017)
The following chart requires little explanation. Reminder: So far the 21st Century has not been especially kind to equity investors (in real terms!). Yes, markets do bounce back, but often in time frames that defy optimistic...
...
DOW - biggest contributors 2017
(year-to-date)
Over the previous two weeks the Dow Industrials has been diverging from most other Indices and particularly the Dow Transports. An important part of the divergence has been the relative narrowness of the rally in the Dow.
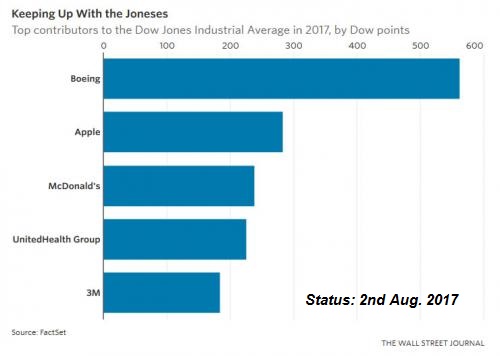
In the WSJ, Justin ...
Stocks versus Bonds
(last 2 years)
Stocks can fall faster and further than junk bonds, but they also offer the possibility of significant capital appreciation in the long term - here a comparison between the broad US-Stock Market & HY-Bonds (S&P 500 vs. Corp. High Yield Fund / "HY-Bonds").
...
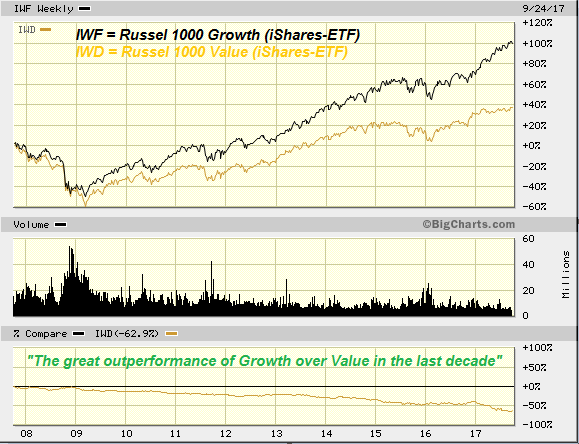
Value Investing Having Its Worst Run Since The Financial Crisis
Status: Aug/Sep. 2017
Over the past decade, the performance of U.S. growth stocks has been almost three times better (!) than that of value stocks. Index fund giant State Street Global Advisors calls it "the longest...
...
Dosenwachstum 2007 bis 2016
Dosenblase oder was? *lol*
Nun ja, man sollte sich Themen wie "Wachstumsreihen" spielerisch nähern. Reminder: Durch den Zinseszins kommt es bei einem Wachstum von ca. 8% p.a. zu einer Verdoppelung nach ca. 9 Jahren; Hier z.B. ein "Dosenwachstum":
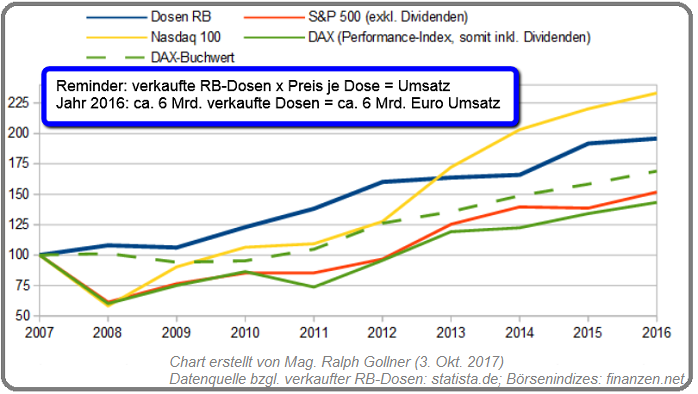
Zur Info: Im ...
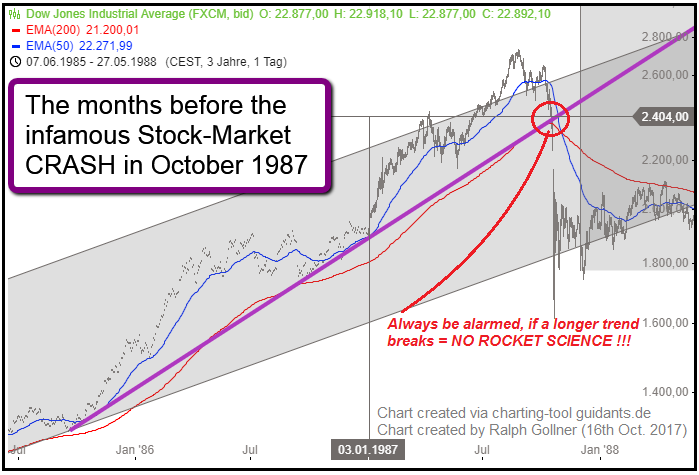
30 years after historic stock market crash
(Oct. 1987)
This week will mark the 30th anniversary of the market crash of 1987, better known as Black Monday. On 19th Oct. of that year, financial markets around the world plunged into chaos. The Dow Jones industrial average plummeted 22.6 %,...
...
DAX und DOW seit dem Jahr 1999 (Status: Nov. 2017)
| Ergebnis seit Ende 1999: | DAX | DOW JONES |
| Gewinnjahre: | 13 | 12 |
| Verlustjahre: | 5 | 6 |
| Gewinnhäufigkeit: | 72,2% | 66,7% |
| durchschnittliche Gewinnhöhe: | +18,6% | +13,1% |
| durchschnittliche Verlusthöhe: | -25,3% | ... |
MDAX & Nasdaq-100 (2013 - Nov. 2017)
5-Jahreszeitraum
MDAX (Performance-Index, somit inkl. Dividenden) versus Nasdaq-100 sind beinahe im Gleichlauf emporgestiegen in den letzten 5 Jahren. Um ca. 140% ist der Technologie-Index Nasdaq-100 samt seinen 100 Aktien im...
...besagten Zeitraum ...
Dow Jones Transportation Average
(magic 9.5k)
Der DJ-Transportation Average (Index) sollte schön über dem 9.474er-level im Zeitraum der nächsten Monate verbleiben - Ansonsten wären Turbulenzen bei Notierungen unter dieser Marke wohl keine grossartige Überraschung...
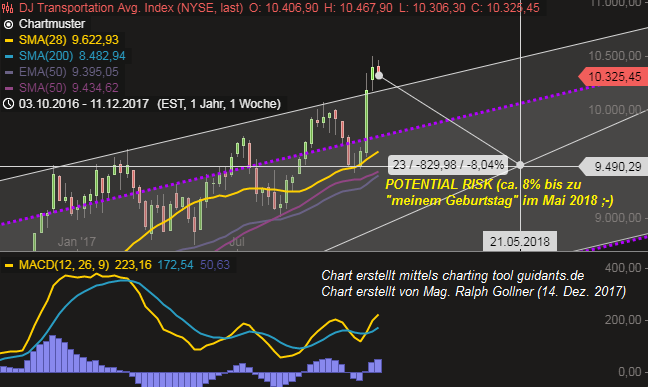
cheers Ralph ...
Dow Jones Transporation Average
(Fresh All-Time-High)
Developed more than 115 years ago, "Dow Theory" - created in part by Charles Dow, the founder of the Wall Street Journal - is considered the oldest stock market indicator that's still followed by a broad swath of the investing public.
It ...
"Öl-Index" (WTI-Ölpreis)
Abhängig vom Ölvorkommen und Förderung existieren in Abhängigkeit von der Qualität unterschiedliche Sorten. Die wichtigsten Sorten sind Brent Crude Oil (Europa), West Texas Intermediate WTI (Nordamerika), Oman Crude Oil (Asien) und...
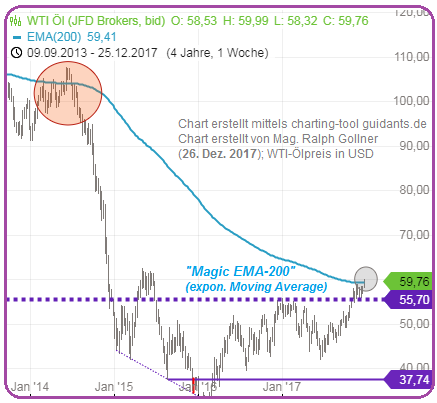
...Arab Light. Entscheidende ...
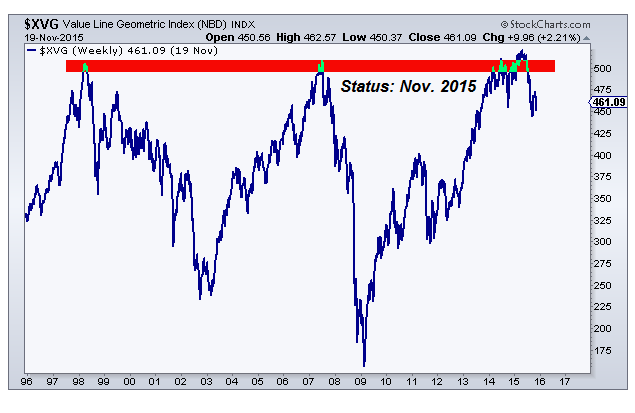
Value Line Geometric Index
All-Time-High
This index is great at providing insight into the current condition of the U.S. stock market: the Value Line Geometric Index (XVG). This index tracks the median move of stocks within the index using the assumption that each stock has an equal...
 ...
...
US 10Year Treasury-Yield vs. Dow Jones (Ind. Average)
According to Bill Gross, a famous long-term bond investor, yields are likely to climb to at least 2.7 percent by year-end 2018. The driving forces include global economic growth, the U.S. Federal Reserve raising its benchmark rate and...
 ...
...
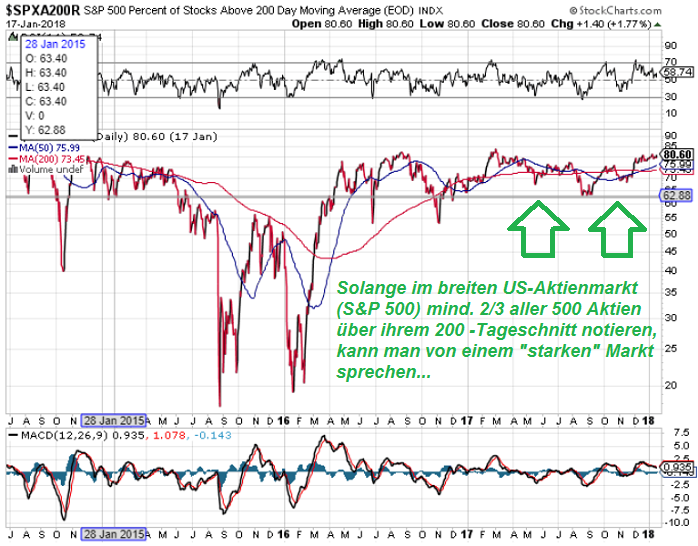
Stärke im US-Aktienmarkt (Aktien > 200-Day Moving Average)
S&P 500 "Marktstärke" laut finviz.com (Aktien > SMA 200-daily): 391 / 500 per Market-Closing am 18. Jan. 2018
391 von 500 Aktien liegen somit über ihrem jeweiligen 200-Tage-Durchschnitt = 78,2% (Stark, da > 75% Marktbreite)
Im ...
Euro Bund-Future
Die Anleihekurse des deutschen Staates lassen sich am Einfachsten am entsprechenden Bundesanleihen-Marktbarometer, dem Euro Bund-Future ablesen: Dieser notiert mittlerweile wieder unter einem "normalerweise maximalen" Niveau von 160 Punkten. 160 Punkte - das ist...
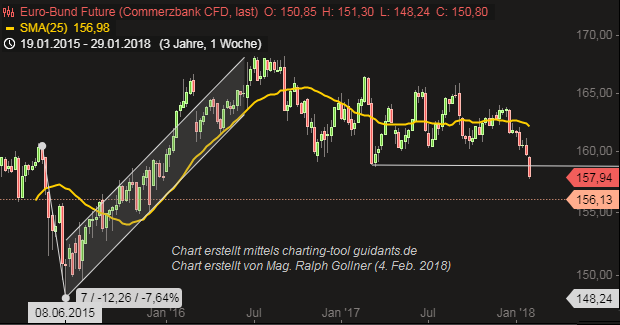
...nicht ...
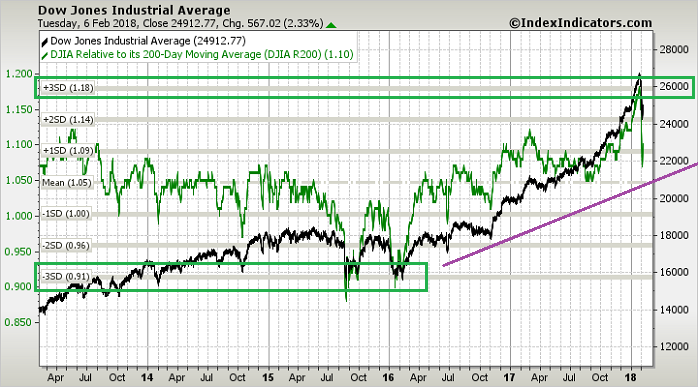
The 200d Simple Moving Average (SMA)
"3 Standard Deviations above/below the SMA200-daily"
Upfront: Some days ago the Dow Jones Industrial-Average Index-level reached a level, which was in distance of 3 standard deviations from its 200-Day Moving Average (SMA-200). Then, suddenly the Index...
 ...
...S&P 500 (Technicals, SMA200-daily)
The US-Stock Market showed a neat Intraday-Turnaround at the end of the trading-week. Therefore a positive sign was given within the last hours of friday's trading day - a signal which could lead to a positive trading week starting next Monday (?):
The ...
Bull Market Length (Definition)
Short reminder: from May to October 2011, the Standard & Poor's 500 Index fell 21.6 percent. Upfront: One may argue that the best starting date of a new bull market is when the prior bull-market highs are eclipsed. That is how how one gets a date like...
...
DAX
(April 2015 versus 13. März 2018)
Kurzer Recap ins Jahr 2015: Der Dax stieg damals bis zum 10. April 2015 auf 12.374 Punkte. Interessanter Vergleich zum heutigen Tag - an welchem das DAX-Aktienbarometer per Tagesschluss bei ca. 12.221 Punkten notiert. >> Macht saldiert ein knappes...
...
Hexensabbat (4 mal im Jahr)
Der "Hexensabbat" oder auch "dreifache Verfallstag" ist immer der dritte Freitag der Monate März, Juni, September und Dezember. Handelskontrakte wie Futures oder Optionen sind zeitlich begrenzt und verfallen in regelmäßigen Abständen. An den großen,...

...
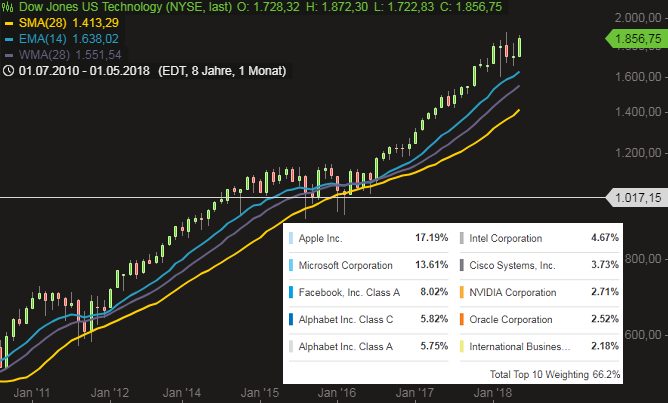
US Technology-Index
(Dow Jones US Technology-Index)
The Dow Jones Technology Sector tracks a market-cap weighted index of U.S. technology companies. The Index is mainly driven by digital trends like: Internet of things, Internet Infrastructure, Chips (not to eat), Tech-R&D, etc.
...
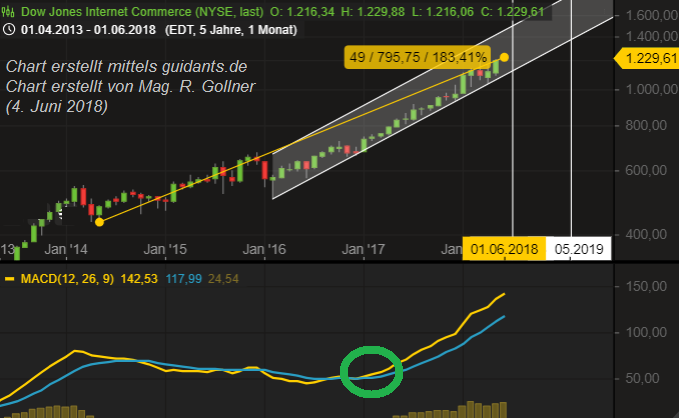
"Dow Jones Internet Commerce"-Index
Seit mehr als einem Jahrzehnt ist das Internet nicht mehr wegzudenken! Ebenso sollte wohl jeder erfahrene Investor wissen, dass das BIP oft gar zu 2/3 vom Privatkonsum getragen wird. Verbindet man nun diese beiden Gedankengänge, landet man beim...
...
NASDAQ-monthly (EMAs)
Recheck the EMAs I applied in the chart above. They could serve as support levels in the upcoming quarters - if needed. We will have to wait and see. For the moment/what is left to say: "THE TREND IS OUR FRIEND"
DAX Kursindex - LANGFRISTIG (2007 - 2015)
(somit exklusive jährlicher Dividenden)
DAX-Kursindex level im April 2015: 6.339 Punkte
DAX-Kursindex level aktuell (25. Juni 2018): 5.625 Punkte
(Aktuell sind wir somit mehr als 10% unter dem Allzeithoch vom April 2015
DAX-Kursindex level im April ...
Status Quo
YEAR-TO-DATE Performance von Indizes
Viele Investmentfonds (auch) im Milliardenbereich stehen dieses Jahr im Minus mit ihrer Performance, haben somit (voerst) Kapital Ihrer Anleger vernichtet (Buchverlust vorerst). Noch ist aber erst Halbzeit in diesem Jahr. Insbesondere...
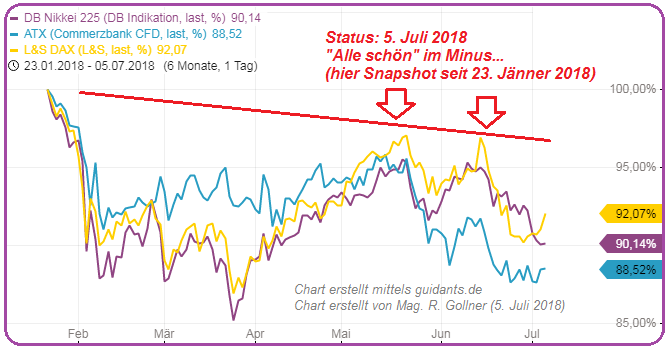
...ein ...
Dow Jones US Technology (Index)
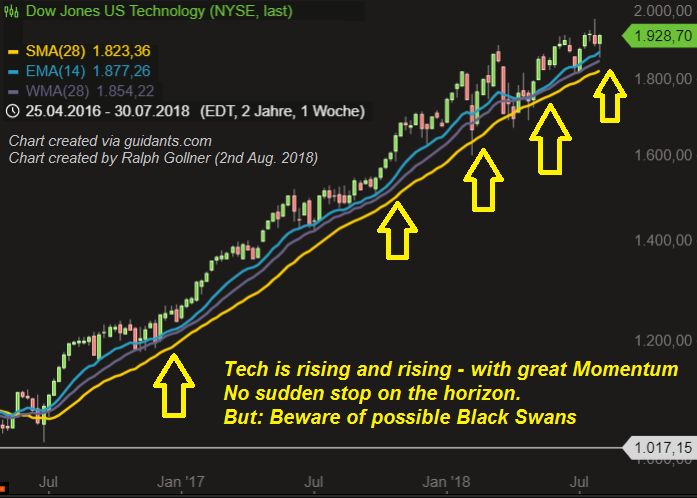
Fascinating strength in a strong-performing Market-Sector (Technology)
Dow Jones schließt heute bei > 26.000 Punkten
Der Dow Jones Industrial Average setzt sich (bekantermassen) aus 30 Werten zusammen. Folgend ein Auszug über die TOP 20 der letzten12 Monate. Wer nicht investiert war, hat wohl Einiges versäumt. Man sieht, sich zumindest den Dow...
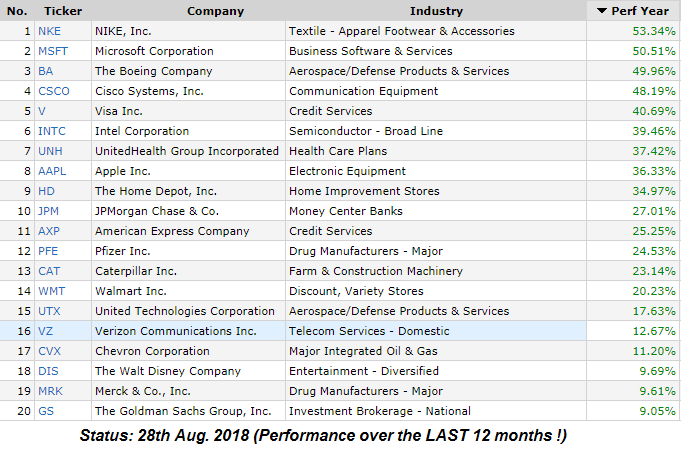
... Jones ...
The Decade of Low/NO RETURNS (2000 - 2013)
The media is so crazy about he rich Stocks-investors getting richer. From the year 2000 until 2013 mostly the Broker were becoming richer by collecting transactions fees from nervous investors.
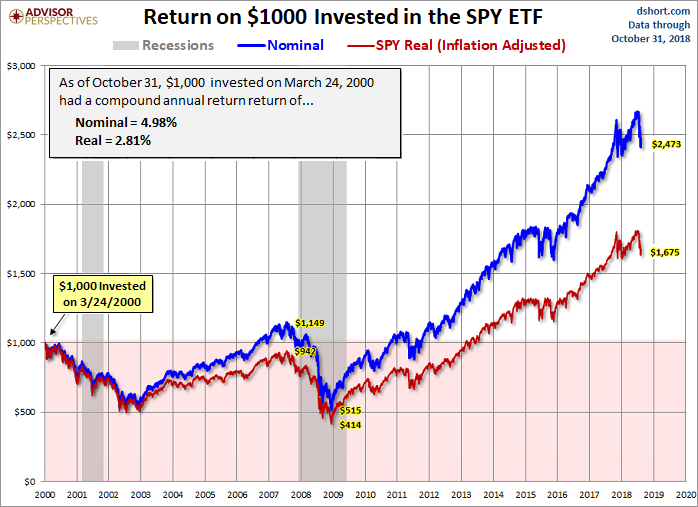
Therfore one should never forget >> "Investing is ...
DAX, MDAX & SDAX
Von 120 Aktien in diesen drei Indizes haben den Handelstag nur 7 Notierungen im Minus geschlossen!
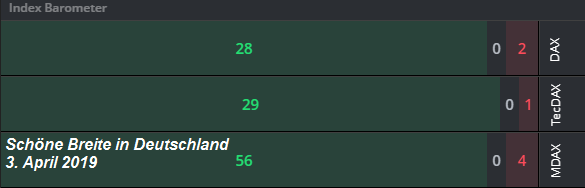
Alle Angaben ohne Gewähr
Das war "STARRK"
Warren Buffet and his
"easy decades"
aka: FAT TAILWIND
Kindergarden-Börse (easy Investing-periods) Die 50er und die 60er im letzten Jahrhundert waren die beiden ersten Dekaden, in welchen Warren Buffet seine Investmentkarriere starten durfte. Lucky shot i guess.
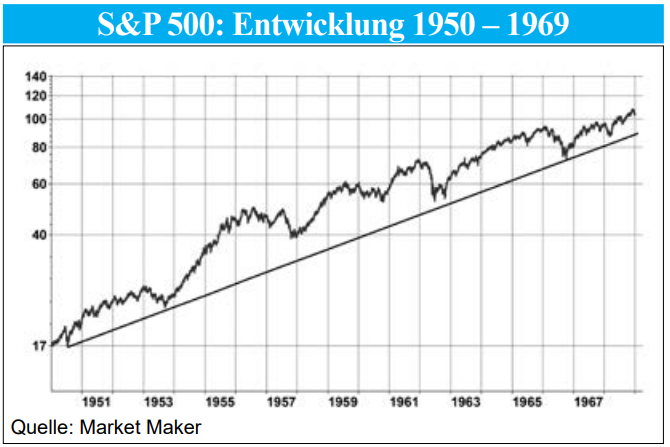
Aber spannend wird es nun ...
Dow Jones Ind. Average (4. Okt. 2019) &
Fibonacci
Was versteht man unter Fibonacci-Analyse?
Leonardo von Pisa, genannt "Fibonacci", einem italienischen Mathematiker aus dem 13. Jahrhundert, verdanken wir nicht nur die Einführung der indisch-arabischen Zahlen und...
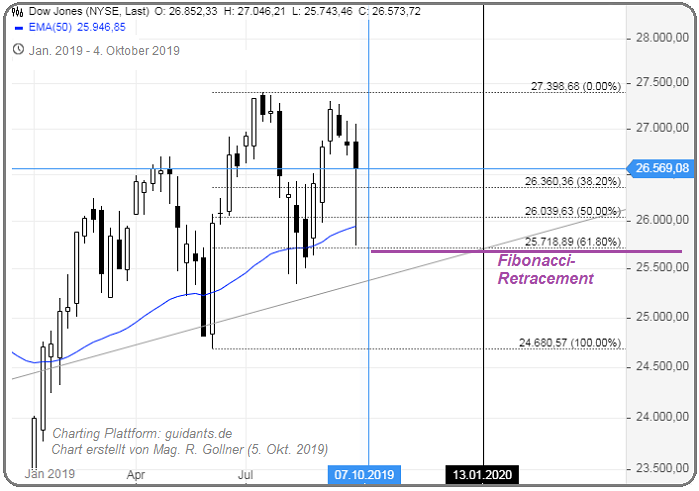
...die ihr zugrunde ...
The 200d Simple Moving Average (SMA)
"3 (or even 4) Standard Deviations above/below the SMA200-daily"
Upfront: Some days ago the S&P 500 reached a psychological level, which was near to its 200-Day Moving Average (SMA-200). So currently the "Mean" of that moving average is not far away:
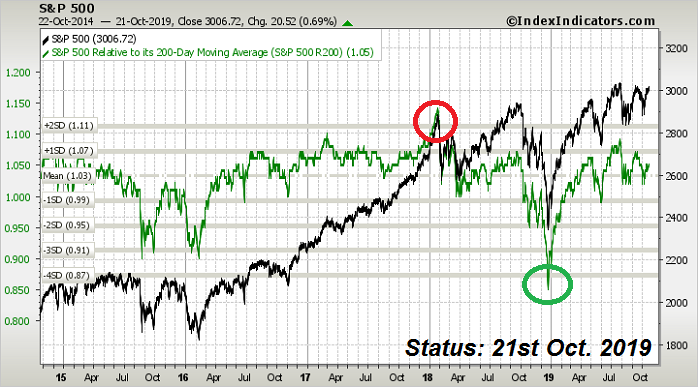
But ...
Momentum is on (Jan. 2020)
The S&P 500 is still on "some" fire. Since Mid-December 2019 the three indicators "Market Momentum, Stock Price Strength & Stock Price Breadth" are on fire (see CNN Fear&Greed-Index, all 3 indicators on fire "Extreme Greed")!
If the S&P 500 can hold the ...
S&P 500, Nasdaq-100 und Dow Jones Industrial Average
Von allen Aktien, welche sich in den 3 US-Aktienindizes befinden, haben heute mehr als 90% schön im Plus geschlossen. Na, wenn das keine good news sind :-)
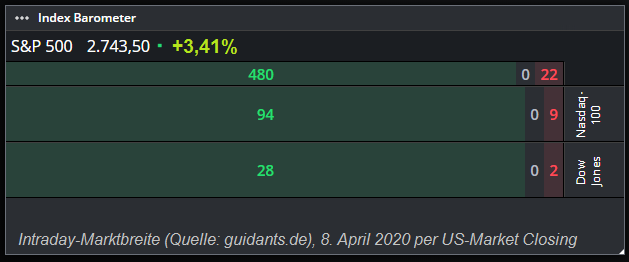
Alle Angaben ohne Gewähr
Das war STARRK
p.s. ich bin auch noch gespannt, ob es ...
Nachtrag und Nachschlag zu letzter Woche
(Freitag, 8. Mai 2020)
Quer über verschiedene Aktienmärkte, sei es nach Geographie oder Investment-Stil, ist der Markt zum Schluß der letzten Woche angestiegen. Eigentlich ein starkes Zeichen der globalen Märkte, sei es der japanische...
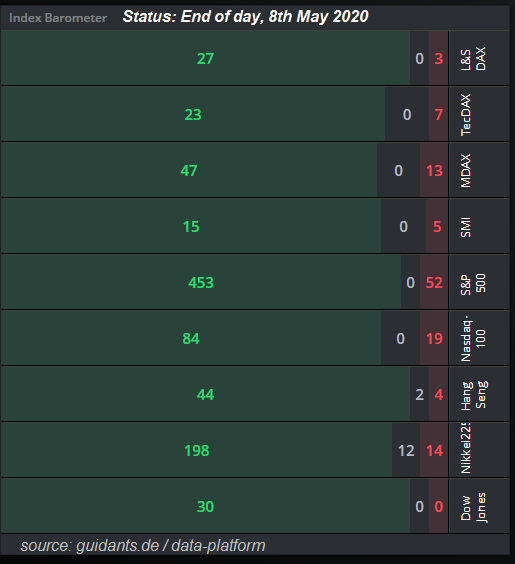
...Nikkei, ...
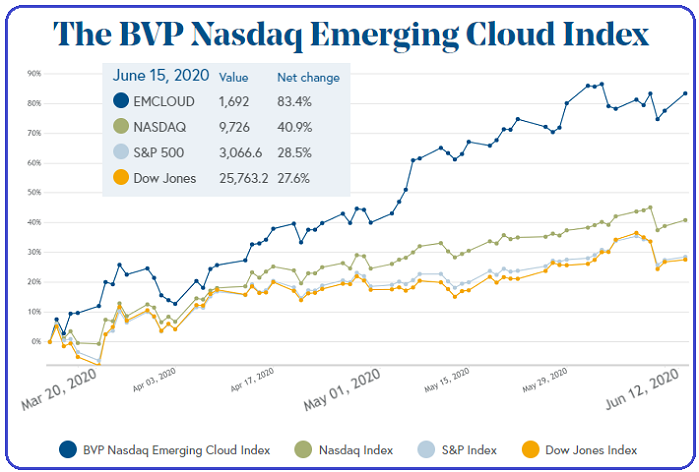
Cloud and some Cloud-companies
The Covid-19 crisis accelerated the short-term and medium-term push towards Cloud-computing. It can be seen immediately when spotting the Bessemer Venture Partners "Cloud Index" (timeframe: 16th March until 15th June):
(HIGH) Inflation & the US-Stock Market
Let's recheck how the Stock Market did in the high-Inflation era (mainly) of the 70s. To begin with, the historical data provided by portfoliovisualizer showed an average inflation number of ca. 9.2% from the years...
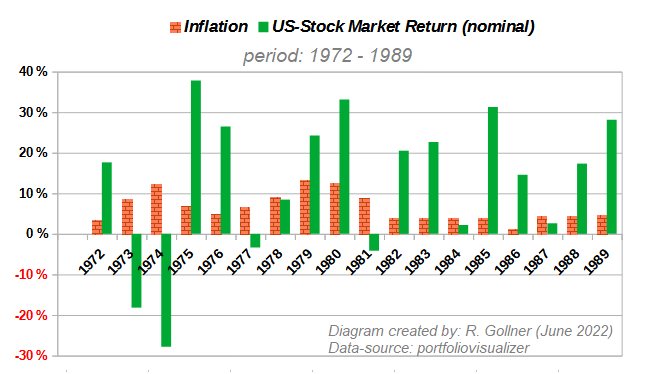
...1973 until 1981. In these ...
(Historical) Stock Market Returns
Many might be surprised to learn, however, that since about 1800, stocks have consistently returned an average of 6.5 to 7.0 percent per year (after inflation). In 2001, the market capitalization of...
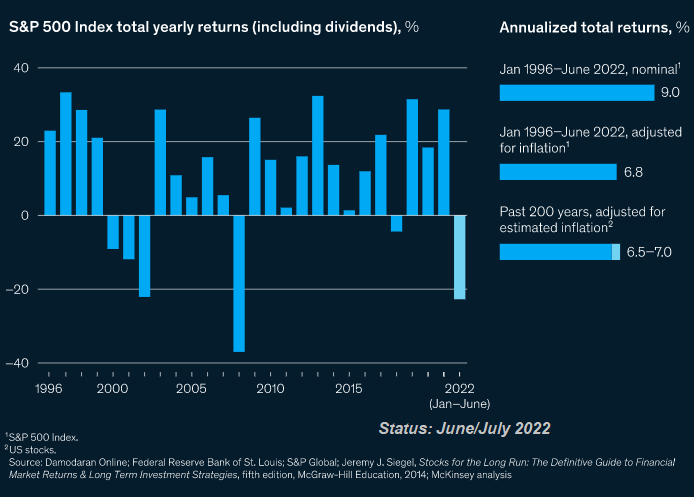
...the companies that made up the S&P 500 was about USD ...
2022 - one of the worst years ever...
While the S&P 500's 18.1% decline was painful, it was only the fourth-worst stock market year in the last 50 years, only half as bad as the 37% decline in 2008, and better than the 22.1% decline in 2002 and 25.9% decline in 1974.
 Yet in each of those ...
MSCI World - interessantes Chartbild
Persönlich finde ich den Kursverlauf vom Weltaktienindex "MSCI World" sehr interessant. Relativ stabil kämpft sich der Index seit Jahresanfang Richtung Allzeithoch zurück. Es wird nun spannend, ob der Index sein Level auch über...
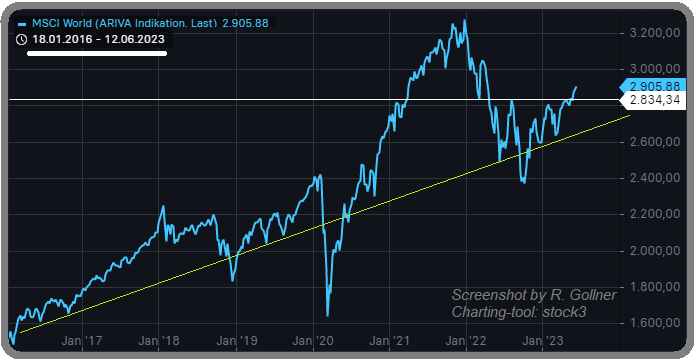
...die Sommermonate ...


