Related Categories
Related Articles
Articles
Russischer Aktienmarkt (RDX-USD, RTS)
Bewertung (CAPE), Langfrist-Chart
Der russische Aktienmarkt wurde, final mit dem Ölpreis-Absturz im Jahr 2015, die letzten Jahre tief ins Minus gedrückt:
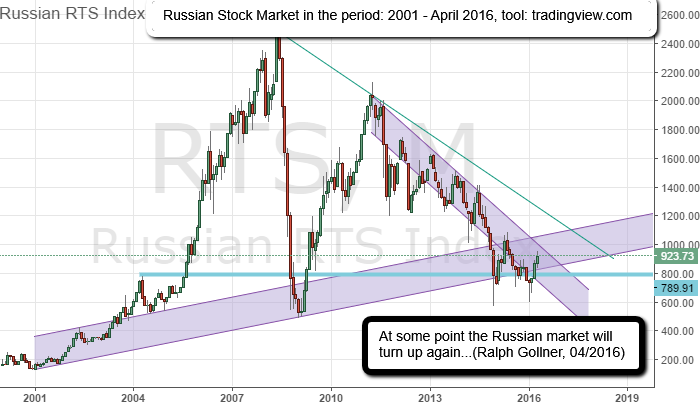
Als ATX-Investor ist man sich dessen besonders bewusst, da teilweise doch eine Korrelation zwischen den Märkten bestehen mag. Der ATX is evtl. so etwas wie die Salami im DAX-Russland-Sandwich.
Das Unternehmen Starcapital veröffentlicht regelmässig brilliante Insights zum Thema KGV, insbesondere zum "CAPE" (welches durch Robert Shiller erstmalig berechnet wurde). Noch mehr Insights und Erklärungen zum Thema "CAPE" findet man weiter unten, bzw. auf der Homepage von starcapital.de.
♦ Per 31. März 2016 liegt das CAPE* beim russischen Aktienmarkt bei 4,9!
♦ Das Preis-Buchwert-Verhältnis im russischen Aktienmarkt liegt bei 0,8.
Folgend dieser zwei Kennzahlen lassen sich nun auf Basis von historischen Erfahrungen erwartete Jahres-Renditen berechnen.
Auf 10-15 Jahren wäre dies beim aktuellen CAPE* von 4,9 eine jährliche Rendite von 15,9% bis zum Jahr 2026 (bzw. 2030). Ähnliches gilt auch für die aktuelle KBV-Kennzahl von 0,8: Die erwartete Rendite wäre folgend historischer Beobachtung auf anderen Märkten (!) demzufolge 13,1% pro Jahr bis zum Jahr 2026 (2030).
Hierzu eine kurze Anmerkung zu *CAPE und eine Auswertung aus historischer Sicht (Englisch):
Campbell and Shiller [1998] developed a cyclically adjusted price-to-earnings ratio (CAPE), which puts the current market price in relation to the average inflation-adjusted profits of the previous 10 years. The purpose of the 10-year observation period is to ensure that the profits are averaged over more than one earnings cycle. The adjustment for inflation ensures the comparability of profits even at times of high inflation. As such, the CAPE measures whether the value of an equity market is high or low compared to its profit level adjusted for an economic cycle - to which it will very likely return.
Historical Minimum CAPE (Sweden): 4.8 (current CAPE: 18.8)
http://www.starcapital.de (Sweden-Cape-Min., .pdf / Page 9)
Minimum CAPE (S&P 500 since 1881): 4.8 (current CAPE: 24.6)
Interessant wäre zu wissen, was die erwarteten Renditen für den Indexstand des RTX bedeuten (würden)?
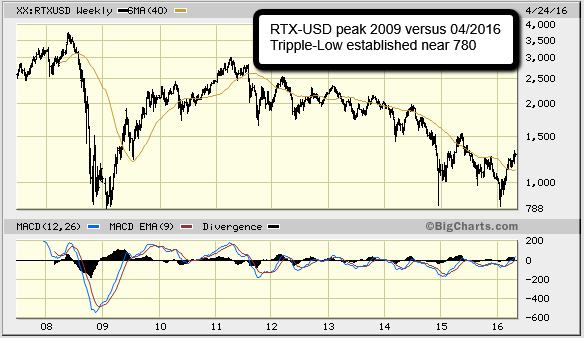
Der Höchststand im RTX-USD lag bei über 3.600 Punkten (im 1. Halbjahr 2008). Zwischenzeitlich notierte der Index vor einigen Wochen im Q1/2016 bei ca. 800 Punkten. Bei einem aktuellen Punktestand von ca. 1.250 Punkten würde ein Anstieg bis zum historischen All-Time-High im Jahr 2030 somit eine jährliche Rendite von > 7% bedeuten.
Das nächste Problem wäre aber wohl, das man nicht weiss, ob
a) dieses Ergebnis tatsächlich eintreten wird, und
b) ob man solange zuwarten kann (Geduld?, Alternativen?)
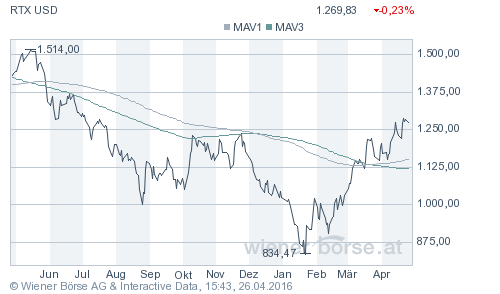
Praktischerweise notierte der RTX-USD per Aug. 2015, Jan. & Feb. 2016 jeweils bei ca. 1.000 Punkten, somit fällt eine Berechnung der bisherigen kfr. Performance sehr leicht. Alleine seit Aug. 2015 erfolgte bisher ein Anstieg von mehr als 25%. Gegenüber dem Tiefststand von ca. 834 Punkten im Jan. 2016 hat der Index gar bereits mehr als 50% zugelegt!
Aus charttechnischer Sicht lässt sich weiters noch sagen, dass per April 2016 der Index sowohl über seinem SMA-200d, als auch dem EMA-200d liegt! Dies kann für einige Langfristinvestoren ein langfristiges Einstiegsignal bedeuten. Im folgenden Schaubild (Quelle: wienerborse.at) erkennt man das (kfr.) wichtige Level um 1.250 Punkte:
Um das CAPE-Rechnungsbeispiel noch einmal kurz zu erläutern folgende Übersicht einer Langfrist-Auswertung zu einer kleinen Auswahl an Ländern:
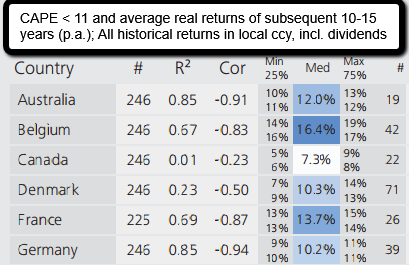 Starcapital.de - Erklärung (auf Englisch): The table shows the average returns (median, “Med”) over the subsequent 10-15 years depending on the CAPE in each country as well as the statistical relationship by reference to “R²” and the correlation (“Cor”). All returns are measured in local currency, incl. dividends, annualised and inflation-adjusted (using local CPI indexes from Datastream). The analysis of the single countries spans the time frame from 12/1979 to 05/2015 insofar fundamental and performance data was available (Source: MSCI, own calculations). For the USA, data starting from 01/1881 (Source: Shiller [2015]) was additionally considered. The last performance time frame is the period from 05/2000 to 05/2015. The row “All Countries” spans all 4,889 months in the sample (“#”). The “Max” and “Min” columns represent the maximum and minimum of returns observed in the country, “75%” (“25%”) the 75th (25th) percentile of real 10-15 years returns. The grey rows “USA” (MSCI USA), “S&P s. 1979” (S&P 500 since 12/1979 based on Shiller data) and “MSCI Count.” (only MSCI Countries) are shown for informational purposes only and are not included in “All Countries”. The “R² D“ column indicates the extent to which the R² of “All Countries” changes without the respective country.
link zu "Fundamentals Russia" (Status April 2016/slides): http://trueeconomics.blogspot.co.at


