Related Categories
Related Articles
Articles
US 10Year Treasury-Yield vs. Dow Jones (Ind. Average)
According to Bill Gross, a famous long-term bond investor, yields are likely to climb to at least 2.7 percent by year-end 2018. The driving forces include global economic growth, the U.S. Federal Reserve raising its benchmark rate and...

...other central banks reducing quantitative easing policies of buying sovereign debt to repress rates.
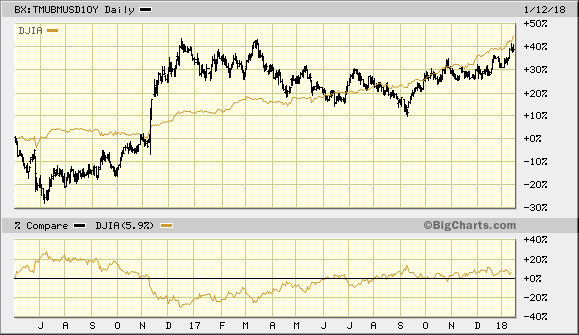
We will see, if the yield can rise -relative to the Dow Jones Industrial Average (US Stock Market-Index)- in tandem or if there will be any big interuptions on the way to the final month of the year: December 2018. In the chart above you can see a Tandem-comparison between the performance of the US-Stock Market (here the Dow Jones Ind. Average) versus the US 10-year-yield from June 2016 onwards.
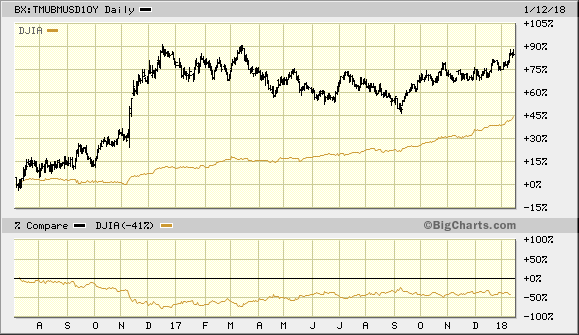
To give you another perspective >> In the next chart you see the same comparison from the time period US-Independence day 2016 (4th July) until January 2018; Here the 10 year Treasuries are still far in the lead...

You can stay tuned via following the shown Rolling-3-Year Chart below (daily updated) of the US 10year-yield versus the Dow Jones Industrial Average (US Stock Market, Large Caps) here:
cheers & all the best
Ralph Gollner
link: https://www.bloomberg.com/news/articles/2018-01-11/gross


