Related Categories
Related Articles
Articles
Dow Jones Industrial Average (Renko-Chart)
July 2011 - July 2016
Developed in the 18th century in Japan to trade rice, Renko charting is a trend following technique. Lateron Renko-Charts were found useful in trading any other financial instrument, like stocks for instance.
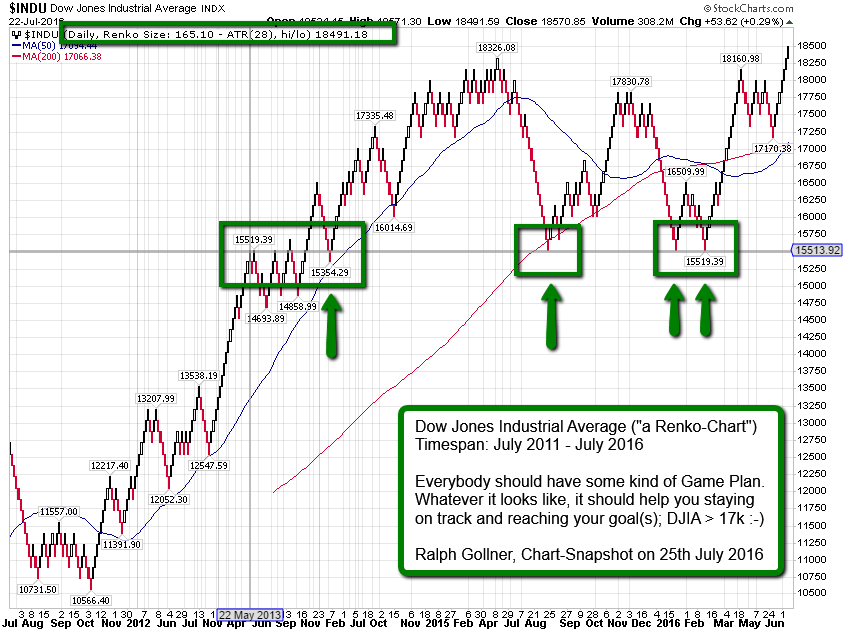
It is excellent for filtering out price "noise" so traders can catch a major part of a given Forex trend, or Stocks-trend, etc. It was believed that the name "Renko" originated from the Japanese word 'renga' meaning 'brick'.
To draw Renko bricks, today's close is compared with the high and low of the previous brick. When the closing price rises above the top of the previous brick by the box size or more, one or more equal height, white (or blue) bricks are drawn in the next column. If the closing price falls below the bottom of the previous brick by the box size or more, one or more equal height, black (or red) bricks are drawn in the next column.
If the market moves up more than the amount required to draw one brick, but less than the amount required to draw two bricks, only one brick is drawn. For example, in a two-unit Renko chart, if the base price is 100 and the market moves to 103, then one white brick is drawn from the base price of 100 to 102. The rest of the move, from 102 to 103 is not shown on the Renko chart. The same rule applies any time the price does not fall on a box size divisor.
Original comment: www.stock-trading-infocentre.com/renko-charts.html


