Related Categories
Articles
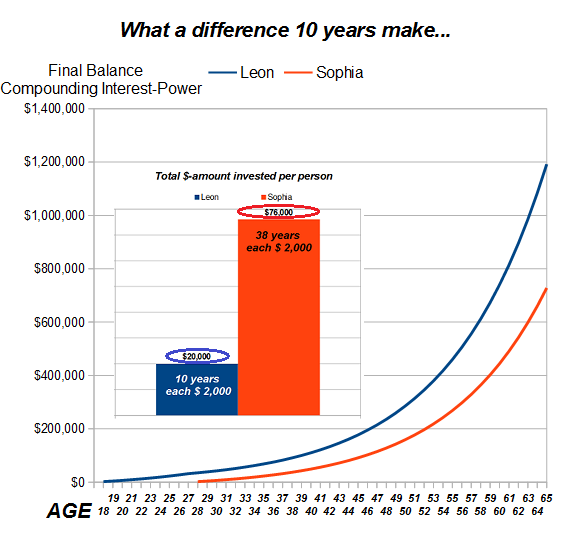
The Power of Compounding
The Magic of starting early and INVESTING LESS!
At the beginning of the 21st century most young people are told that social security won't be there for them when they retire from the work force. Thus, in order to be able to completely retire from the...
...workforce, a person has to invest as early as possible in order to take full advantage of the power of compounding.
NO FINANCIAL ADVICE here !
For Illustration purposes let's follow the story of Sophia and Leon:
They both grew up on the same street in the same city. Their mothers gave birth to them at almost ...
1928 - Nov. 2019 (nearly +10% p.a.)
Interesting insight into the annual returns/decades from the year 1928 onwards:
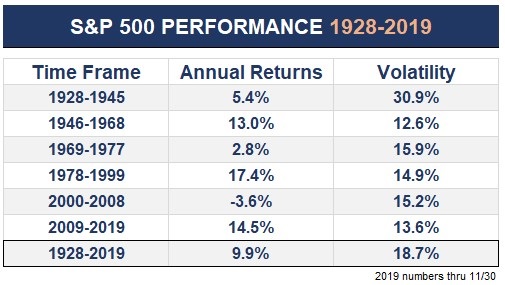
>> fascinating. Please take a look at the easy period 1978 (my birthyear) until 1999!
RECHECKING
"Quantitative Momentum: A Practitioner's Guide to Building a Momentum-Based..."
(Authors: Wesley R. Gray, Jack R. Vogel)
Quarter-ending months generally have the highest returns when comparing low and high momentum portfolios. Once momentum-profits are...
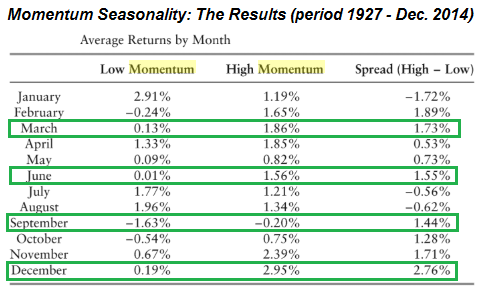
...the largest in quarter-ending months, and this is likey driven by managers who are window dressing their portfolios, one might hypthesise that rebalacning before these quarter-ending months will yield the hightest returns...
Life of PHI
Fibonacci everywhere.
Goldener Schnitt der Schönheit
Bei der Frage nach der Attraktivität greift die moderne Wissenschaft zum Maßband. Laut dem Schönheitschirurgen Stephen Marquardt lassen sich (auch) die Proportionen eines gut aussehenden...

...Gesichts nach dem Maß des "goldenen Schnitts" berechnen.
"Seine aus dieser Formel berechnete Maske der Schönheit" will aufzeigen, ob der Mund zu schmal, das Kinn zu breit oder die Augen "zu klein" sind. Demnach entspricht zum Beispiel das Verhältnis von Nasenbreite zu Mundbreite bei "besonders schönen" Menschen dem goldenen ...
Fibonacci & Warren Buffet (age 14 - 83)
Below the Fibo-Formula the normal wealth effect is displayed through the lifetime of Warren Buffet (started with the age of 14 until the "current" age of 83) if applied via consistent Fibonacci-series. Mr. Buffet was one of the few who managed to...

...use that natural power. The Golden Ratio or phi is a ratio in which if you take a line and cut it in 2 parts, the ratio of the larger part to the smaller part is the same as to the ration of the original line to the larger part. phi is estimated to be 1.618...
Fibonacci numbers and golden ratios ...
Kindergartenbörse 1982 bis 1999 (vs. post-2k)
Ziel einer jeden aktiven Aktienstrategie sollte es sein, im Vergleich zu konventionellen Aktienindizes ein deutlich höheres
Rendite-Risiko-Verhältnis anzustreben; Denn: Der Preis für die Rendite ist das Risiko
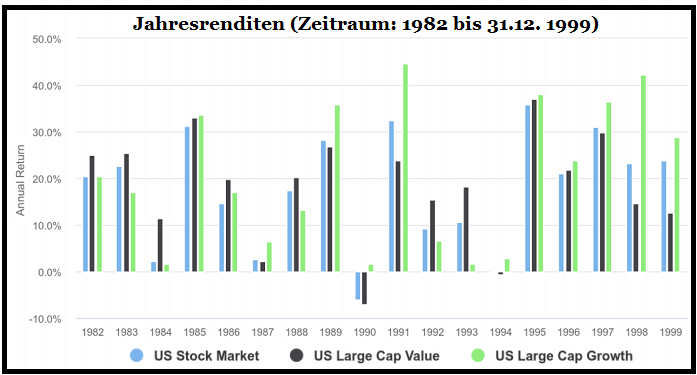
Jeder Rendite steht ein Risiko gegenüber, und erst das Verhältnis dieser beiden Kennzahlen zeigt die Qualität eines Investments. Mit anderen Worten: Jede Rendite muss mit der Währung "Risiko" bezahlt werden. Je geringer diese Kosten - sprich: das Risiko - sind, umso besser ist das Investment.
Im 19-Jahreszeitraum 1982 bis 1999 stand ...
(Nicht nur) Für den Durchschnittsanleger gilt:
ein langer Anlagehorizont ist -wohl- entscheidend
Für einen langfristig erfolgreichen und nachhaltigen Vermögensaufbau führt wohl an einer Investition in die Aktienmärkte kaum...
...ein Weg vorbei. Immerhin können Anleger auf lange Sicht mit Investments in etablierte Indizes pro Jahr inklusive Dividenden mit einer Rendite von etwa 9% rechnen. Dabei müssen jedoch zwischenzeitliche Verlustperioden einkalkuliert werden. Diese werden zwar immer wieder aufgeholt, dennoch kommt hierdurch der Wahl des Anlagehorizonts eine entscheidende Bedeutung ...
"Singles Day"
(Nov. 2018)
Alibaba. Was für Amazon der Black Friday ist, ist für den nicht weniger findigen chinesischen Rivalen der "Singles Day". Der Event fand - wie immer - am 11. November statt und entpuppte sich für Alibaba auch dieses Jahr wieder als...
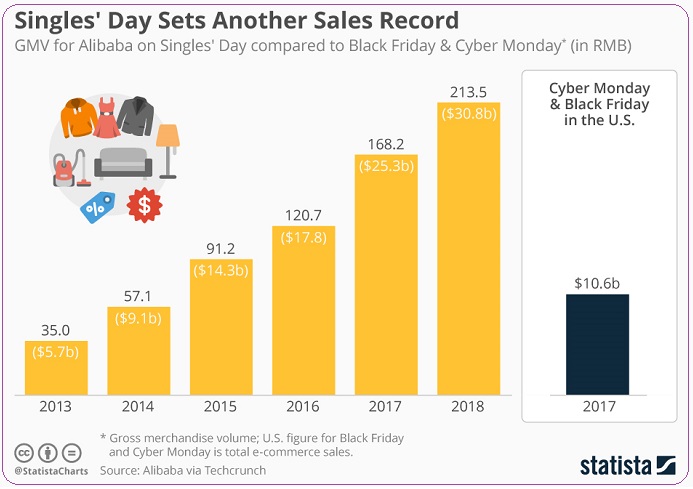
...Gelddruckmaschine. Wie das Unternehmen berichtet, wurden am diesjährigen Singles Day schon in der ersten Stunde 69 Milliarden Yuan umgesetzt. Das sind umgerechnet fast zehn Milliarden US-Dollar.
Und bereits nach 16 Stunden war mit Einnahmen von 169 Milliarden Yen der Rekord aus dem Vorjahr gebrochen. In der US-Währung ...
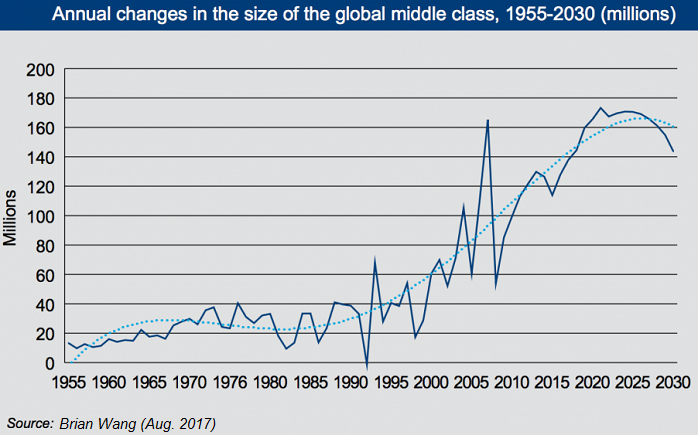
Globale Mittelschicht
(Status im Jahr: 2017)
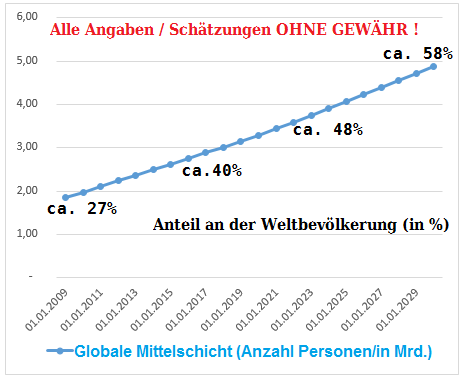
Eine atemberaubende Entwicklung ist im Gange. Ungefähr 140 Millionen Personen stossen jedes Jahr zur globalen Mittelschicht hinzu. Dieser Anstieg könnte sich in den nächsten 5 Jahren sogar noch erhöhen: auf 170 Millionen Menschen jährlich. Gleichzeitig soll der Europa- und U.S.A.-Anteil an der globalen Mittelschicht von ca. 50% auf ca. 22% zurückgehen.
Links / Live-counter:
Very scary months for the "new investor"
According to history, the dangerous zone from a time-perspective might me the period starting from July until October; Please recheck for yourself: 15 out of the 20 (75%) biggest one-day Crashes occured during that period:
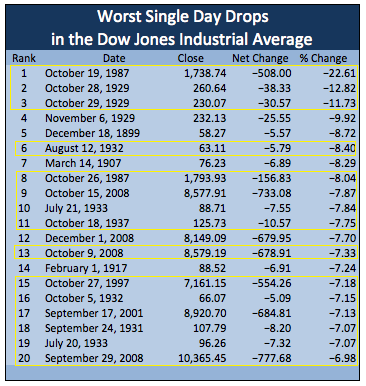
Let us rethink this statistics again in the upcoming year (2019), since 2018 has been a decent year until September ! - with an extraordinary -bearish- monthly performance for the US-Stock markets now in October (2018) - so far.
Zinseszins
(Wake-Up Call)
Eine klare Botschaft: Je länger wir sparen und dabei regelmässig Zinsen erhalten, umso stärker wächst das Vermögen an. Und je höher die Verzinsung ausfällt, desto kräftiger fallen die Vermögenszuwächse pro Jahr aus. Nimmt man an, dass...
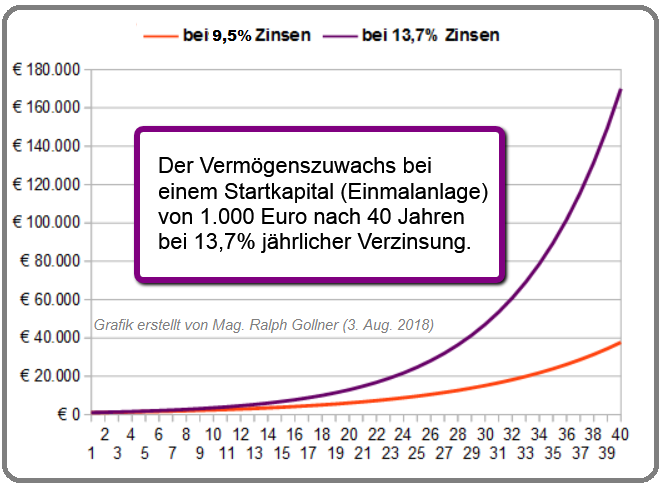
...man 1.000 Euro 40 Jahre anlegt, kann man den Zinseszinseffekt und seine unglaubliche Kraft einfach-er verstehen. Legt man also 1.000 Euro zu einer jährlichen Verzinsung von 13,7% an, beträgt das Kapital nach 40 Jahren ca. 170.000 Euro.
Es gibt also einen kleinen, feinen Unterschied zwischen 9,5% und 13,7% jährlicher ...
Understand the exponential function!
University of Colorado Professor Albert Bartlett was widely viewed as a pioneer on explaining the arithmetic involved in the world's population, energy, and sustainability issues.

Fundamentally, linear functions are just addition. Unfortunately, this is the conception of growth most people are stuck looking at the world through. But, just to remind us all: The vast majority of modeled growth relationships, however, utilize exponential functions and multiplication.
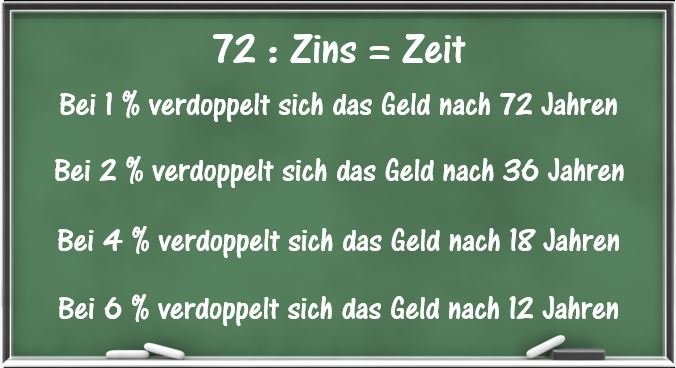
Die 72er-Regel
(Der Zinseszinseffekt)
Die 72er-Regel ist eine Faustformel aus der Zinsrechnung. Die Regel gibt näherungsweise an, nach wie vielen Jahren sich eine verzinsliche Kapitalanlage im Nennwert verdoppelt (siehe folgende Grafik). Dazu teilt man 72 durch die Prozentzahl des...
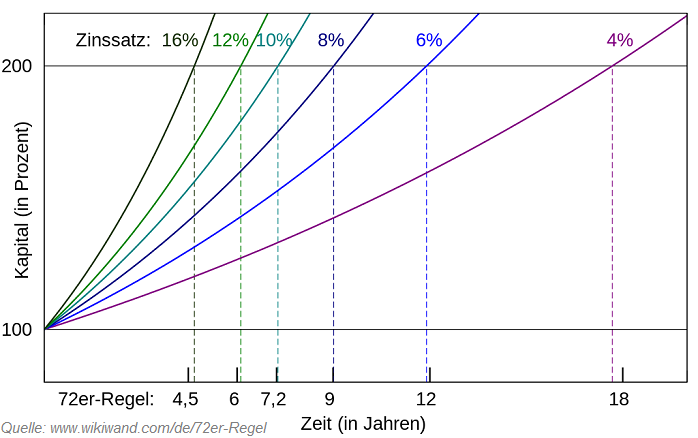
...jährlichen Zinssatzes des angelegten Betrages.
BEISPIELE
In welcher Zeit t wird sich ein Betrag, der zu einem Zinssatz von i = 8 (Prozent) pro Jahr angelegt ist, verdoppeln?
Antwort: 72/8 = 9 (Jahre)
Welchen Zinssatz i (in Prozent) benötigt man, um ein Kapital im Zeitraum t = 12 (Jahre) zu verdoppeln?
...
Investieren über Sparpläne (?)
Selbst mit kleinen finanziellen Schritten kann ein grösserer Betrag angespart werden. Das geht theoretisch/zum Beispiel mit Sparplänen. Außerdem spielt man hier den Zinseszinseffekt für sich aus. Schauen wir uns folgende Beispiele an: Aus monatlichen...
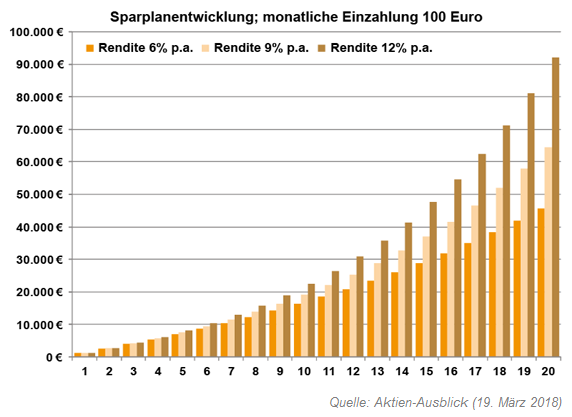
... Einzahlungen von nur 100 Euro wird bei 6% jährlicher Rendite nach 20 Jahren ein Anlagebetrag von 45.577 Euro. Dies entspricht 24.000 Euro Einzahlungen und 21.577 Euro Gewinn, was einen 89%igen Wertzuwachs des eingesetzten Kapitals bedeutet. Bei einer 9%igen Jahresrendite entsteht nach 20 Jahren ein ...
Inflationszahlen Österreich
(1900 bis Dez. 2016)
Österreich und (s)ein verstörendes 1. halbes Jahrhundert (1900 bis 1950); (Nicht nur) aus Finanzmarktsicht schaut der Zeitraum 1900 bis 1950 in Österreich verherrend aus...Was dies mit dem Vertrauen der Bevökerung und von Investoren...
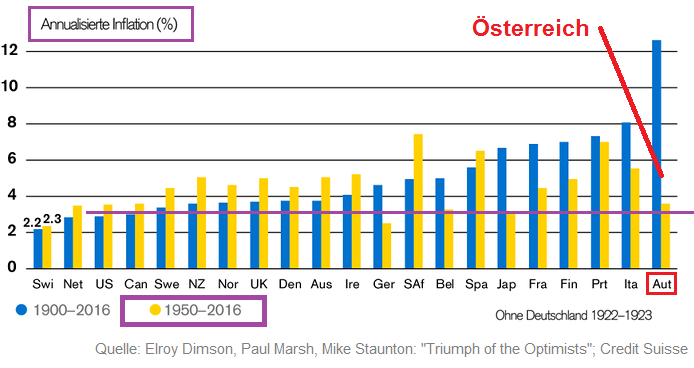
Hinweis: Weder vergangene Wertentwicklungen noch Prognosen haben eine verlässliche Aussagekraft über zukünftige Wertentwicklungen. Quelle: Elroy Dimson, Paul Marsh, Mike Staunton: "Triumph of the Optimists"; Credit Suisse
..."machen kann", ist wohl auch selbsterklärend. Die Aktionärsquoten in Österreich ...
Autonomous Driving
(Status: year 2017)
The societal benefits of autonomous driving; Imagine a world with fewer accidents, fewer traffic deaths, greater energy efficiency, and lower insurance premiums. This is the world of autonomous driving. It brings mobility to people who lack easy...
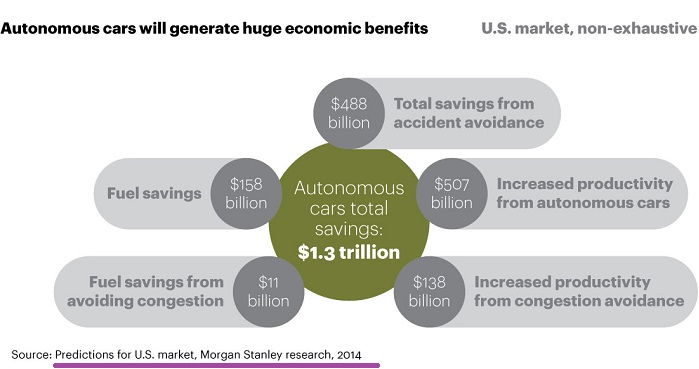
...or practical access to driving, such as the elderly and disabled. It also appeals to the lifestyles and virtues embraced by millennials, such as health, entertainment, and mindfulness. The estimated annual savings for the United States alone is expected to be around USD 1.3 trillion, as shown in the ...
The World's Wealthiest Cities
Following Snapshot gives you a selection of the "Top 15 Cities", the "15", which in total globally hold USD 24 trillion in Wealth. >> That's about 11% of the world's total private wealth. Why the focus on Asia here? Well, let's recheck the future...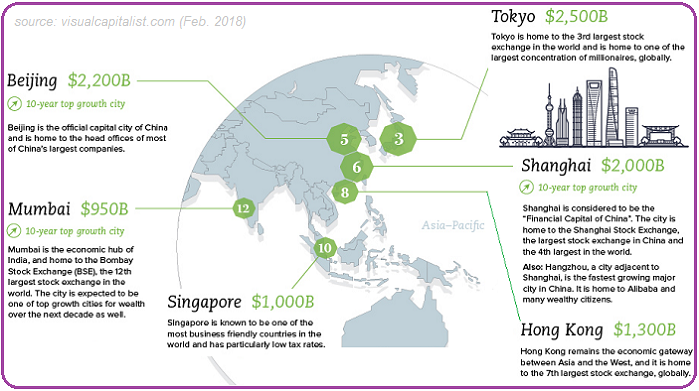
This extract from the "Chart of the Week" is a VisualCapitalist-feature
...trends: Global wealth is expected to rise by 50% over the next decade, reaching (potentially) USD 321 trillion by the year 2027. This will again be driven by strong growth in Asia...(see also the .pdf-link at the end of this ...
Network effects
It's one of the most important concepts for business in general and especially for tech businesses, as it’s the key dynamic behind many successful software-based companies. Understanding network effects not only helps build better products, but...
...it helps build moats and protect software companies against competitors' eating away at their margins.
See what happened to Bitcoin in the last quarters:

links:
Künstliche Intelligenz
(Mögliches Potenzial 2017 bis 2025)
Hinter dem Begriff Künstliche Intelligenz (KI) verbirgt sich die Fähigkeit von Computern, menschliche Tätigkeiten zu übernehmen, meist jedoch schneller, präziser oder auch günstiger als ihre Vorbilder. Die technologischen...
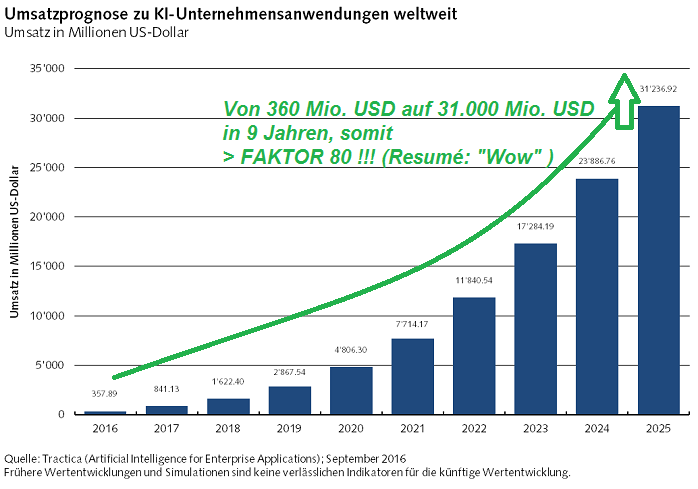
...Voraussetzungen sind jetzt gegeben. In den vergangenen Jahren hat das Gebiet gewaltig an Bedeutung gewonnen. Ermöglicht wurde dies durch die Verfügbarkeit von leistungsfähigen und zugleich günstigen Rechnern auf der einen Seite und von enormen Datenmengen auf der anderen. Denn damit Computer intelligent ...
Stock Market Returns (Decades)
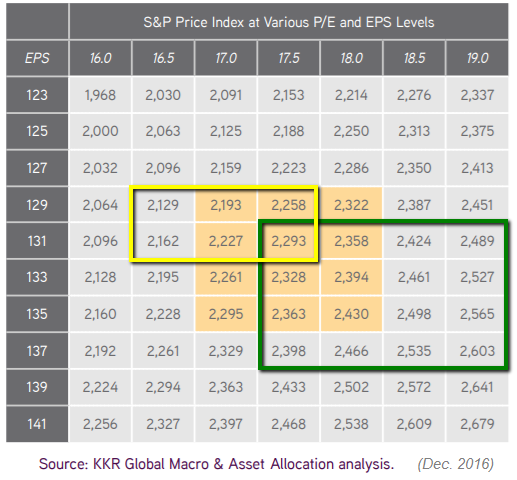
Although it is hard to observe in the everyday noise of the stock market, in the long run stock prices are driven by two factors: earnings growth (or decline) and/or price-to-earnings expansion (or contraction). ANNUAL StockMarket-Returns from 1930 until 2000:
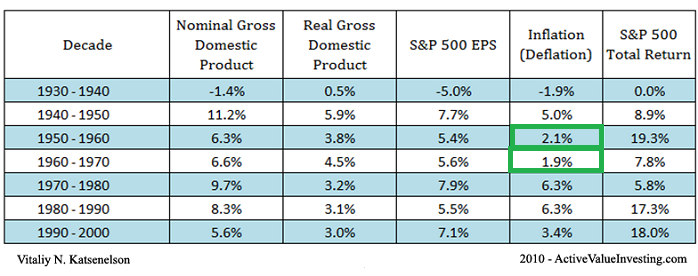
As is apparent from the Exhibit above, either by a decade at a time or a market cycle at a time, it is exremely difficult to find a short-term link between stock performance and the economy (e.g., GDP, corporate earnings growth, or inflation). The connection does exist, but periods of disconnect ...
Tagesgeld und Inflation
Status: 15.07.2017
In den letzten 20 Jahren war über diese ganze Zeit noch nie der Abstand von Inflation zu Tagesgeldzins so hoch wie in den letzten Monaten. Weiteres Ansteigen der Inflation ist nicht ausgeschlossen,...
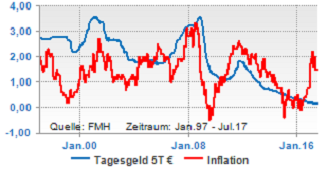
...aber ein baldiges Anziehen der Tagesgeldzinsen dürfte etwas länger dauern. Bei dieser Entwicklung lautet der Wunsch oft, möglichst durch Beimischung anderer Geldanlagen den Verlust aus Tagesgeld und Inflation ausgleichen. Risiko inbegriffen, dass es vielleicht doch nicht reicht.
Quelle/link: ...
US stock market returns don't look that extreme relative to history
Stock market returns are not as extreme as some might suggest. Following chart contrasts the current five-year return of the S&P 500 with the historical distribution of five-year returns.
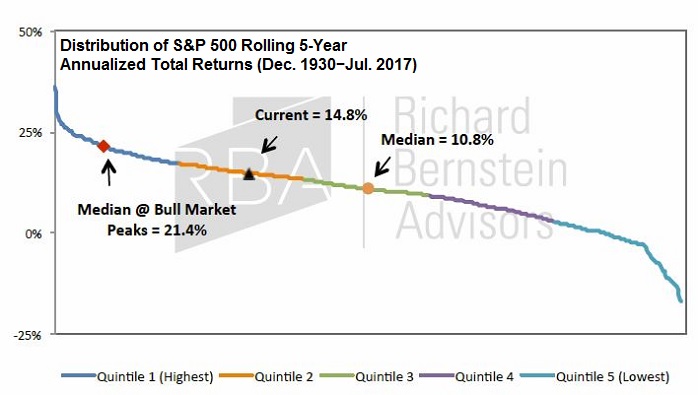
Of course, the recent experience is above the median because there is a bull market. However, one should immediately recognize that the last five years' return falls far short of the typical end-of-cycle, "blow off" rally.
The last five years' return of 14.8% is well short of the median return of 21.4% that occurred in the five ...
US Stockowners fearful (not greedy)
?
In the year 2016, according to a poll of over 1,000 American adults, even with the Dow Jones industrial average near its record high, only slightly more than half of Americans (52%) say they currently have money in the stock market,...
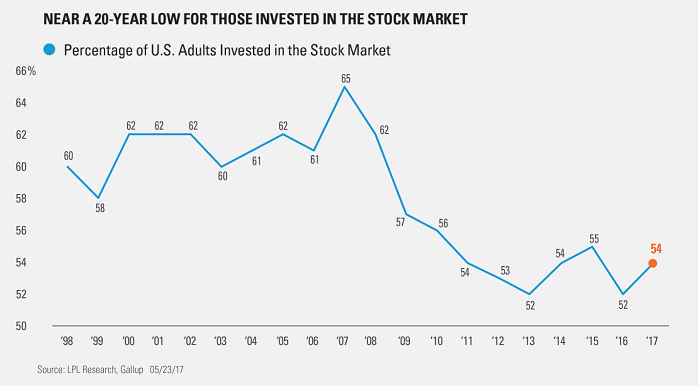
...matching the lowest ownership rate in Gallup's 19-year trend.
The current figure is down slightly from 2014 and 2015, and continues a secular decline that started in 2007. Gallup's conclusion: "Fewer Americans - particularly those in middle-income families - are benefiting from the recent gains in stock values ...
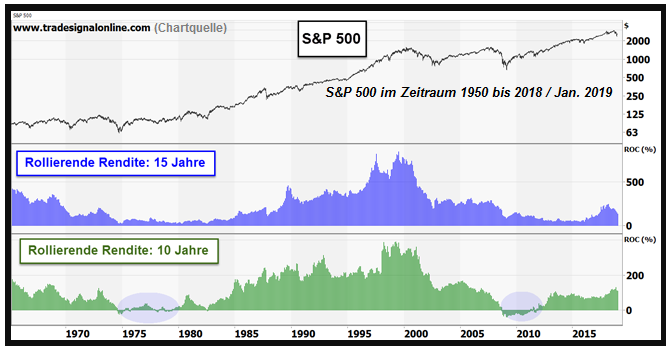
Bullenmärkte seit 1926 (inkl. "Bärenmärkte")
"kurz und schmerzvoll"
Wie lange kann ein Bullenmarkt "laufen"? Sehen wir uns eine Analyse des US-Vermögensverwalters First Trust an. Sie untersucht die Auf- und Abschwungphasen - im Börsendeutsch: Bullen- und Bärenmärkte - an der Wall Street...
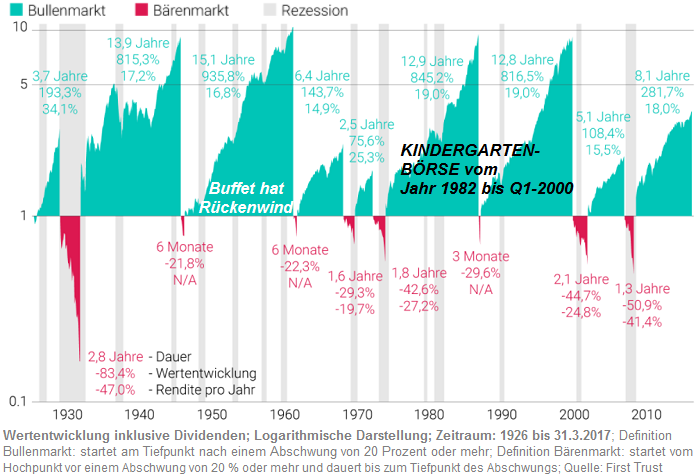
...seit 1926. Im oberen Chart ist der lange Lauf der Bullen/Wertentwicklung in allen Auf- und Abschwungphasen des US-Aktienindex S&P 500 abgebildet (indexiert auf 1 zum jeweiligen Startzeitpunkt).
Kleiner Exkurs und Einschub von einer bekannten Interenetseite (english insert):
Buffets first years ...
Economic Confidence Model
Martin A. Armstrong, a former chairman of Princeton Economics International Ltd, developed The Economic Confidence Model. He proposes that that economic waves occur every 8.6 years, or 3,141 days, which is Pi X 1,000. At the end of each cycle is a crisis...
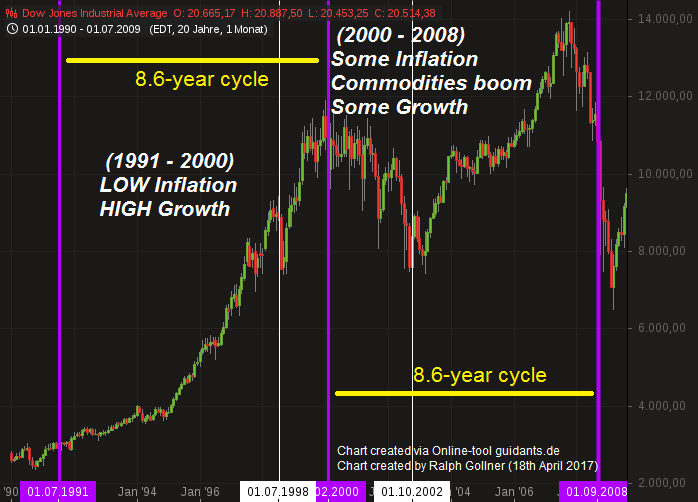
...after which the economic climate improves until the next 8.6 year crisis point.
In the language of a true academic, Michael Alexander divides equity market behavior itself into two cycles - a "monetary" one and a "real" one - that can take four basic permutations:
1) High inflation, high real earnings ...
40 Jahre sparen
(nur 50 Euro pro Monat)
Zinseszinsen sind der größte Freund eines jeden Sparers und Anlegers. Über 40 Jahre kommen dabei erquickliche Summen zu Stande - selbst wenn man nur wenig Geld zurücklegen kann. Bei den genannten Endsummen ist schon berücksichtigt, dass die...
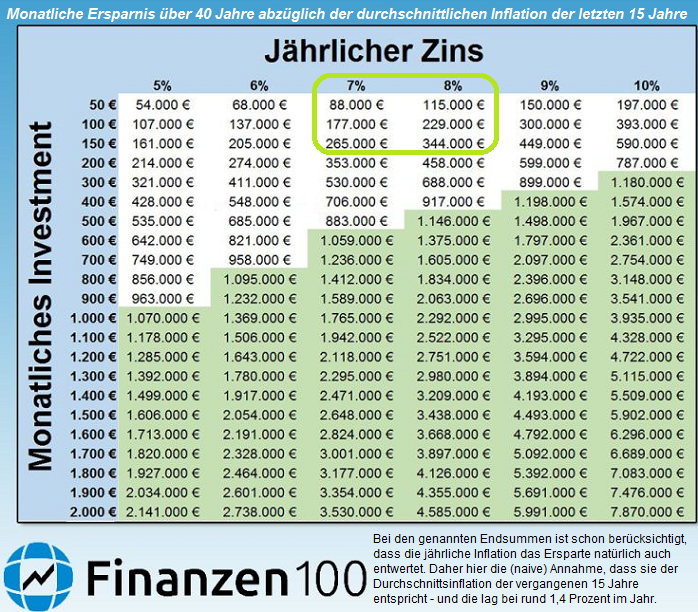
... jährliche Inflation das Ersparte natürlich auch entwertet. Allerdings wissen wir nicht, wie hoch die Inflation in den kommenden 40 Jahren sein wird. Daher hier die (naive) Annahme, dass sie der Durchschnittsinflation der vergangenen 15 Jahre entspricht - und die lag bei rund 1,4 Prozent im Jahr.
Die ...
S&P 500 Streaks without a 1%-drop
Is A Lack Of Volatility A Sign Of Complacency?
The S&P 500 Index has gone 104 days in a row without a 1% close lower! In fact, the S&P 500 hasn't moved in a daily range of more than 1% for 59 days in a row, the longest such streak going back 50 years and...
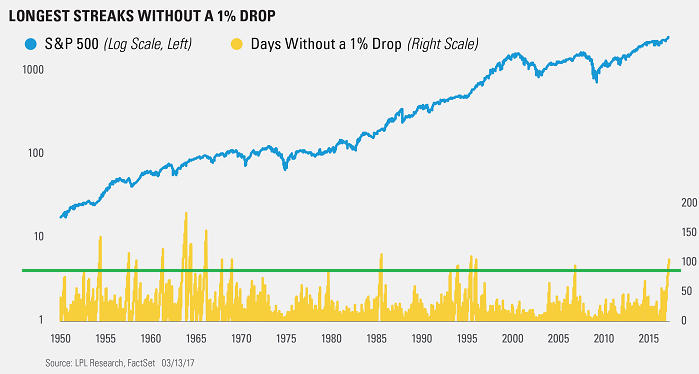
...trouncing the previous record of 34 from 1995. Of course, 1995 wasn’t the worst time to be long equities for the next several years.
Per Ryan Detrick (from LPL), "The lack of volatility is historic in its own right, but is it bearish? History would say we can expect more volatility eventually, ...
72er-Regel (Verdoppelung)
144er-Regel (Vervierfachung)
Kleines Quiz: Wie lange müssen Sie Ihr Geld in Aktien anlegen, bis es sich bei einem durchschnittlichen Zinssatz (bei einer Rendite) von sechs Prozent pro Jahr verdoppeln wird? Die richtige Antwort liegt bei 11,9 Jahren. Eine...
...hilfreiche Faustregel bringt Sie auch ohne Taschenrechner nahe an diese Lösung: Es handelt sich um die 72er Regel. Sie teilen die Zahl 72 durch den Zinssatz (ohne Prozent) und erhalten als Ergebnis die Anzahl Jahre, die es für eine Verdoppelung der Einmalanlage ungefähr braucht. In unserem Fall sind es ...
DAX-Jahresrenditen (1991 - 2012)
2013-2016 bitte selber nachschlagen ;-)
Seit 1950 hat die langfristige reale Rendite des deutschen Aktienmarktes relativ konstant zwischen 5% und 9,5% p.a. betragen. Insofern sind 6% p.a. real bzw. 8% p.a. nominal gute Erwartungswerte für eine...
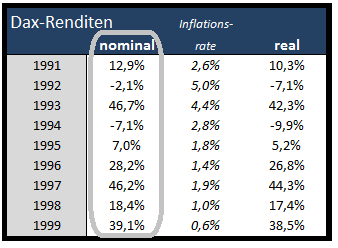
...durchschnittliche Renditeerwartung, die über einen mehrjährigen Börsenzyklus geht. Sie sind aber extrem schlechte Prognosewerte für die Renditen eines einzelnen Jahres.
Die jährlichen Anlageergebnisse sind breit gestreut. Insbesondere bei Verlustjahren lässt sich keinerlei Muster erkennen. Bei Gewinnjahren ...
DAX vs. Dow Jones Ind. Average
(Jan. 2000-Jan. 2017)
Von den 205 Monaten seit Ende 1999 wurden beim Dow Jones 122 mit Gewinn abgeschlossen. Dies entspricht einer Gewinnhäufigkeit von 59,51%. Der Dax (89 Monate im Plus) weist hingegen eine "reduzierte" Gewinnhäufigkeit von 56,6% auf.
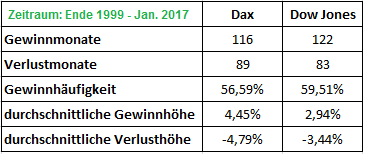
Hinzu kommt: In den Monaten mit Rücksetzern beträgt die durchschnittliche Verlusthöhe beim "deutschen" Dax (-4,8%) und beim Dow Jones (-3,4%). Könnte man nun mittels einem bewährten Risikomanagement diese Rücksetzer in "grossen Baissephasen" reduzieren (Defensiv-Stärke), wäre eine langfristige ...
DAX-MATRIX
(Geburtsjahr bis Feb. 2017)
So viel Geld hättet ihr heute, wenn Eure Eltern bei Eurer Geburt in den DAX investiert hätten. Es ist ein Brauch, zur Geburt des Kindes gleich ein Sparbuch anzulegen, das ihm mit Zinsen zum 18. Geburtstag ausgezahlt wird. Noch schlauer wären...
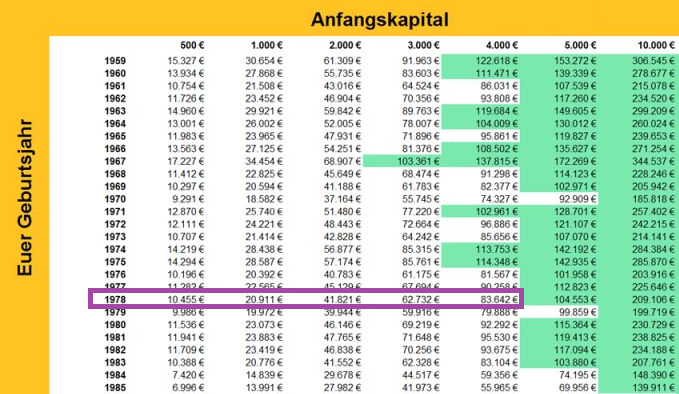
...allerdings Aktien gewesen, wie diese Grafik zeigt.
Ach, Zinseszinsen, der Freund eines jeden Sparers. Je mehr Zeit ihr zum Ansparen habt, desto mehr Geld bekommt ihr am Ende hinaus. Doch unsere Zeit ist begrenzt - evtl. investieren Eure Eltern proaktiv in Eure finanzielle Zukunft, während Ihr noch im ...
Wenn Du (als Junge/r) Zeit/GEDULD hast...
Beim Vorsorgen gilt: Besser früh und wenig als spät und viel. Wer zeitig mit dem Sparen anfängt, muss sich weniger stark einschränken als Spätberufene:
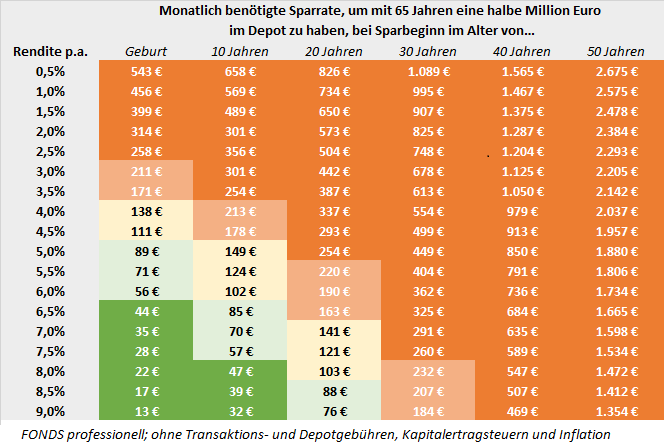
Ein plakatives Beispiel (siehe Schaubild oben):
Jemand setzt sich ein Sparziel von 500.000 Euro, über die er ab dem 65. Lebensjahr verfügen will. Dafür möchte er jeden Monat einen fixen Betrag in ein Portfolio aus Aktien und Anleihen stecken, das annahmegemäß nach Inflation, Steuern und Kosten mind. 2,5 Prozent Rendite pro Jahr bringt. Beginnt der Sparer im Alter von 25 Jahren, muss er 600 Euro ...
Remember the Big Bull Markets (50s, 90s)
I guess, the times to achieve great returns via Value-Investing are now much harder than in the last century...maybe, BUT: there always has to be an Equity Premium OVER Bond-yields! (my best guess)
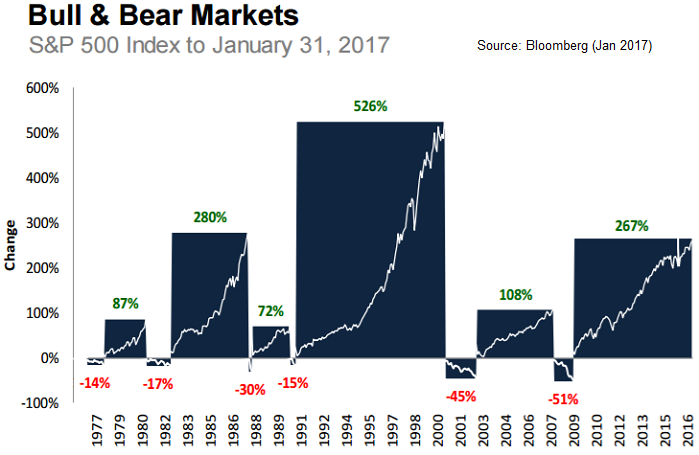
For the purposes of this illustration, a bull (bear) market is defined as a positive (negative) move greater than 15% that lasts at least 3 months in the chart above (Period: 1977 - 2016).
Statistics-source First Trust/
Max. Bull Period in the 30s and 40s: 13.9 years, +815.3%, Annualized: 17.2%
50s: 15,1 years, +935.8%, Annualized: 16.8% ("Warren ...
The Pareto Principle
...is an economic term invented by an Italian economist Vilfredo Pareto in the 20th century. It is also called the 80-20 principle, meaning that 80% of effects come from 20% of the causes. In the book "The Tao of Warren Buffet" written...
...by Mary Buffett, one can read that 90% of Warren Buffett's returns came from just 10 stocks. One may believe that in a typical investor's career, out of the 50-100 lifetime investments, probably less than 20 or so would end up accounting for most of the gains.
A few investments you make will do the heavy lifting for the whole ...
Die wertvollsten Unternehmen der Welt
Die Top-Plätze im Ranking der 100 teuersten Konzerne sind weiterhin für amerikanische Firmen reserviert. Der deutsche Spitzenreiter ist SAP auf Platz 60.
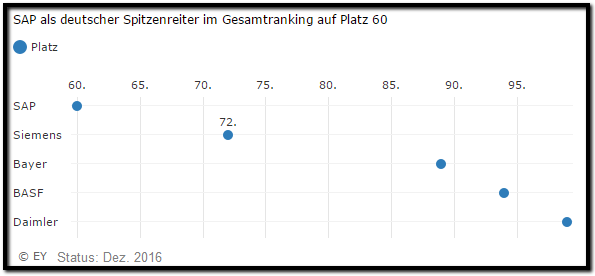
Die zehn wertvollsten Unternehmen der Welt kommen auch in diesem Jahr aus den Vereinigten Staaten. Unter den 100 größten Werten tun dies inzwischen 59 und damit mehr als die Hälfte - Tendenz steigend. Das hat die Wirtschaftsprüfungs- und Beratungsgesellschaft EY errechnet. Nur 23 der 100 größten Unternehmen der Welt haben ihren Sitz in Europa und 19 in Asien.
Mit insgesamt fünf Unternehmen unter ...
The Majority of the World’s Population Lives in This Circle
China and India, or "Chindia" - is home to about 40 percent of the world's population. Furthermore there are now at least 3.8 billion people living inside the highlighted circle (that circle holds 22 of the world's 37 megacities):
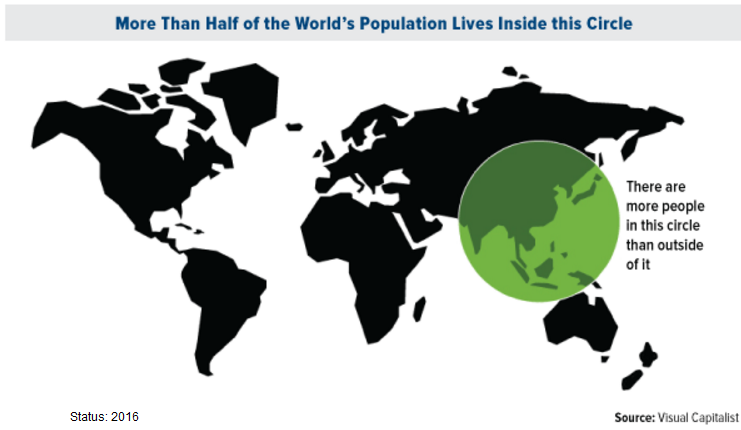
The following image then, courtesy of Visual Capitalist, shows emphatically just how enormous this region's population is. More people live inside the green circle - which covers not just India and China but also Japan and some South China Sea countries - than outside it. The two Asian countries ...
Fund Flows (Tailwind for stocks ?!)
Nov./Dec. 2016
Investors plowed money back into ETFs at a breakneck pace during the first week of December 2016. After adding USD 48 billion to U.S.-listed ETFs in November, they added USD 14.6 billion to the space in the week ending Thursday, 8th December.
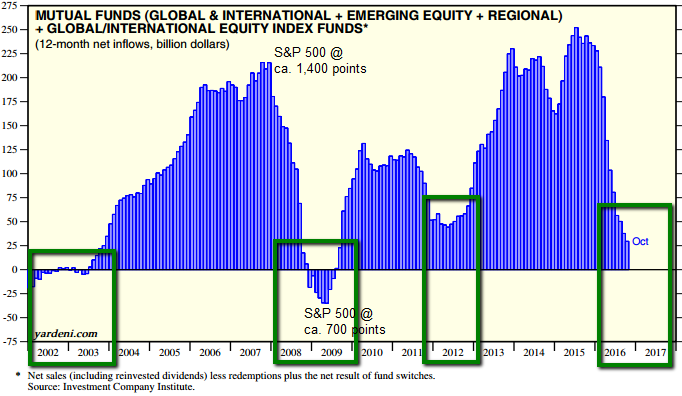
It still has to be seen what the final figures in Dec. 2016 will be and how the new Funds-Flow-mountain (see Flows above) will eventually look like!
link: www.etf.com/sections/weekly-etf-flows/weekly-etf-flows
Banking in the US / Net Interest Margin & 10YR-US-Treasuries
Net interest margin is a measure of the difference between the interest income generated by banks or other financial institutions and the amount of interest paid out to their lenders (for example, deposits), relative...
.gif)
...to the amount of their (interest-earning) assets. It is similar to the gross margin (or gross profit margin) of non-financial companies. It is usually expressed as a percentage of what the financial institution earns on loans in a time period and other assets minus the interest paid on borrowed funds ...
Betriebliche & überbetriebliche Pensionskassen Österreichs
Die Performance betrug in 2015 +2,36%. Der Fokus liegt (jedoch) auf langfristiger Veranlagung. Der durchschnittliche Veranlagungserfolg der österr. Pensionskassen liegt mit Ende des 3. Quartals 2016 bei +3,3%.
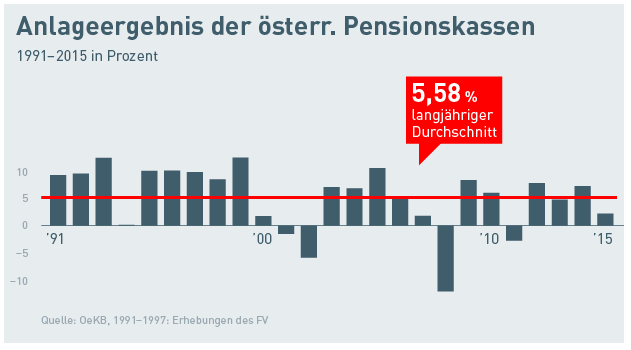
Der 1992 gegründete Fachverband der Pensionskassen ist die Vertretung aller betrieblichen und überbetrieblichen Pensionskassen Österreichs und gehört zur Bundessparte Bank und Versicherung der Wirtschaftskammer Österreich. Derzeit sind fünf überbetriebliche und sieben betriebliche Pensionskassen Mitglied ...
For the first time, America is no longer No. 1 for super-rich
The wealth of high net worth individuals (HNWI) in the Asia-Pacific grew by 10% or almost five times North America's 2% growth for "HNWI" last year, according to a Report released by Capgemini, a global consulting service.
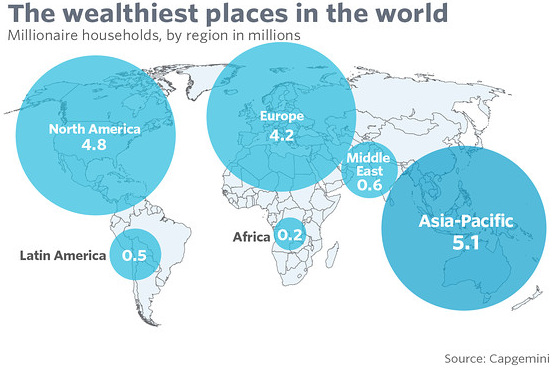
There was a big drop from North America's 9% HNWI growth rate the year before, dragged down by poor performance of U.S. and Canadian equities. The World Wealth Report covers 71 countries, accounting for more than 98% of global gross national income and 99% of world stock market capitalization.
The ...
Indien & China (Mittelschicht-Anstieg)
China: In den kommenden (vier bis) fünf Jahren steigt der Konsum im Reich der Mitte um 50 Prozent, behauptet eine Studie. Vor allem die jungen wohlhabenden Chinesen geben demnach viel mehr Geld aus als ihre Eltern.
Folgend der eingangs erwähnten Studie der Beratungsfirma Boston Consulting könnte der Konsum in der zweitgrößten Wirtschaft der Welt bis zum Jahr 2020 auf die Summe von 6,5 Billionen Dollar steigen. Träfe das zu, wäre das ein Zuwachs von der derzeitigen Summe aller konsumierten Waren (Status per Dez. 2015) von über 50 Prozent – allein ...
Rolling Returns 12 months & S&P 500
(July 2016 - 07/2017 - July 2018)
Writing about one-year-targets (implied returns), one should keep in mind, that the average ROLLING-RETURN for a 1 year period is 7.02%, the median for a 1 year-rolling-period in the Dow Jones Industrial average is 6.62%.
Keep in mind! This statistics for the rolling-period returns of one year covers a long history (including two World Wars) back to 17th February 1885, and up to March 2015. Furthermore in the 19th century, there has been no Central Bank established!
Reasoning for using the Dow Industrials for the ...
Top Brandz (2016)
The world’s 100 biggest brands still command a significant premium over others and that value increased by 3% to USD 3.4tn this year, according to the latest BrandZ rankings compiled by MillwardBrown, the research agency:
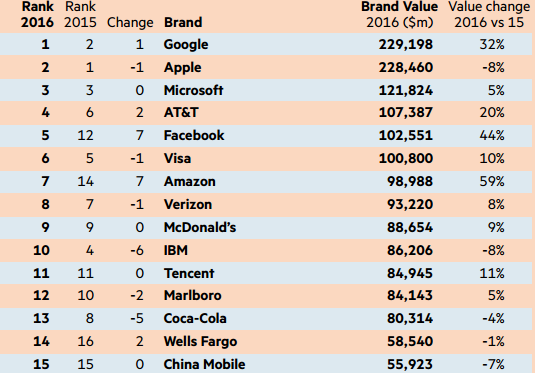 complete list/please click here: http://wppbaz.com/charting/19
Over the past 10 years, the valueof the top 100 brands has more than doubled - increasing by 133%. That value is calculated in terms of financial measures such as revenues and profitability combined with surveys of how consumers view brands.
Valuable brands deliver superior shareholder ...
Snapchat versus Facebook
(Status: HY1/2016)
Snapchat is coming up! Tumblr, Vine, Twitter, Pinterest, Instagram, Linkedin – Nearly no one can reach the time spent by US-users on its platform. Only Facebook-users spend more time per month on its platform: ca. 1,000 minutes.

Photo-Sharing is being dominated by WhatsAPP (owner: Facebook) and Snapchat ("still" a private company). When talking about Video-Views per day Snapchat is playing in the same league like facebook:
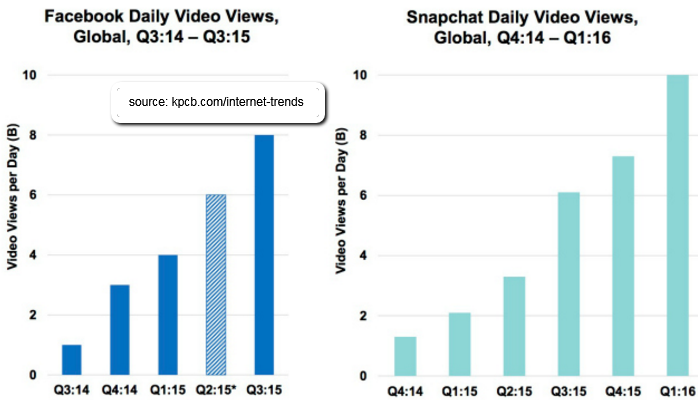 source/Internet-study: http://www.kpcb.com/internet-trends
Nobody has found the 'secret recipe' for successful video ...
Aktien versus DE-Umlaufrendite
Die Niedrigzinspolitik der EZB zeigt immer fatalere Auswirkungen: Die Umlaufrendite ist im April erstmals auf 0 Prozent gesunken. Das heißt: Wer dem deutschen Staat Geld leiht, bekommt im Schnitt keine Zinsen mehr. Ein Novum!
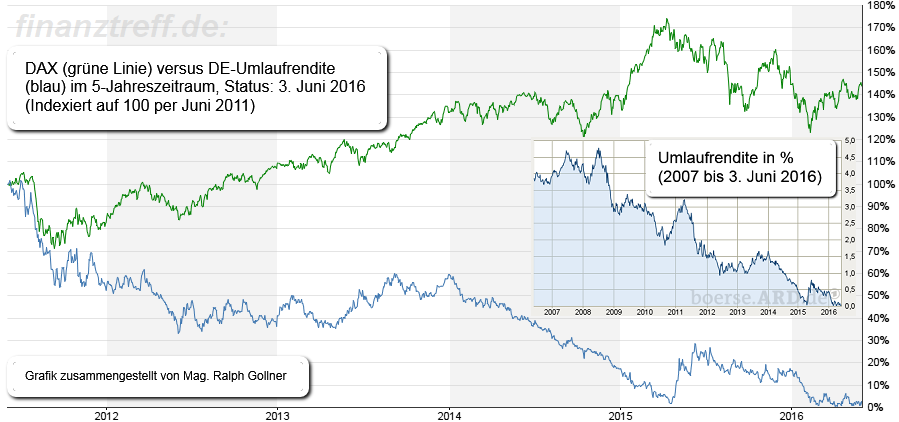
Was den deutschen Bundesfinanzminister freuen dürfte, ist für die deutschen Sparer ein weiterer Tiefschlag: Erstmals in der Geschichte der Bundesrepublik gibt's für ihre Anleihen im Schnitt keine Zinsen mehr. Das signalisiert die Umlaufrendite, die mit 0,0 Prozent zu Wochenbeginn auf ein Rekordtief stürzte.
In die Umlaufrendite ...
US-New Home Sales
New Home Sales in the United States averaged 652.45 Thousand from 1963 until 2016, reaching an all time high of 1,389 Thousand in July of 2005 and a record low of 270 Thousand in February of 2011.
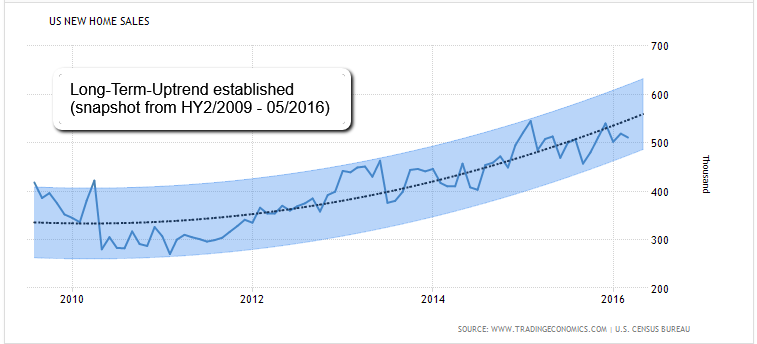
Definition: A sale of the new house occurs with the signing of a sales contract or the acceptance of a deposit. The house can be in any stage of construction: not yet started, under construction, or already completed. This page provides the latest reported value for - United States New Home Sales - plus previous releases, historical high and low, short-term forecast and ...
US-population 1950-2016
The US-population is growing ever since. GDP-Growth is achieved via productivity growth, but also due to more people producing a higher output (GDP). In the U.S.A. the population more than doubled from the year 1950 until now.
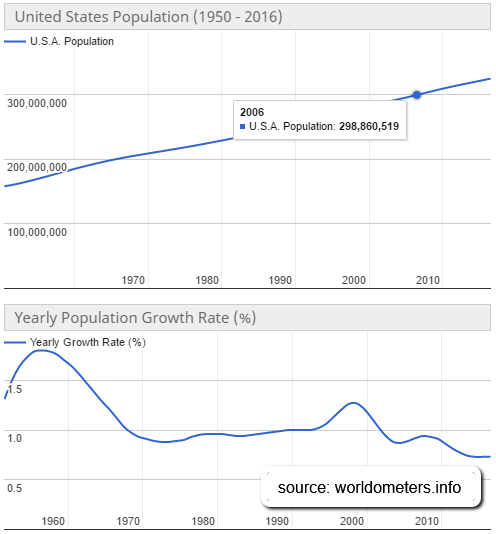 current US-population figures: http://www.worldometers.info
In following chart one can see the comparison year-over-year between GDP-growth and population-growth in the US:
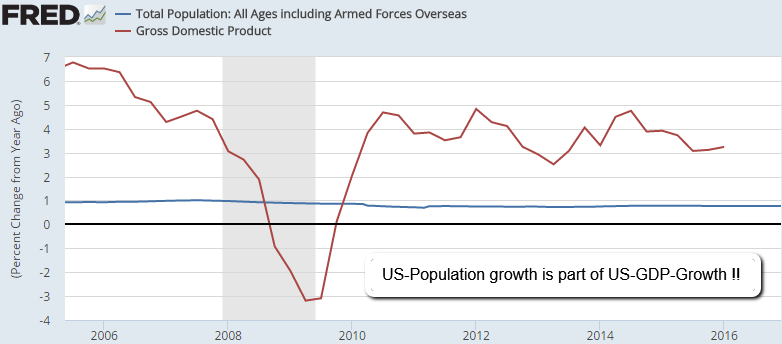
If you prefer numbers more to graphs and curves, have a look at following table from the year 1990 up to 2016. The U.S. population is growing by over 2 mio. people ...
Carl C. Icahn (Investor)
C. Icahn has, unequivocally, shown superior skill as an investor. Consider this: Icahn has returned 31% annualized between 1968 and 06/2015. BUT since 2014 everything got a little bit more difficult...
Still: Based on the weighted portfolio performance he achieved an annual return +12.36% in the last 3 years until 18th May 2016 (based on a total of 27 stocks/source: tipranks.com; data made available by the SEC.)
Recap/To put the 31% annual return since the year 1968 into persepective, look at this graph I made: That would turn every USD 1,000 invested with ...
Die fünf Vorsorgetypen in Österreich
Wie die ÖsterreicherInnen mit dem Thema „Private Pensionsvorsorge“ umgehen, wie sie sich entscheiden oder auch nicht, zeigt eine Studie der BAWAG P.S.K. (Nov. 2014).
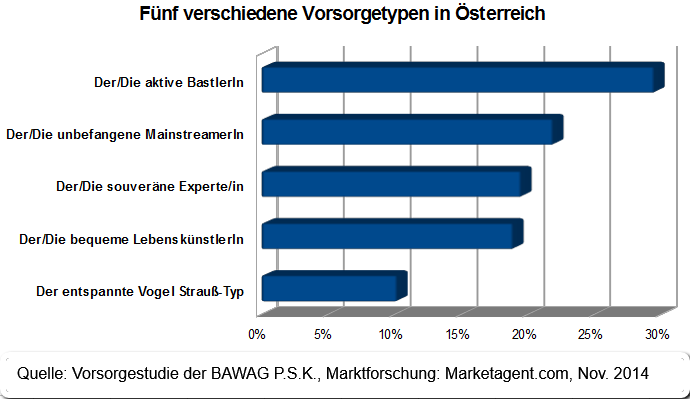
Die Befragten sind sich darüber im Klaren, dass das Thema „Private Pensionsvorsorge“ wichtig ist (91,8 Prozent). Laut Studie sind sich 43,1 Prozent sicher, dass die staatliche Pension alleine zu wenig ist, um „gut leben zu können“.
Gemeinsam mit dem Marktforschungsinstitut Marketagent.com* identifizierte die BAWAG P.S.K. auf Basis dieser Studie in der heimischen Bevölkerung fünf ...
S&P 500 "Forecast" 2016 - 2022
Do Past 10-Year Returns Forecast Future 10-Year Returns? Vanguard expands its previous research in using U.S. stock returns since 1926 to assess the predictive power of more than a dozen metrics that investors know ahead of time:
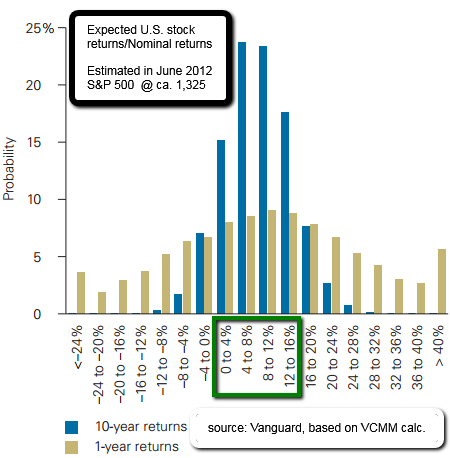
Projections are based on simulations by the Vanguard Capital Markets Model.
See the Appendix for a description of the model’s methodology and the benchmarks used under following link(.pdf):
https://personal.vanguard.com/pdf/s338.pdf
The figure above shows the probability distribution of expected U.S. stock returns based on ...
Mittelschicht-anstieg 2016 bis 2030!
Zwischen 1990 und 2010 hat sich der weltweite Anteil der Menschen, die unterhalb der absoluten Armutsgrenze von 1,25 US-Dollar leben müssen, mehr als halbiert, von 47 auf 22 Prozent. Das entspricht einer Verminderung um 700 Millionen Menschen.
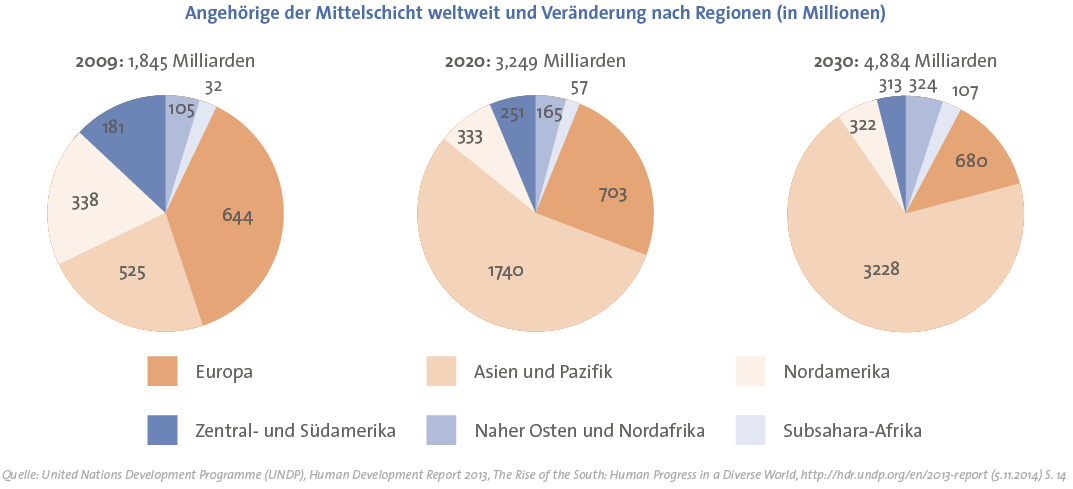
Die Allianz-Versicherung ermittelte, dass im Jahr 2015 mehr als eine Milliarde Menschen über ein Netto-Pro-Kopf-Vermögen zwischen 6.100 und 36.700 Euro verfügten, dem globalen Durchschnittsvermögen. Seit dem Jahr 2000 sind demnach knapp 600 Millionen Menschen in diese Vermögensmittelklasse aufgestiegen. Zwei ...
Selected Hedge-Fund performance (year 2015)
In the following overview you can find last years' performance of selected Hedge-Fund Managers, ATTENTION: Last years' return-calculation is based on the weighted portfolio performance:
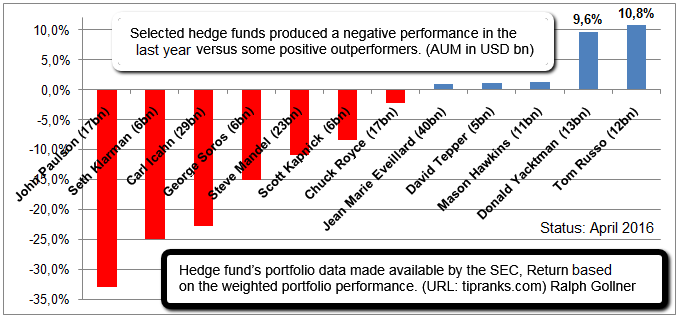
The more than a dozen (pretty well known) mentioned Hedge-fund Managers were overseeing Total-Assets of > USD 185 billion as per Q1/2016. Unfortunately some of the famous names also produced big losses in the year 2015 ranging from minus 2% up to a loss of even minus 33% in one year (Paulson & Co).
| Asset company | Asset Manager | Last year as per ... |
Dividend-ETF (vs. S&P 500), period: 2006 - 2015
The average investor may be searching for "low-expense-fee"-ETFs in order to build his Long-Term-Portfolio. Following ETF achieved an annual performance of 13.46% in the last 5 years (10-year perf. yoy: 8.63%):
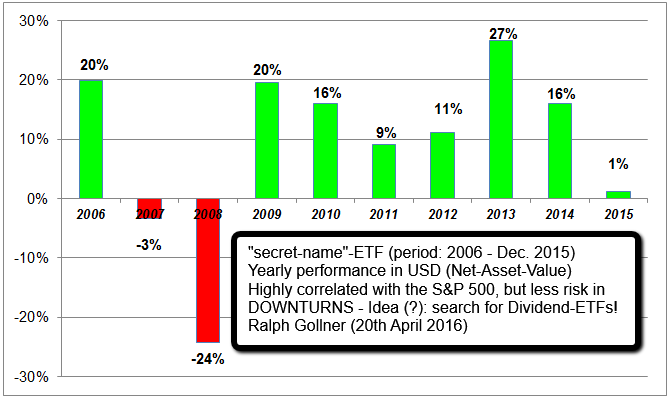
In an ETF the stock selection method (presumably) does not change. In this way, you can determine what style of dividend ETF has historically outperformed - and what style has the highest likelihood of continuing to do so.
Still: Past performance is no guarantee of future success, but it sure doesn’t hurt. I’d much rather have my ...
Absolute Return vs. Warren Buffet, Ray Dalio
(Q4/2013 - Dez. 2015)
Es gibt zum abgelaufenen Jahr 2015 und dem Finanzmarkt mehrere Meinungen. Einige meinen sogar, für kleine Aktienwerte, Nebenwerte und Mid-Caps war 2015 garnicht so anstrend und schwierig, wie die Mehrheit meint.
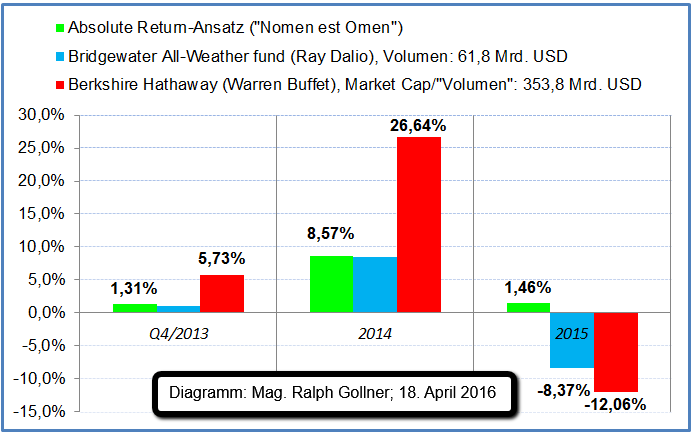 Performance "optimiert" jeweils in lokaler Währung (Abs. Return: EUR, Bridgewater: USD, Berkshire: USD)
Man muss jedoch zweifelsfrei sagen, dass es für bestimmte Sektoren schwierig war, im Jahr 2015 eine gesunde Performance darzustellen. Um das Thema objektiv beleuchten zu können, sollte man objektive Benchmarks ...
Baltic Dry Index (All-Time-Low Feb. 2016)
Der Baltic Dry ist im Feb. 2016 so tief gesunken wie noch nie zuvor (per April jedoch wieder kräftigst erholt!). Der Index bildet die Frachtkosten wichtiger Rohstoffe wie Eisenerz, Kohle und Kupfer ab.
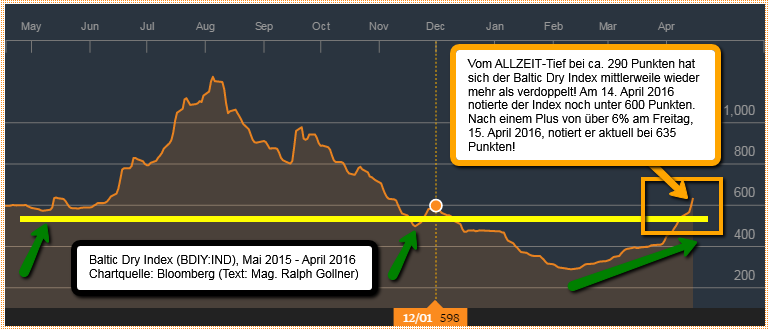
In der Regel ist die Container-Schifffahrt einer der wichtigsten Frühindikatoren für die Weltwirtschaft.
Nie zuvor war der Index, welcher die Frachtkosten für wichtige Rohstoffe abbildet, so tief gesunken. Das bislang gültige Allzeittief des Index liegt lange zurück und wurde im Jahr 1986 mit 556 Punkten markiert. Der höchste Stand wurde im ...
Momentum (last 3 months)
Momentum picking up! Check out each sector-development in the big stocks-universe (> 4,900 stocks). All sectors (!!) in the green over the given period (status: 16th April 2016):
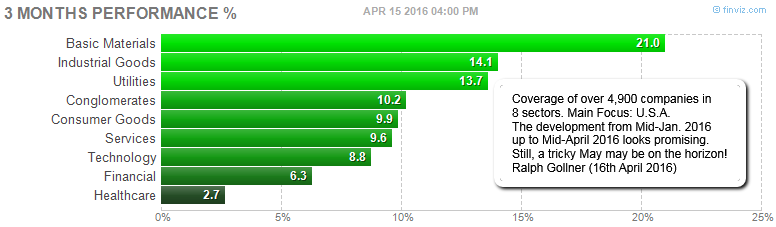
The wide US-Stock Market (S&P 500/SPX) is also gaining momentum (again), as can be seen via the quarterly candlestick-development over the last two years (8 quarters). Still, one has to be alarmed, IF May 2016 is starting to turn out being a tipping point (possible Backdrop - Before a summer-rally may start?). Development has to be followed up/following chart will be updated ...
Umlaufrendite/Staatslanleihen (Historie)
1993 - 04/2016
Die Umlaufrendite deutscher Bundesanleihen ist am Montag (11. April 2016) erstmals auf 0 % gefallen. Damit erhalten Anleger, die in deutsche Anleihen investieren, im Schnitt erstmals keine Zinsen mehr. Vorab die deutsche Bundesanleihe:
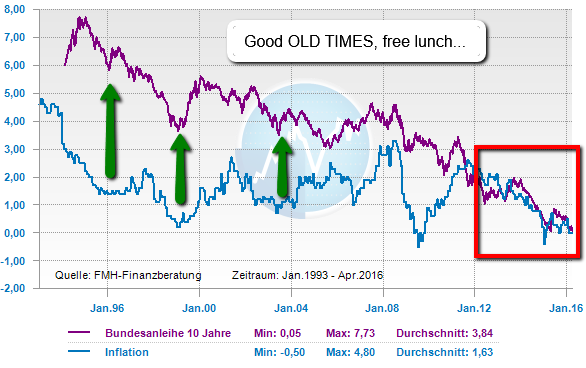
Die Umlaufrendite sank von 0,01 Prozent am Freitag auf 0,00 Prozent am Montag (11. Apr. 2016), wie die Bundesbank in Frankfurt mitteilte. Auf das bisherige Rekordtief von 0,01 Prozent war die Durchschnittsrendite erstmals am Dienstag der vorherigen Woche gefallen.
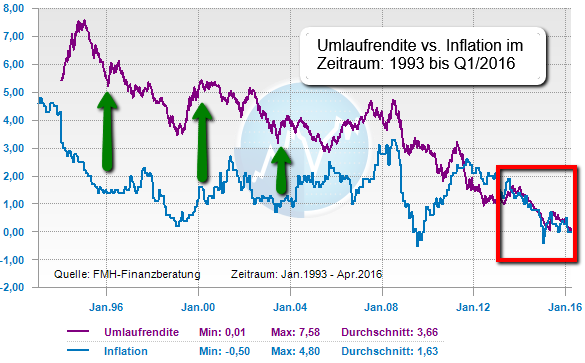
In die sogenannte Umlaufrendite ...
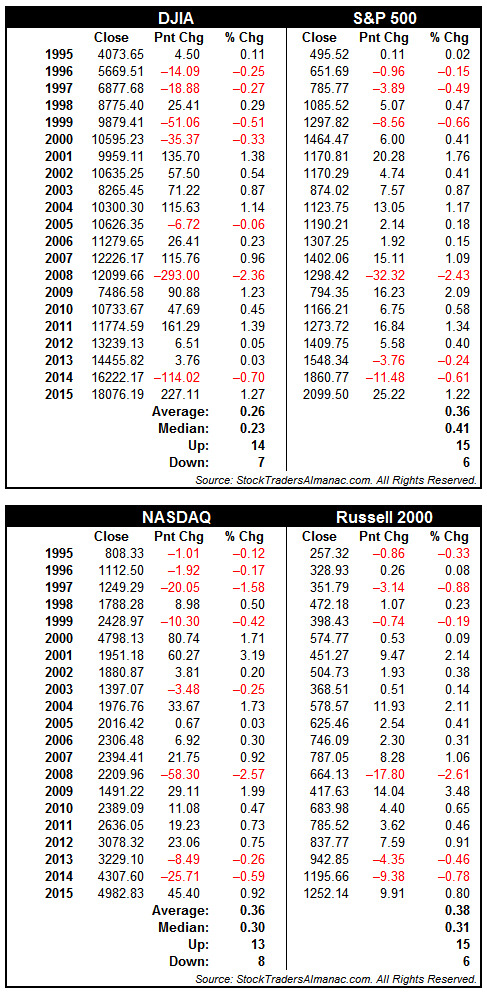
St. Patrick's Day (17th March 2016)
St. Patrick’s Day has a bullish history itself. DJIA, NASDAQ and Russell 2000 also exhibit solid track records of gains over the past 21 years on the thirteenth trading day of March (see StockTradersAlmanac.com).

Average gains range from 0.26% for DJIA and 0.38% for Russell 2000 on the day, as can be seen below/recent track record of March’s thirteenth trading day:
China Exports (New Year-effect, Feb. 2016)
The export crash is misleading in this case because the Jan. & Feb.-months host China’s biggest holiday, the Chinese New Year, when factories rush to meet orders before business shuts down (see yellow boxes in the last years):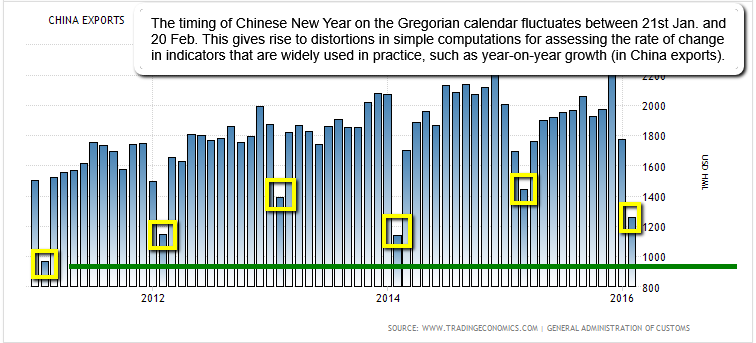
Disclaimer "upfront": China’s growing importance in the global economy and significance as a source of demand for commodities produced by many countries, has focused increasing attention on high-frequency Chinese macroeconomic data. Yet the signal from these data is often distorted by traditional holidays whose timing ...
History recap of the 1st trading-week of the year 2016
For the 1st week in 2016, the S&P 500 fell 6 %, the Dow Jones Industrial Average shed 6.2 % and the Nasdaq Composite tumbled even 7.3 % (in only 5 days).

It was the worst start to a year for the S&P 500 on record. S&P 500 components, a wide-ranging group of large US companies, shed more than USD 1 trillion on market value this week, according to data from Bloomberg.
The FTSE All-World index has lost a total of 6.1 % the same week, making it the worst five-day start to a new year since at least 1994, when the index was ...

S&P 500 yearly returns 1980 - 2014
US-Stock-Market-Returns (S&P 500) were positive in 27 out of the last 35 years (timespan: 1980 - 2014)! Out of these 27 years a positive return of at least 20% has been achieved in 12 years. Status of annual return overview: 25th Aug. 2015.
please check out the UPDATED! whole presentation (as per Nov. 2015) here: https://www.jpmorganfunds.com
Gesundheitsausgaben (in % vom BIP), Langzeithistorie

Den mit Abstand höchsten Anteil der Gesundheitsausgaben am BIP verzeichneten die USA (16,9 Prozent), gefolgt von den Niederlanden (11,8), Frankreich (11,6) und der Schweiz (11,4 Prozent). Österreich liegt mit 11,1 Prozent knapp zwei Prozentpunkte über dem OECD-Schnitt von 9,3 Prozent. Der öffentliche Sektor finanziert in den meisten OECD-Staaten den Großteil der Gesundheitsausgaben. Dies trifft auch auf Österreich zu, wo der Anteil der öffentlichen Hand mit 76 Prozent leicht über dem OECD-Durchschnitt von 72 Prozent liegt. Wie in ...
MSCI Indizes (Aktien p.a. 1989 bis 2014)
Die USA und Europa haben das weltweite Börsengeschehen in den vergangenen Jahrzehnten geprägt. Die Serie "Bewährte Märkte" von Fidelity International beleuchtet die Fakten dieser Märkte im Detail (Kommentare von mir leicht geändert):

Die USA und Europa – und nicht die Schwellenländer – waren in den vergangenen 25 Jahren die wahren Renditebringer an der Börse.
Börsen in den USA und Europa mit jeweils 18 Gewinnjahren seit 1989
US-Aktien im weltweiten Vergleich mit stabilster Wertentwicklung aller Regionen
Anleger, die ihr Geld in den vergangenen ...
Anlagezeitraum für Aktien (10 Jahre sollte die Meisten belohnen (?)
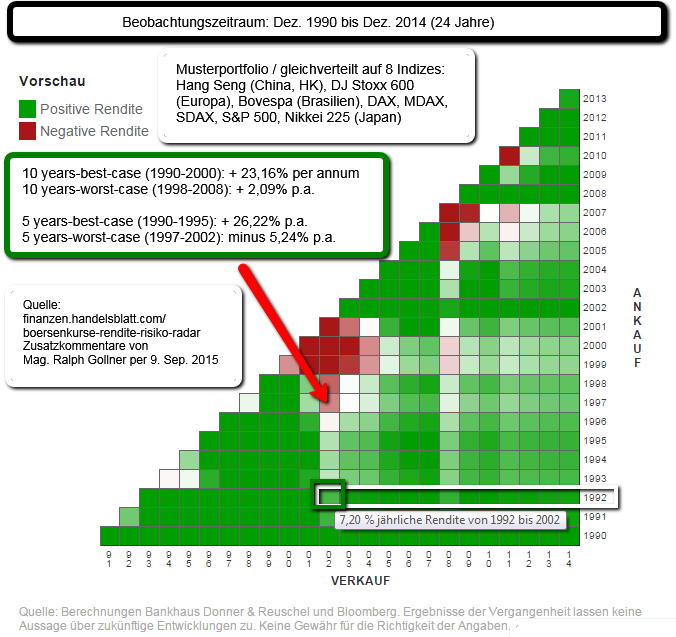
link zum Selber-nachrechnen: http://finanzen.handelsblatt.com
Long-Term-Investing
Time horizons: The longer, the better
Based on several well-known studies, the length of time that individual investors hold stocks, mutual funds and exchange-traded funds (ETFs) has shrunk precipitously over the past 50 years. Back then it was common for investors to have five-to-10-year time horizons, but today they are typically well less than a year, exacerbated by the proliferation of high-frequency/algorithmic trading firms. These firms are considered price-insensitive buyers and sellers—typically trading based on momentum and purely technical factors, with time ...
Please check out Scrapbook of Reviews on Benoit Mandelbrot
http://users.math.yale.edu/mandelbrot/
[...]
"Nach dem konventionellen mathematischen Modell dürfte es zwischen 1916 und 2003 nur 58-mal passiert sein, dass der Dow-Jones-Index an einem Tag mehr als 3,4 % steigt oder fällt. In Wahrheit geschah dies an 1001 Tagen", sagt er [Benoit Mandelbrot] und legt nach: "In der Theorie sollte eine Sieben-Prozent-Schwankung des Dow nur alle 300 000 Jahre vorkommen – tatsächlich ist es 48-mal geschehen."
Die Theorie der Normalverteilung ist attraktiv, weil sie Sicherheit gibt: Schlechte Dinge ...
Worldwide Rig Count 2010- 5/2015 (OIL / business barometer)
Baker Hughes has issued the rotary rig counts as a service to the petroleum industry since 1944, when Hughes Tool Company began weekly counts of U.S. and Canadian drilling activity. Hughes initiated the monthly international rig count in 1975. The North American rig count is released weekly at noon central time on the last day of the work week. The international rig count is released on the fifth working day of each month.
The Baker Hughes Rig Counts are an important business barometer for the drilling industry and its ...
Related Articles
Realzins Definiton: Der wirkliche Zinsertrag nach Inflation
5 % Zinsen - über einen solchen Zinssatz würden sich normalerweise die meisten Anleger freuen. Allerdings sieht dies nicht mehr so rosig bei 5 % Inflation aus. Hier würde die Kaufkraft merklich sinken und die...
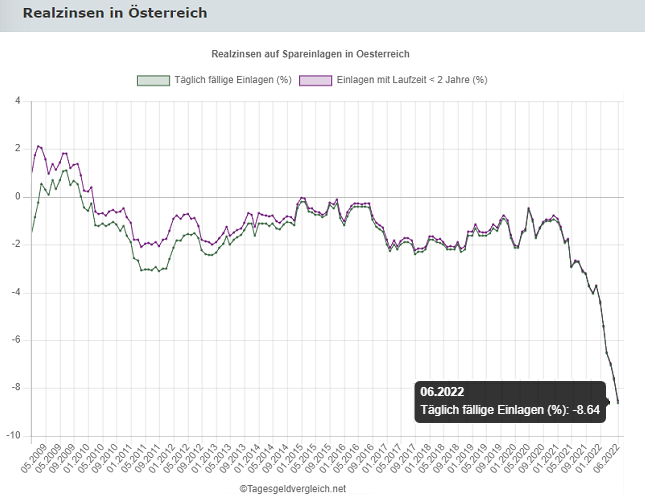
...Verzinsung ...
S&P 500 Fair Value in the year 2022 and 2023
The foundational paper on valuation that professors Merton Miller and Franco Modigliani (M&M) wrote in 1961. In it, they addressed a fundamental question: "What does the market ‘really’ capitalize?" They did not crown a winner...
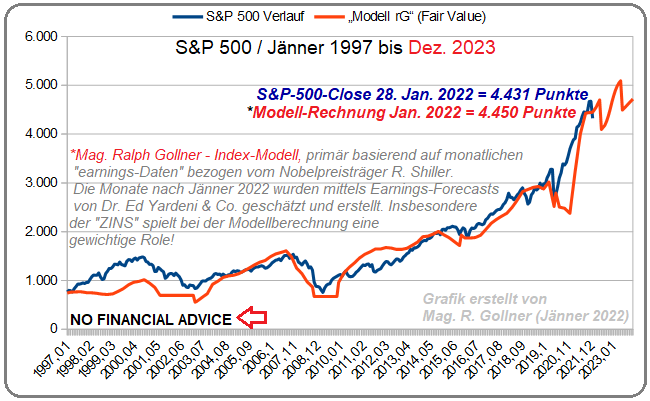
...among ...
DAX-Potenzial im Jahr 2022
(Status: 28. Dez. 2021)
Der DAX könnte seinen Aufwärtstrend 2022 fortsetzen und auf > 17.200 Indexpunkte steigen, SOFERN die DAX-Gewinnerwartungen von ca. 1.200 auch erreicht werden...
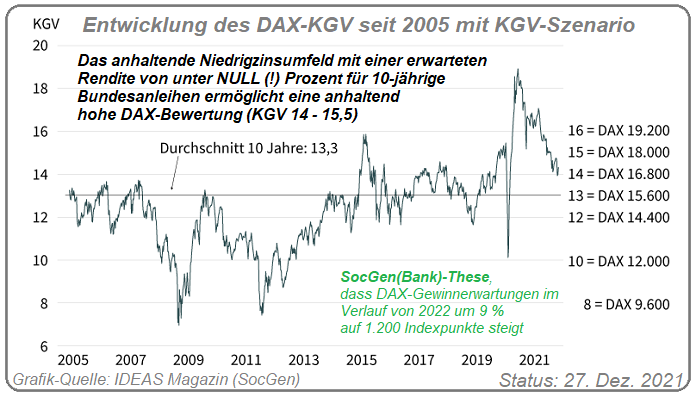
Die Prognose der Societe Generale-Bank, dass der Trend der DAX-Gewinnerwartungen ...
Binance coin (BNB) > 350 BUSD (US-Dollar ;-)
I am a Binance-token (BNB) buyer since many quarters and I am holding BNBs for some years already ( = Disclosure). I want to give you a brief snapshot on the Status-Quo review of the current Chart-Situation:
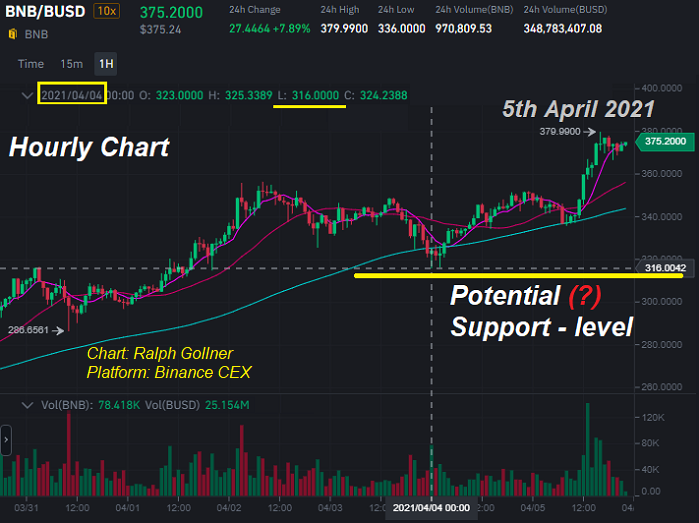
In these two charts the status of the ...
US-Stock-Markets are not that expensive
...correct?
Nobel laureate Robert Shiller, who created the CAPE ratio, co-authored a Barclays report with Laurence Black of The Index Standard and Farouk Jivraj of Barclays. They cited low interest rates as pushing up valuations. They further...
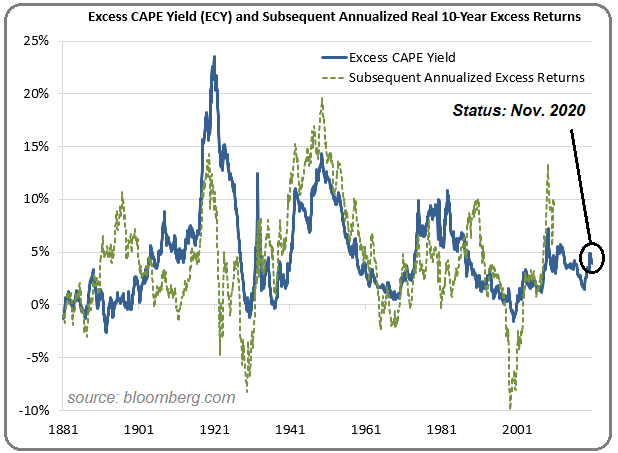
...
SMALL CAPS on the run :-)
Die bekannteste Faktorprämie bei Aktien ist die "Small-Size-Prämie", oft auch nur "Size-Prämie" oder "Small-Cap-Prämie" genannt. Sie besagt, dass kleine börsennotierte Unternehmen (gemessen an ihrer Marktkapitalisierung) im Durchschnitt höhere Aktienrenditen...
...
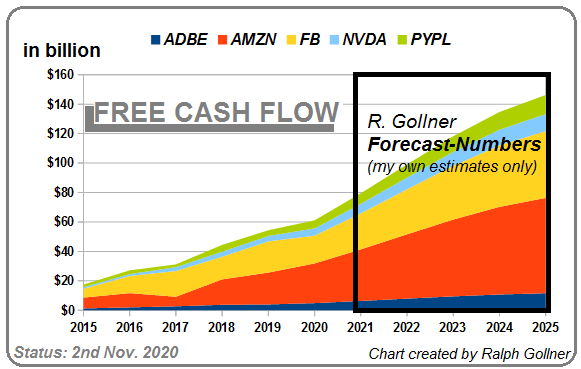
FREE CASH FLOW
(years 2015 bis 2025e)
A long-standing question about valuation-metrics...
Which is better: earnings or free cash flow?
Well, why not track both numbers to make the smartest moves? Earnings information provides a nice summary of a company's day-to-day operations and...
...
Einige (verkürzte Auszüge) aus einem Interview mit Hrn. Flossbach, (Juli 2020);
Link am Ende des postings!
Frage: Was sagen Sie zum aktuellen Schuldenberg?
Vermögensverwalter Bert Flossbach: Bei der Frage verhält es sich wie mit einem akut Verletzten, den Sie sterben lassen oder ihm...
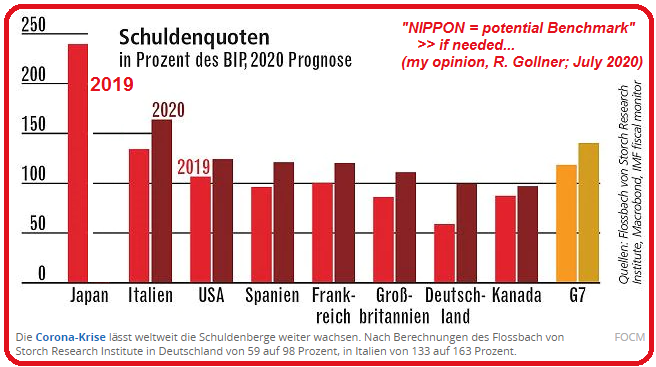
...ein ...
MMT
Modern Monetary Theory
(Please listen to this 7 Minute-Audio)
Stephanie Kelton is almost universally acknowledged as the person to talk to about MMT. She's a former economic adviser to Democrats on the Senate Budget Committee and the Bernie Sanders 2016 presidential campaign.
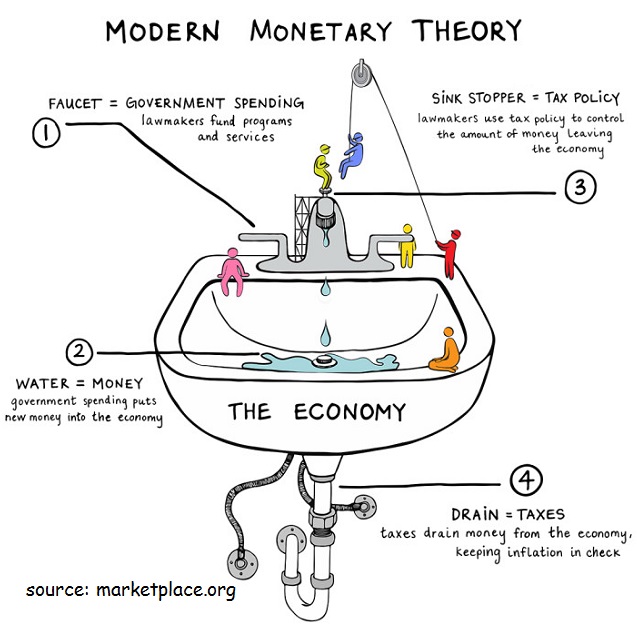
"the ...
Fed Balance sheet potentially propping up the US-Stock Market (?)
IF and only if the Federal Reserve will pull up its Balance sheet up to over 10 billion USD, my guess is that this could also have "some" material impact on the US-Stock Market (S&P 500-Index). The "FED" may hold interest...
![]()
...
Valuation US-Stock-Market
March2020
During much of the late 1950s and throughout the 1960s, the S&P 500 was highly priced relative to book value. The U.S. stock market achieved healthy rates of return as (relatively) low interest rates made equities relatively more...
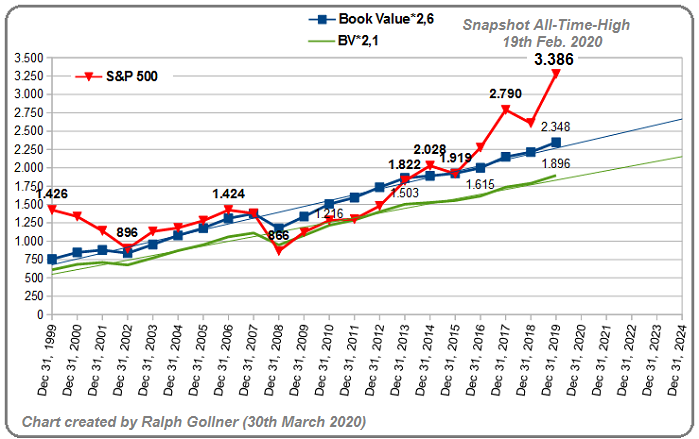
...attractive. ...
DAX-Stand von unter 10.000 (13. März 2020)
In den letzten 140 Jahren folgten auf CAPE- und KBV-Bewertungen, wie wir sie heute im DAX sehen, sehr ansehenliche Renditen. Allgemein wurden in der Mehrzahl der historischen Beobachtungsperioden reale Wertzuwächse von 4-9% erzielt.
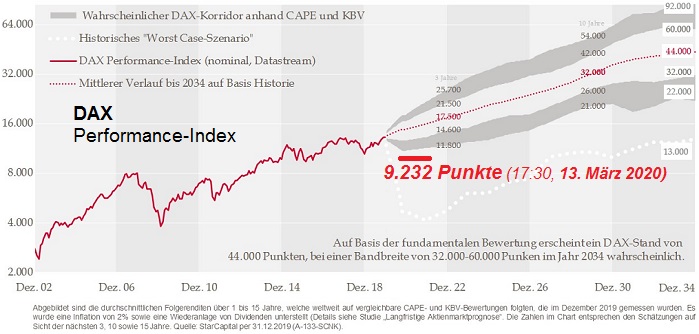
Berücksichtigt ...
Dividend Discount Model S&P 500
(potential fair valuation / UPDATE)
In Oct. and November 2018 the U.S. 10Year-Treasuries reached a yield of ca. 3.25%. Reminder: Around Christmas Eve in 2018 the S&P 500 reached then its intermediary LOW at around a level of ca. 2,336 points...(I did not...
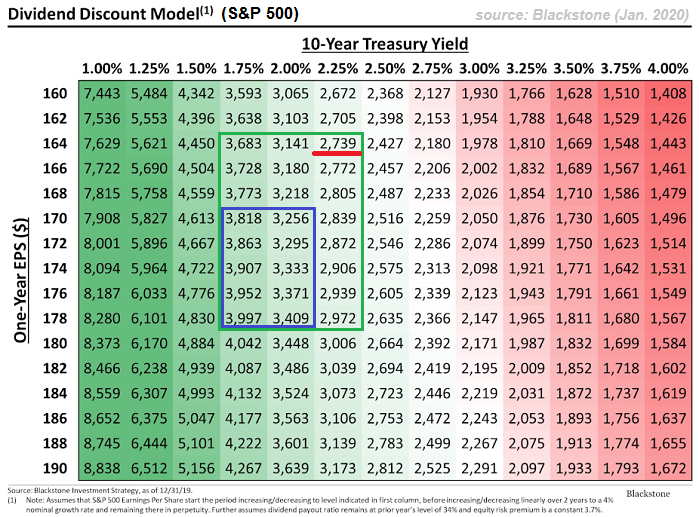
...
years 1954, -58, -85, -89 (S&P 500 in 2020?)
US-Stock Market History
With an open mind and the current FED-Policy one even has to think about the "unthinkable". Let's take a look at similar historical "Advance/Decline Breadth"-Trends on a monthly basis and the year after - the...
year 1989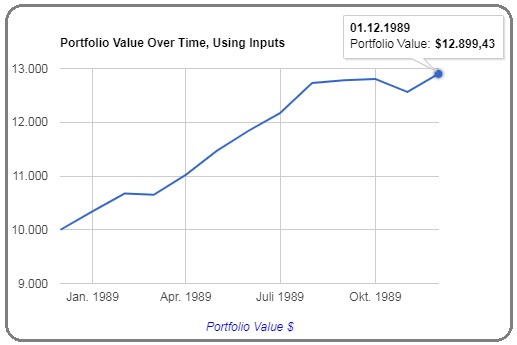
In ...
Profitabilitäts-Kennzahlen (USA vs. Rest)
Aus dem aktuellen "JP Morgan-2020 Bericht" lassen sich interessante Einsichten gewinnen. Hier eine starke Aussage, unterlegt mit Zahlen. USA-Unternehmen sind einfach extrem profitabel, versus Europa beispielsweise.
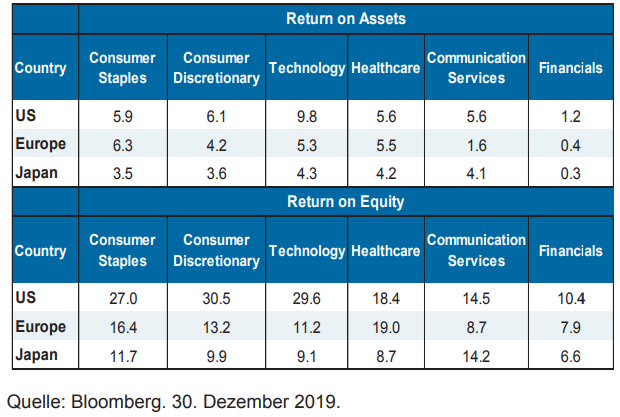
Es wird spannend werden, ob der ...
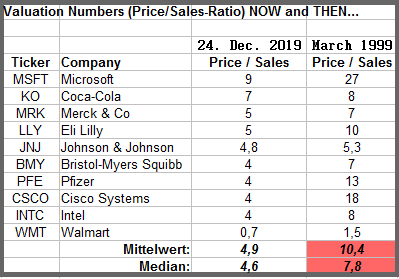
Valuation matters
Price/Sales Ratios year 2019 versus 1999
Here below some selected stocks
(check this out ;-)
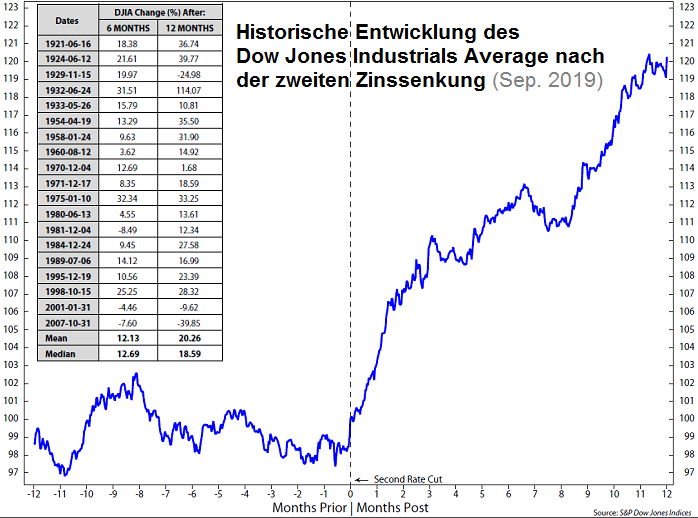
Zweite (Fed-Leit)Zinssenkung am 18. Sep. 2019 (?)
Implikationen für den US-Aktienmarkt
Aktuelle Meinung vom US-Finanzdienstleister Ned Davis Research, auf Basis ihrer ermittelten Daten: Laut dem dortigen US-Strategen Ed Clissold wäre es jedenfalls aus Bullensicht eine gute Sache, wenn...
...
21st August 2019:
The bond market signaled a recession - again(!).
For the second time in a week, the closely watched 2-year Treasury note rate rose above its longer-term counterpart in the 10-year Treasury note, representing an inversion of the...
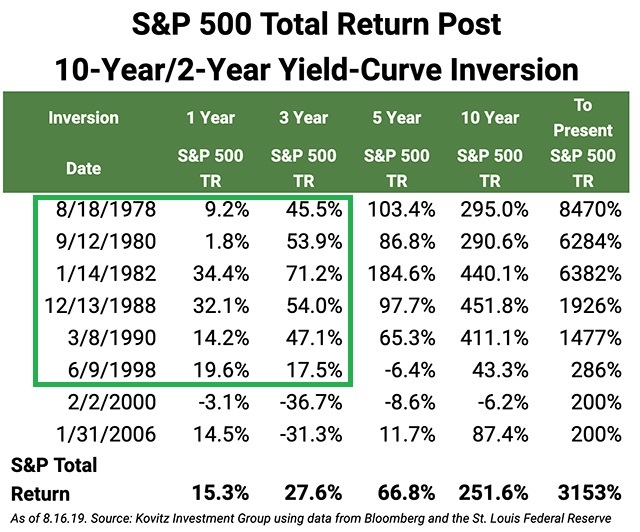
...bond-market yield curve. Yields inverted ...
Sentiment (ZEW-Indicator)
The ZEW Indicator of Economic Sentiment for Germany once again decreased sharply in August 2019. Expectations are now at minus 44.1 points. This corresponds to a drop of 19.6 points compared to the previous month. The indicator's...
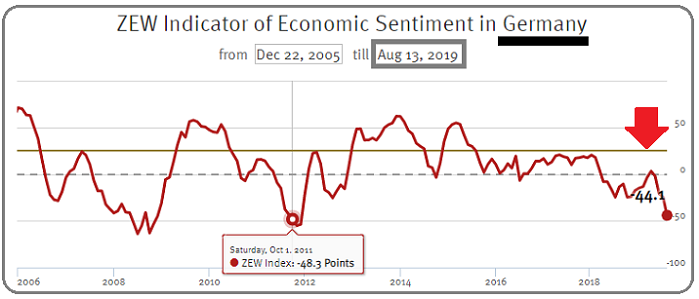
...long-term average is 21.6 ...
Wirtschaftswachstum & KGV im S&P 500
Der Anfang des Wirtschaftswachstums als Dauerzustand moderner Wirtschaften steht in engem Zusammenhang mit dem Beginn der industriellen Revolution anfangs des 19. Jahrhunderts. Zuvor lebten die Menschen hauptsächlich...
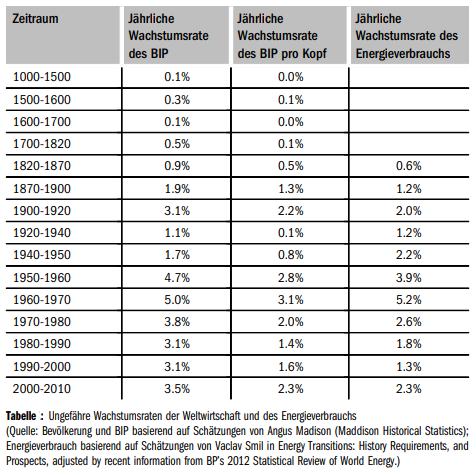
...in Agrarwirtschaften, in denen ...
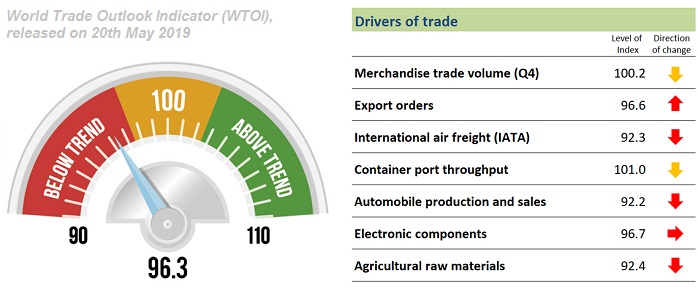
Trade weakness to extend into second quarter, WTO indicator suggests
World trade growth is likely to remain weak into the second quarter of 2019 according to the WTO's latest World Trade Outlook Indicator (WTOI), released on 20th May 2019. The new WTOI reading is 96.3, exactly as it was...
...
Dividend Discount Model S&P 500
(potential fair valuation)
update to the posting #1239
In Oct. and November 2018 the U.S. 10Year-Treasuries reached a yield of ca. 3.25%. Around Christmas Eve the S&P 500 reached its intermediary LOW at around a level of ca. 2,336 points...
...(but I did not ...
Dividend Discount Model S&P 500
(potential fair valuation)
In Oct. and November 2018 the U.S. 10Year-Treasuries reached a yield of ca. 3.25%. Around Christmas Eve the S&P 500 reached then its intermediary LOW at around a level of ca. 2,336 points...(I did not look up the exact level).
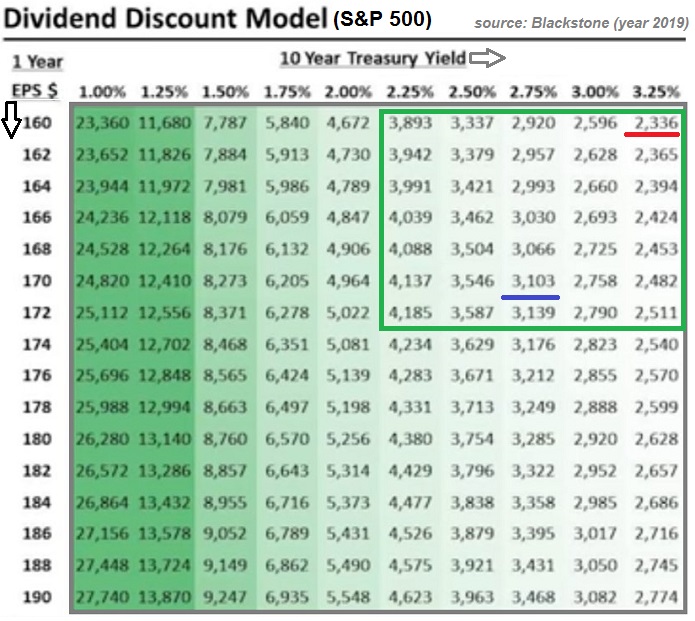
Just ...
Indicator signals further loss of momentum
The World Trade Outlook Indicator (WTOI) is designed to provide "real time" information on the trajectory of world trade relative to recent trends. The latest...
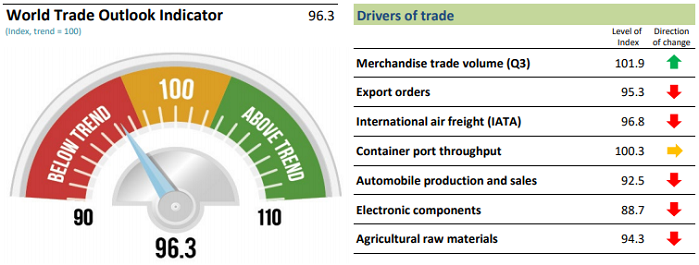
...reading of 96.3 is the weakest since March 2010 and is below the baseline value of ...
Chongqing
Haben Sie zum Beispiel schon einmal von Chongqing gehört (fragt die österr. Tageszeitung "KURIER"?) Die zentralchinesische Metropole ist mit mittlerweile mehr als 33 Millionen Menschen die einwohnermäßig größte Stadt der Welt. Die Metropole...
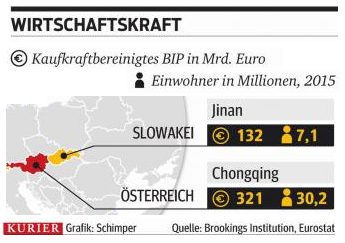
...liegt am Zusammenfluss von Jangtse ...
Using the yield spread to forecast...
recessions & recoveries.
PLEASE CLICK "read more" !
DHL Global Trade Barometer
Das im Januar 2018 gestartete DHL Global Trade Barometer ist ein neuer und einzigartiger Frühindikator für die aktuelle und künftige Entwicklung des Welthandels. Es basiert auf der Auswertung großer Mengen von Logistikdaten mithilfe...
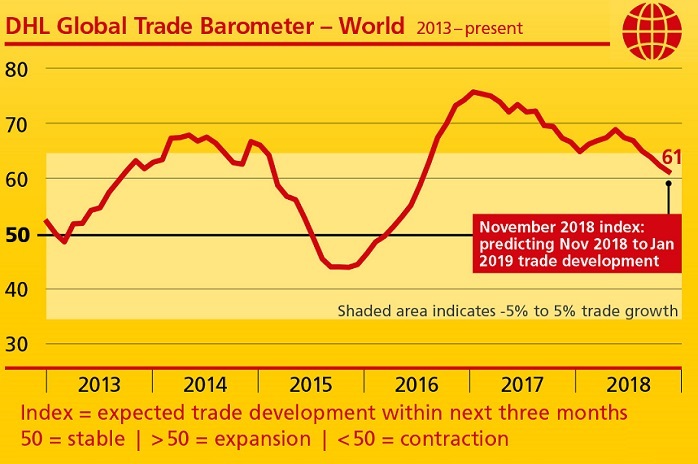
...künstlicher Intelligenz. ...
Indicator signals further loss of momentum...
...in trade growth into Q4-2018
The World Trade Outlook Indicator (WTOI) is designed to provide "real time" information on the trajectory of world trade relative to recent trends. The latest value of 98.6 is lower than...
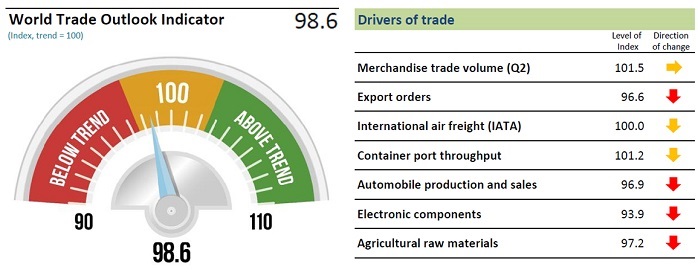
...the previous value of ...
ISM-Index USA (Nov. 2018)
Economic activity in the manufacturing sector expanded in November 2018, and the overall economy grew for the 115th consecutive month, say the nation's supply executives in the latest Manufacturing ISM Report On Business. Manufacturing expanded...
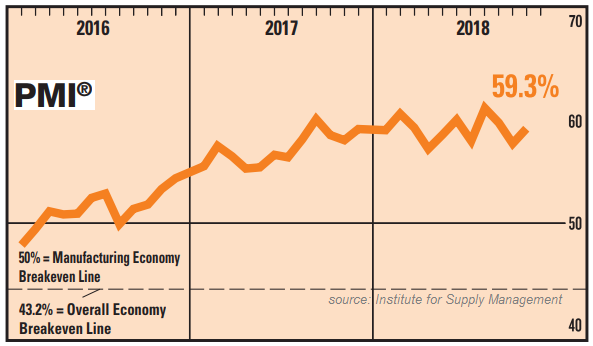
...in November, ...
Austrian Stock Market
(Valuation / PE-Ratio)
The Austrian Stock Market has a tradition to carry a low PE-multiple (PE = Price-Earnings). Currently the Average-PE in the Market is in the single-digits (8.7 only as per Nov. 2018):
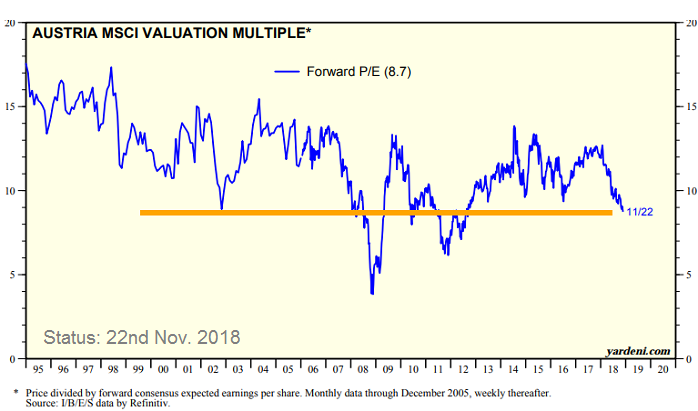
Pretty dirt-cheap Austrian stocks - according to the orange ...
Houston, Husten...(hüstel, haben wir ein Problem?)
Seit "ewigen" Zeiten haben die Amerikaner ein Defizit in der Leistungsbilanz. Es wurde mal mehr beachtet, mal weniger. Deutschland exportiert seit Langem zuerst seine Ersparnisse in die USA, die es dann den...
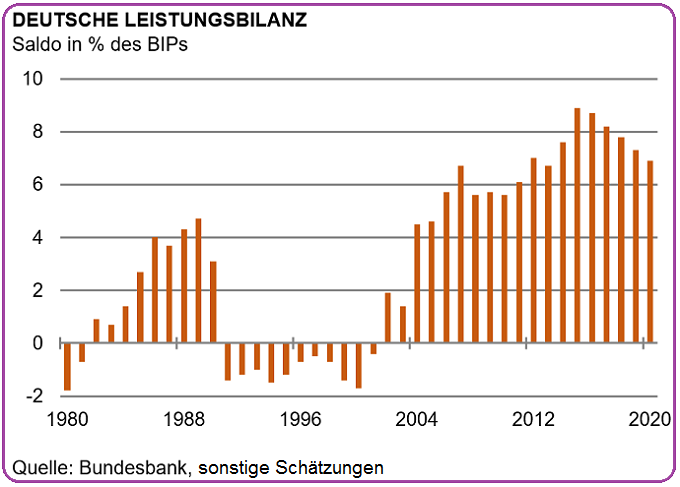
...Amerikanern ermöglichen, ...
US-Industrial Production (Aug. 2018)
Release Date: 14th September 2018; Industrial production rose 0.4 % in August for its third consecutive monthly increase. Manufacturing output moved up 0.2 % on the strength of a 4.0 % rise for motor vehicles and...
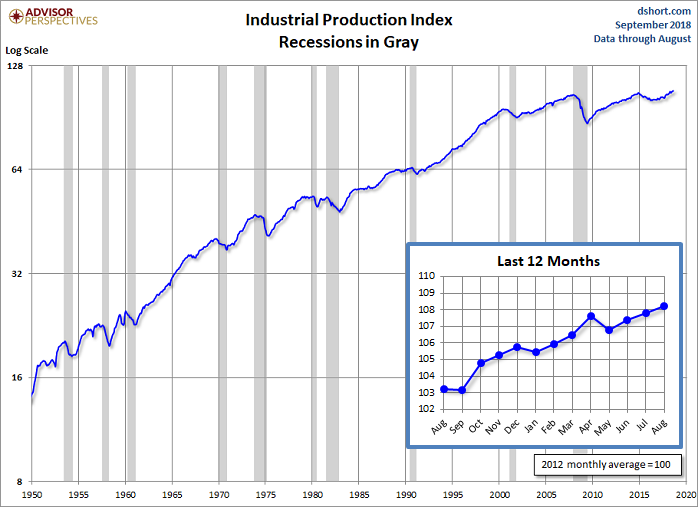
...parts; motor vehicle assemblies ...
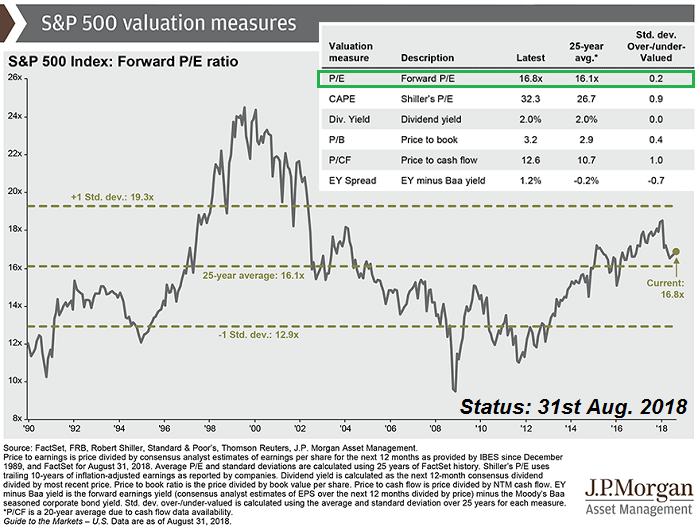
Price-Earnings Ratio S&P 500 (PE-Ratio S&P 500)
One measure of stock valuation suggests equities haven't gotten overstretched. According to J.P. Morgan Asset Management, the forward price-to-earnings ratio for the S&P 500 stands at 16.8 (Status as per 31st Aug. 2018). That's just slightly...
 ...
...
S&P 500 Fair Value (Based on Fwd-Earnings)
When interest rates were between 4% and 6% in the timeframe 1955 until the year 2014, the stock market traded at an average P/E of 20.4x (P/E = Price-Earnings Ratio). If you put standard deviation bands around the cluster, the range would...
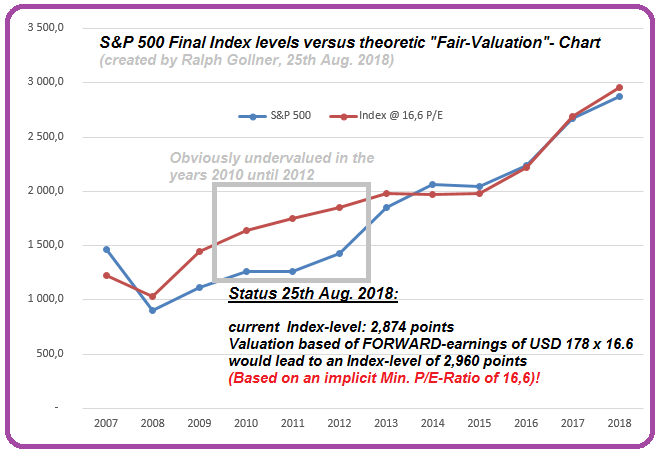
...be ...
The Small Business Optimism Index
...marked its second highest level in the survey's 45-year history at 107.9, rising to within 0.1 point of the July 1983 record-high of 108. The July 2018 report also set new records in terms of owners reporting job creation plans and those with...
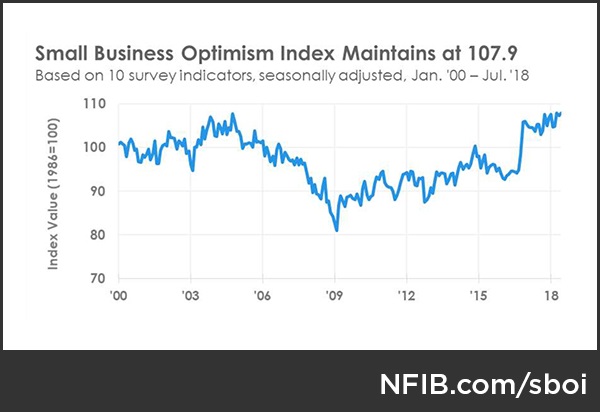
...job ...
Both publications from today are looking nice:
US-Empire State Manufacturing Index and US-Industrial Production
Well, that is just the Status-Quo, but those numbers look ok.
cheers and soo long
Megatrend Urbanisierung
Bis zum Jahr 2050 werden etwa zwei Drittel der Weltbevölkerung in Städten wohnen. Das heißt, praktisch das gesamte Wachstum der Weltbevölkerung wird von den Städten absorbiert werden. Viele Stimmen weisen darauf hin, dass sich die globale...
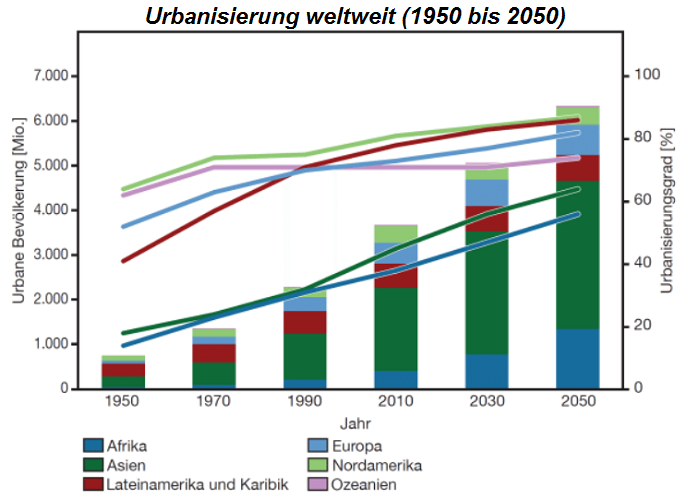
...Entwicklung und ein ...
Valuation (PE-Ratio)
Nasdaq-100
Despite the Index's solid gains in recent years, this has been often matched by growth in forward earnings - such that the forward PE ratio up until the year 2016 had barely changed. In 2017, however, price gains have exceeded...
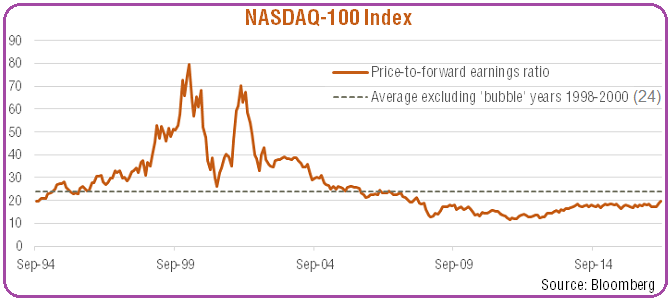
...gains in earnings - such ...
Künstliche Intelligenz und Bilderkennung
Die Irrtumswahrscheinlichkeit bei der ("automatischen") Bilderkennung sinkt dramatisch in den letzten Jahren (siehe fallende Fehlerkurve -in Prozent- im Chart anbei):
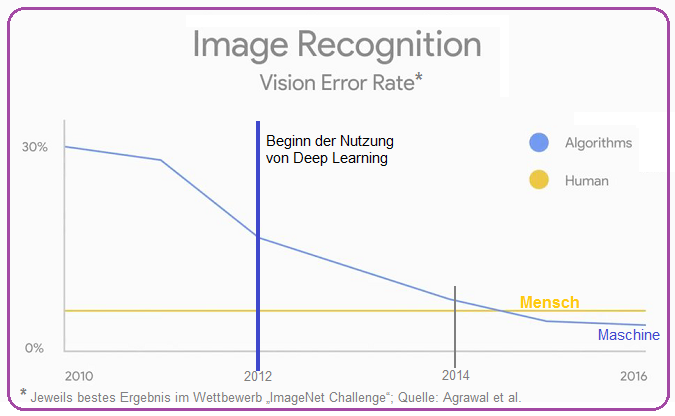
Some words on Machine learning (Figure above; Original text in English)
Machine ...
The US 2-year/10-year spread
The 2-year/10-year spread, which measures the difference between short- and long-term bond yields, fell to 30 basis points as of Tuesday (3rd July 2018). That's the narrowest spread since...
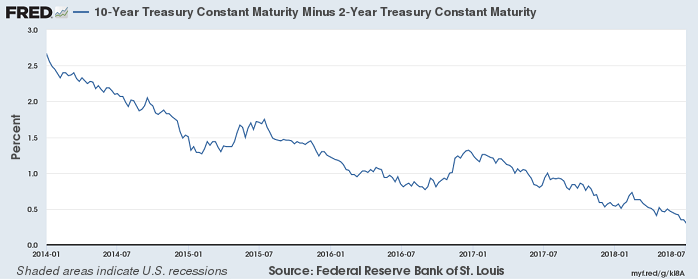
...October 2007, a few months before the Great Recession. A flattening ...
Asset management in China
(years 2018 - 2030)
Asset management in China is a young industry and, as a consequence, Chinese investors, intermediaries and asset managers are not constrained by legacy infrastructure, regulatory frameworks and...
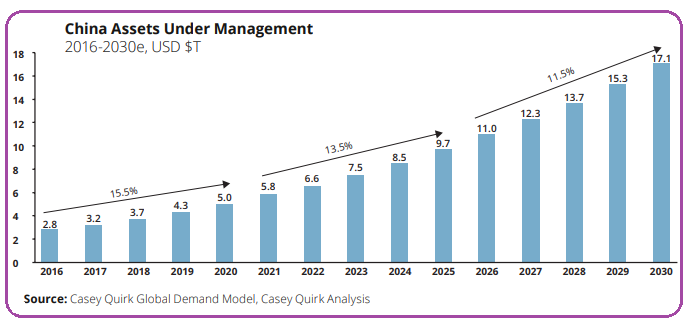
...investment approaches. New thinking can be ...
"FED Balance Sheet Reduction"
(seit Q4-2017)
Mit dem Erwerb von Staatsanleihen und anderen Wertpapieren zur Stützung der US-Konjunktur hatte die Fed ihr Portfolio zwischenzeitlich auf 4,5 Billionen US-Dollar aufgebläht. Sie verringert die Bilanzsumme im Zuge...
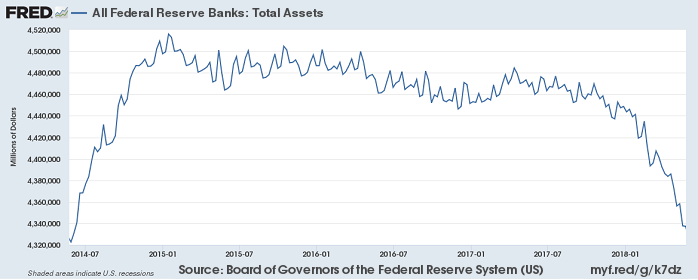
...der Konjunkturerholung aber ...
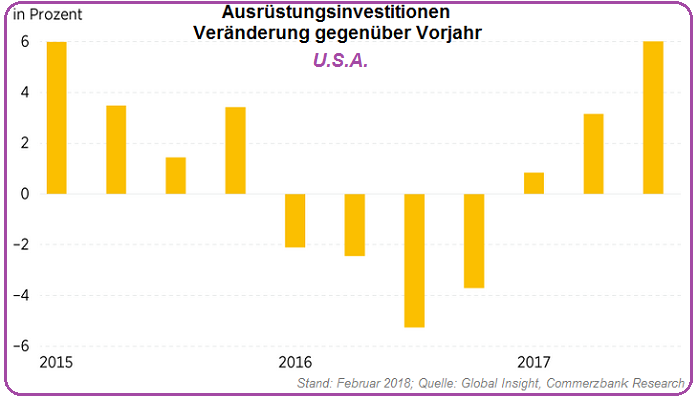
Ausrüstungsinvestitionen U.S.A.
("CAPEX")
Capital Expenditures, what else? Wenn man Trump Irgendetwas Positives anrechnen will, dann eventuell, dass er die sogenannten "Animal Spirits unleashed" hat. Am ehesten kann sich Trump wohl anrechnen, dass die Unternehmen wieder Vertrauen...
...
5-Year, 5-Year Forward Inflation Expectation Rate (T5YIFR)
versus Oil-Price (WTI)
The following series is a measure of expected inflation (on average) over the five-year period that begins five years from today. Please remember: If the investment-yield of your investments is < Inflation,...
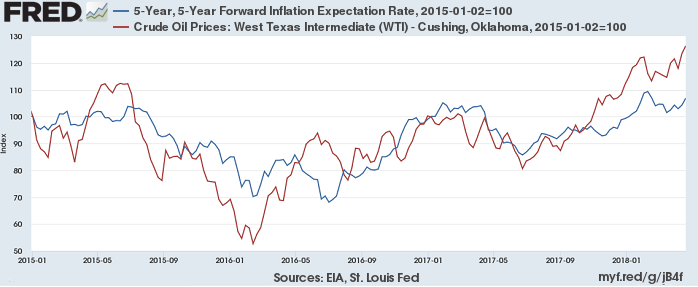
...
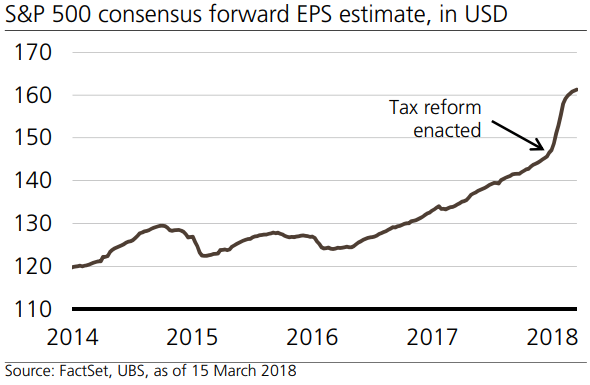
S&P 500 - Index-earnings (April 2018)
One of the key financial market driver should be the Healthy US profit growth (according to UBS-Bank). Adding it all up, UBS estimates S&P 500 EPS ("index-earnings") will rise 16% to USD 154 in 2018, up from 12% growth in 2017. Earnings growth...
...
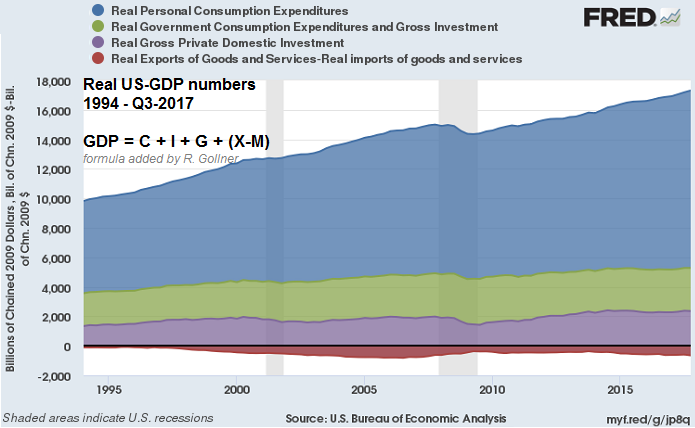
GDP = C + I + G + (X-M)
GDP = Gross Domestic Product (and its components)
♦ C = Consumer spending
♦ I = Investment (Gross Fixed Capital Formation)
♦ G = Government Spending
♦ X = Exports
♦ M = Import
short video & link:
DAX Renditen (März 2018 bis 2026 / 2031)
Natürlich gelten solche Aussagen nur mit einer gehörigen Portion "Augenzwinkern". Nichts ist so unsicher wie die Zukunft, dennoch... Mithilfe von Infos von starcapital-research und meinen eigenen Erfahrungen aus Studium & Co. - voilà:
♦) Aktuelles ...
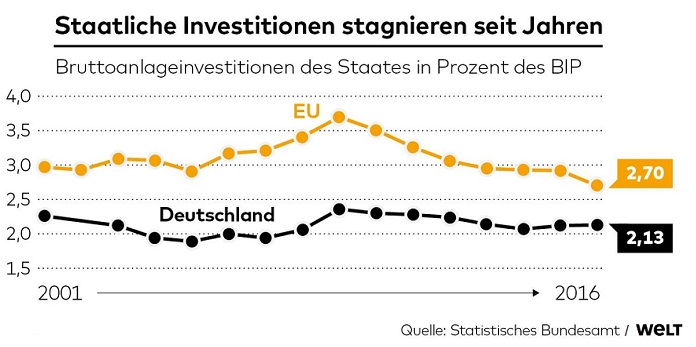
Die deutsche Investitionsquote ist eine der niedrigsten weltweit
Jedes Jahr werden in Deutschland rund 75 Milliarden Euro weniger investiert, als eigentlich nötig wären, hat das Deutsche Institut für Wirtschaftsforschung (DIW) errechnet (Status aus dem Jahr 2013, Befund jedoch wohl...
...
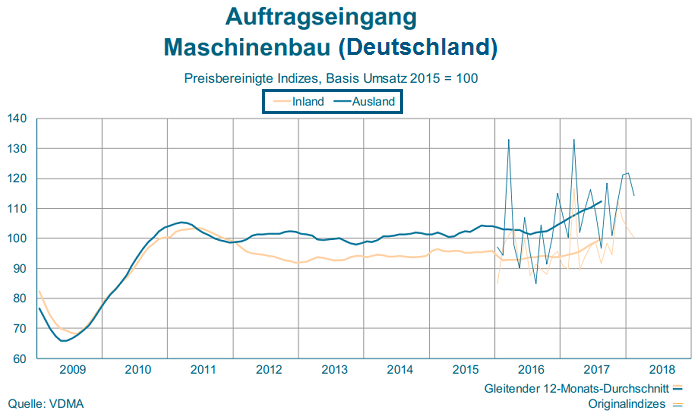
Maschinenbau / Deutschland
(Auftragseingänge)
Im Februar 2018 sind die Auftragseingänge im Maschinenbau in Deutschland um real 13% im Vergleich zum Vorjahr gestiegen. Damit setzte sich die Dynamik der vergangenen Monate flächendeckend mit zweistelligen Zuwächsen fort. Während die...
...
Adjusted loans (seasonally adjusted) to euro area households
in the euro area
The annual growth rate of the broad monetary aggregate M3 stood at 4.6% in January 2018, unchanged from the previous month. The annual growth rate of adjusted loans to households stood at 2.9% in...
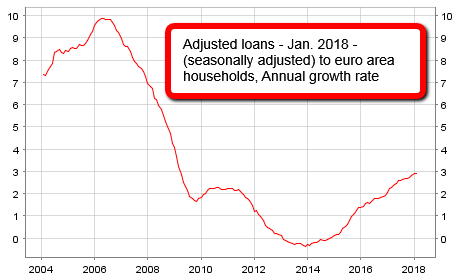
... January ...
Affordable living for the majority
(on the right path?)
Please recheck the evolution over the last decades:
I guess globally (!) we are taking steps in the right direction, time will tell how fast we can push these developments forward!!
Measuring poverty
Measuring poverty is difficult ...
Immo-Kaufpreis
versus
Immo-Finanzierung
Bei den meisten Entscheidungen zu Finanzthemen, welche -insbesondere- die ungewisse Zukunft betreffen ist eine umfassende Prüfung verschiedener Einflussfaktoren eine sehr gute Idee...so auch unbedingt bei der "Immobilienfrage". In dieser folgenden...

...
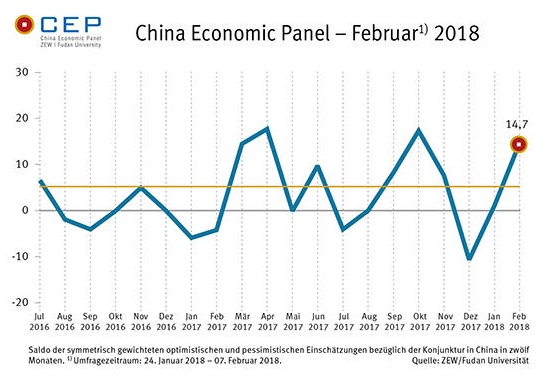
Konjunkturerwartungen für China verbessern sich deutlich
In der CEP-Umfrage vom Februar (24. Jan. 2018 bis 7. Feb. 2018) steigen die Konjunkturerwartungen für China erneut an. Der neue Wert des CEP-Indikators liegt aktuell bei 14,7 Punkten, 13,6 Punkte mehr als im Januar und gar mehr als...
 ...
...
S&P 500 Forward PE
(Status: 8th Feb. 2018)
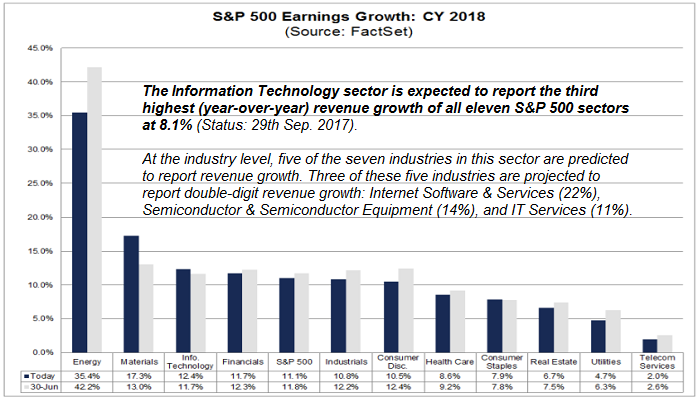
Info upfront: The IT-Sector now "already" accounts for more than 25% of the S&P 500 Stock Index. But Then might come another question: Why do IT-stocks often perform nicely and -even also- for the majority...
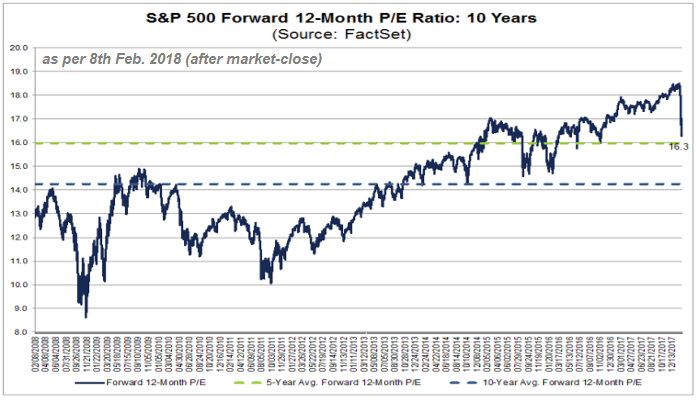
...of StockMarket-observers reasonably ...
The benchmark 10-year U.S. yield cracked
an interesting level
The benchmark 10-year U.S. yield cracked 2.7 percent on Monday, rising to a point many forecasters weren't expecting until the final months of 2018. For over a year, range-bound Treasuries helped keep financial...
...markets in a ...
Asia, what else?
;-)
In fast allen aufstrebenden, asiatischen Schwellenländern haben sich die Konjunkturdaten in den vergangenen Monaten weiter verbessert. China, Vietnam, Indonesien & Co. - das Wachstum im vierten Quartal vergangenen Jahres lag jeweils teils deutlich über...
...den ...
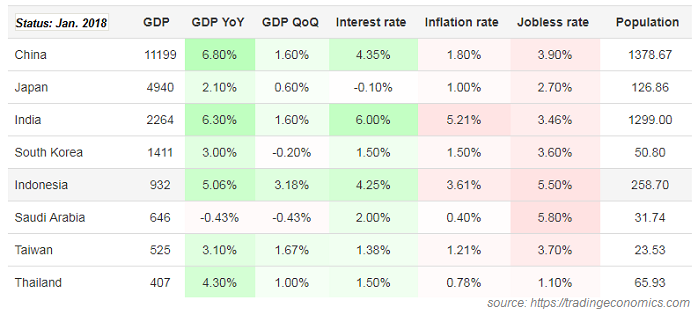
Wo steht der "Weltzins" aktuell?
Man könnte sich -theoretisch- positiv für die Aktienmärkte zeigen und erst dann eine Neubewertung der Aktienmärkte erwarten, wenn der Weltzins (siehe einzelnen Leitzinsen im Schaubild anbei) von aktuell ca. 1,5% auf 2,5% (oder eventuell gar auf 2,75 %!)...
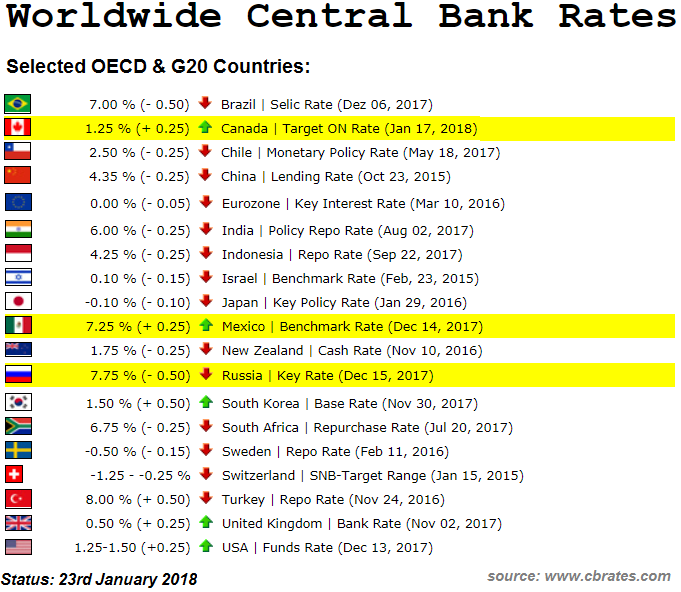
...
Steigendes Dreieck - Interessantes Chartmuster
Im Aktienhandel ist die Charttechnik manchmal eine gute Hilfe. Weil der Kurs oft den gleichen Gesetzmäßigkeiten am Markt folgt, kann man anhand verschiedener Formationen erkennen, wie es...
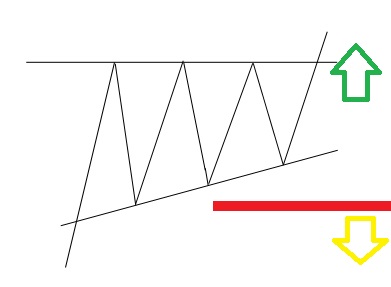
...weitergehen könnte und wann der beste Zeitpunkt für ...
Quantity Theory of Money
It is difficult to measure the money supply, but most economists use the Federal Reserve's aggregates known as M1 and M2. Gross domestic product, or GDP, is another government statistic that is tricky to measure perfectly, but nominal GDP...
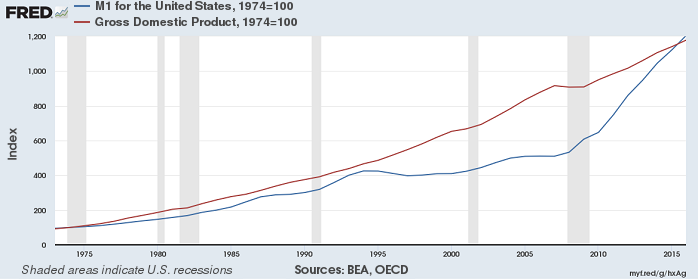
...tends to rise with ...
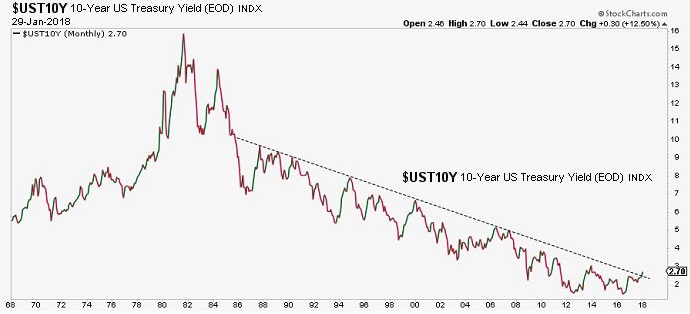
US 10year-Treasury yield
The longest-running and most important market trend of them all >> The 10-year Treasury yield, arguably the most important number in world finance, which sets the notional "risk-free rate" in global transactions, has trended down steadily...
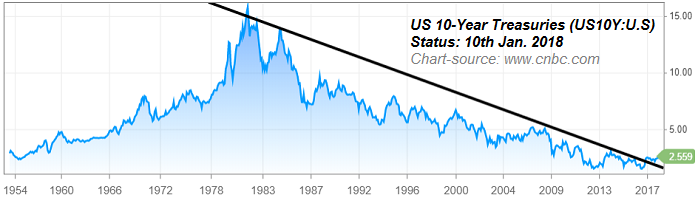
...ever since Paul ...
A short "reminder" on US-Treasuries (10 year T-Bond)
& US-Equities-Valuation
♦ Average 10 year T-Bond yield since the year 1871 is ca. 4.6% (Status Q4-2016)
♦ Maximum 10 year T-Bond yield since 1871 is 15.3% (September of 1981)
♦ Current 10 year T-Bond yield...
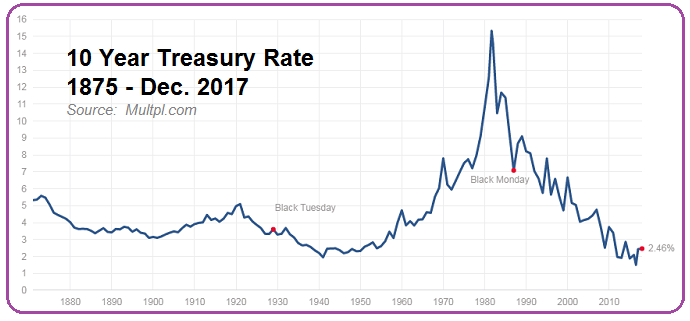
...is 2.497% (as per 20th Dec. ...
Cash Flow Yield
Question: What best explains the next five years of equity returns?
Answer: Based on the historical record since 1970, the correct answer is: Today's cash flow yield.
Initial cash flow yields offer the best explanation since 1970 (Status: 2013). They account for...
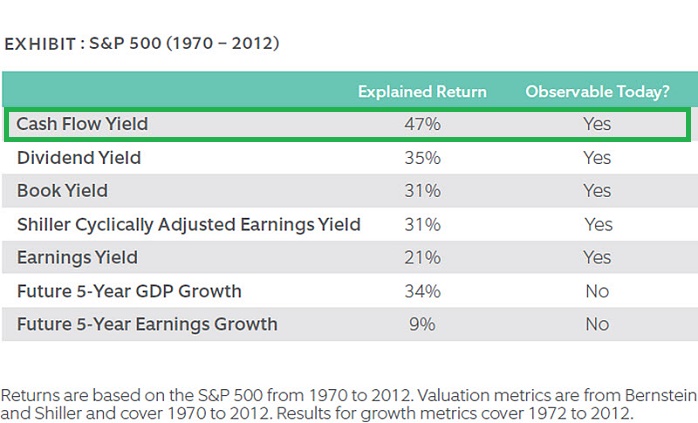
...47% of ...
Check MOAT, then management, but ALWAYS:
Re-check Price
Rarely will the stars align so that great management (skill), moat (of the business/-model) are all clear to be seen for the potential investor and eventually also underpriced by the market (very rare!), so that...
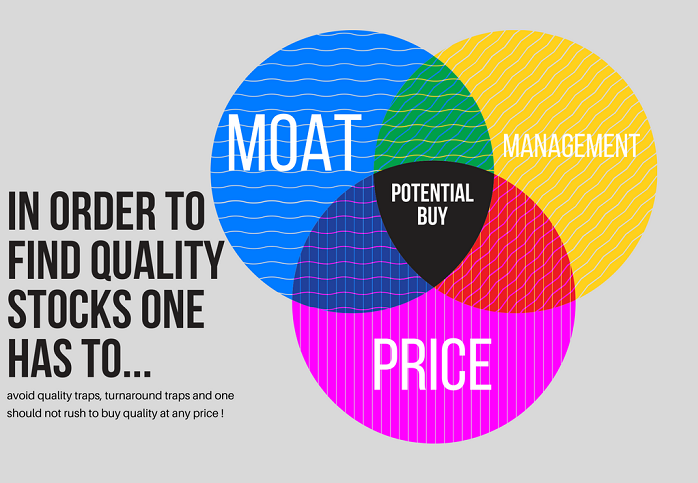
... a clear strong ...
Bis Q4-2018/eher 2019 ist wohl keine Hoffnung auf
steigende Zinsen angebracht...
Somit droht europäischen Aktien aber auch kein Gegenwind in Form steigender Zinsen. Weitere Unterstützung für Aktien kommt von der Weltkonjunktur, insbesondere den Schwellenländern.

please check out the most ...
India (GDP 2000 - 2016)
The statistic shows the gross domestic product (GDP) per capita in India from 2000 to 2016:
The projections up until 2020 are shown in the next graph (see below). As can be seen in both graphs (but different sources) in the year 2013, the estimated gross domestic ...
Let's check out this "widget"
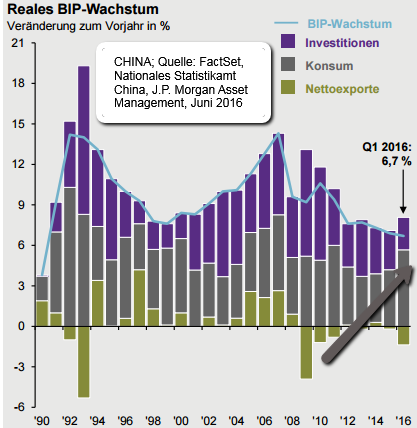
GDP (Gross Domestic Product) is made up of its components: C + I + G + (M - X); Or in other words: Private Consumption, Business Investment, Government Investment and Net Exports; Here you will find some data on China/the Private Consumption component (C):
Some ...
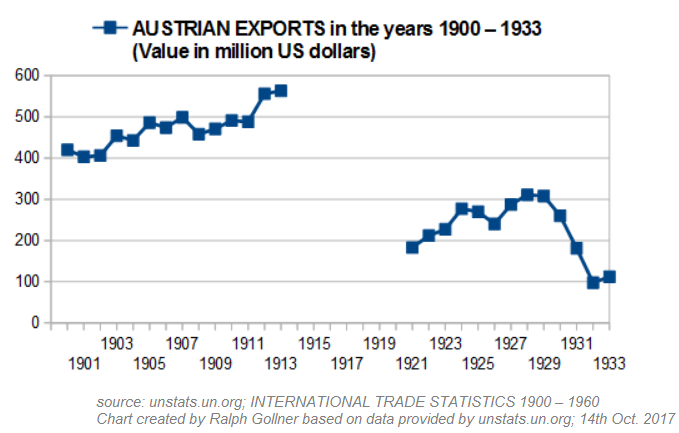
Austria (Exports in the period: 1900 - 1933)
"Unemployment"
The number of tourists visiting Austria rose by 82 % from 1923 to 1929/1930. Of course, the onset of the world economic crisis stopped this favourable development. Tourism proved highly sensitive to the effects of recession. The...
...
S&P 500 earnings (growth)
The Stock Market currently has some Corporate Profit tailwind. Since 1960, profits [...] have fluctuated around a long-term uptrend line growing at a 7% compounded annual rate. S&P 500 earnings tend to fluctuate between...
...long-term growth uptrend lines of 5% ...
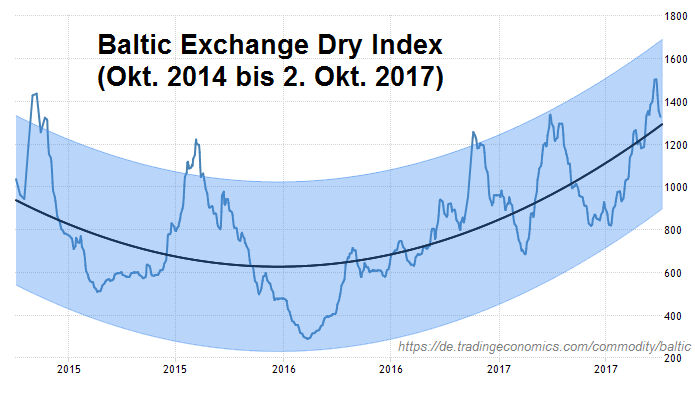
Baltic Dry Index (BDI)
Okt. 2014 bis Okt. 2017
Der Baltic Dry Index (BDI) wird von der Baltic Exchange in London veröffentlicht und ist ein wichtiger Preisindex für das weltweite Verschiffen von Hauptfrachtgütern (hauptsächlich Kohle, Eisenerz und Getreide) auf Standardrouten.
Der Baltic Dry ...
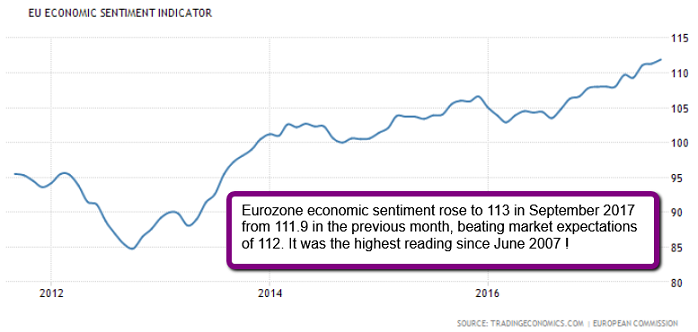
Euro Area Economic Sentiment Indicator
Making Sense of The European Economic Sentiment Indicator (ESI)
The ESI is derived from surveys gathering the assessments of economic operators of the current economic situation and their expectations about future developments. The ESI is derived...
...
GDP Growth & Stock Market Returns
(1970 - 2015)
There is always (!) the relationship between macroeconomics and (financial) markets. There should be some skepticism that in a low global growth world we can maintain persistently high long-term market returns. There may actually be a simple...
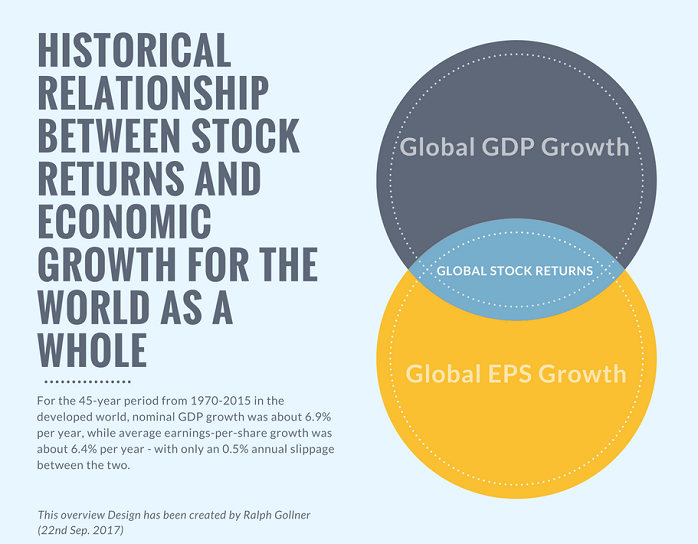 ...
...
Inflation und Dein Geburtsjahr
Wir nehmen Inflation meistens dadurch wahr, dass alles teurer wird. Aber eigentlich beschreibt der Begriff nicht die Preise, sondern den Wert unseres Geldes. Und das verdeutlicht sich am besten an einer langen Zeitleiste:
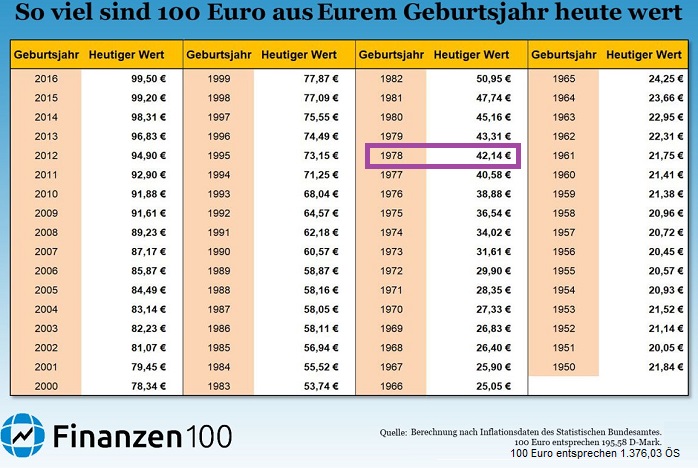
Deutschland-Fokus: Folgend den ...
Deconstructing 30 Year Stock Market Returns
& "Gimmick"
One of the most impressive long-term stock market statistics has to be the historical 30 year returns on the S&P 500: this graph shows the rolling annual 30 year returns from the corresponding start dates. The worst 30 year...
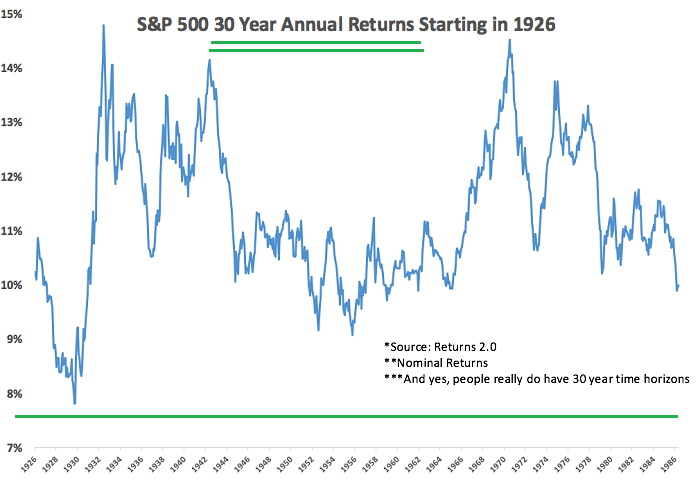
...return ...
y2k Tech-Bubble Peak versus US-Stock Market
A short reminder about what really happened in the late 90s (last years of the last century) in the US-Stock Market, but also in global Tech-Stocks (extreme example: "Neuer Markt" in Germany). Please look at the disparity between the P/E-Ratios:
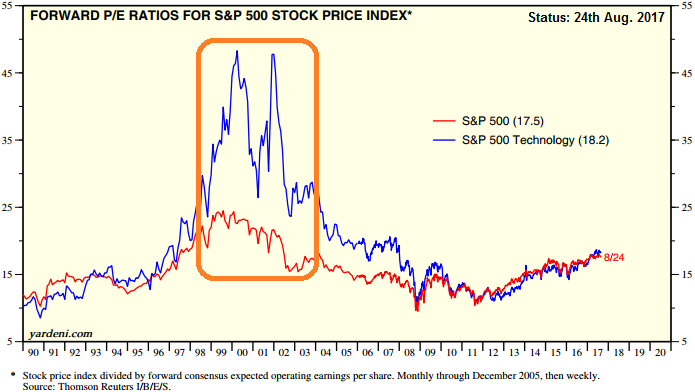
...
Value - "Comeback" (?)
For anyone with more than a decade in the markets, the "value premium" is almost a sacred rule. The idea that stocks with lower valuation premiums would beat their more expensive "growth" peers is almost a given. Nobel laureates Eugene Fama and Kenneth French...
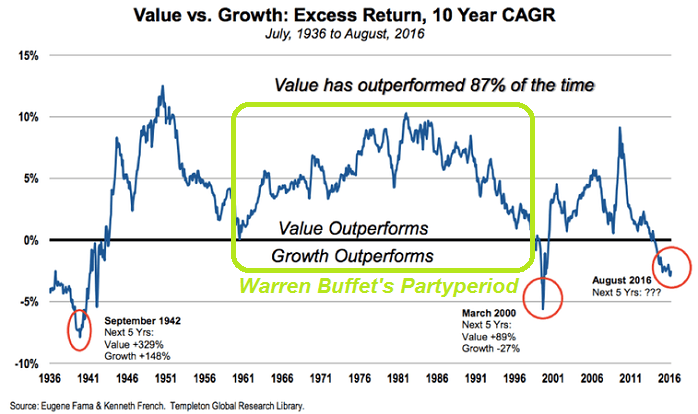
...
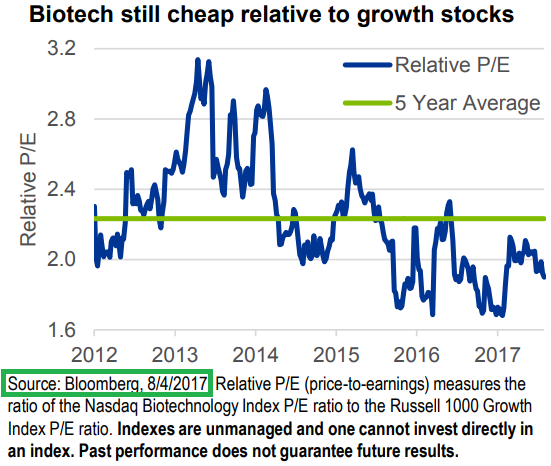
Risky Sector, but the future "lies in their hands"
BIOTECH
Status @ the start of August (but now we are @ the last day of Aug. and some M&A-Activity has "taken over" - yes, some play on words...): Under-owned, undervalued? While bio-pharma's long-term growth drivers haven't changed, its...
...
Chicago PMI & ISM-Index
Der Chicago Einkaufsmanagerindex (Chicago PMI) misst die Gesundheit der Wirtschaft des Herstellungssektors in der Region Chicago. Jede Lesung über 50 weist auf eine Erweiterung des Herstellungssektors, während eine Lesung unter 50 ...
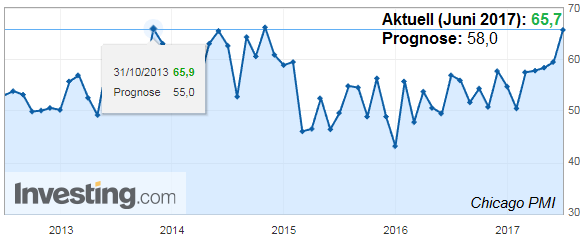
...auf eine Verkleinerung ...
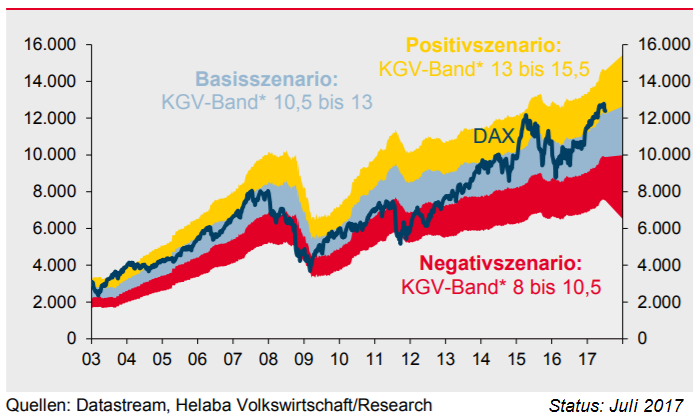
DAX - Bewertungsbänder
In guten Zeiten kann der deutsche Aktienindex durchaus in den gelben Bereich "laufen"; In schwierigeren Zeiten dagegen werden den deutschen Aktien oft nur KGVs von 8 bis 11 zugetraut. Man sieht, KGVs zw. 9 und 16 sind "immer" möglich...
S&P 500 Valuation (HY2 / 2017)
The S&P 500 should be able to trade around a 17-18x P/E Multiple...In the context of the inflation outlook in the U.S. and the developed world, there appears to be little risk for earnings multiples in the short term.
Posting from 11th April 2017 / Valuation ...
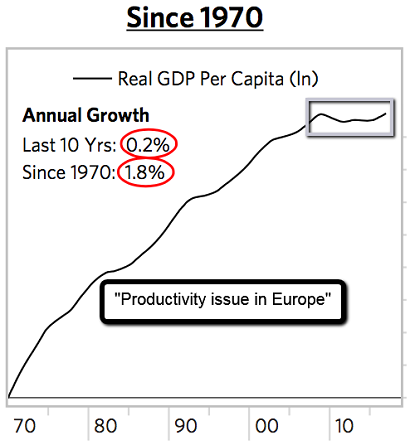
GDP-Growth (Productivity Growth "inside")
1950-2014 & 2014-2064 (!)
Without action, global economic growth may almost halve in the next 50 years. (BUT) a "new" McKinsey Global Institute report offers a solution: a dramatic improvement in productivity.
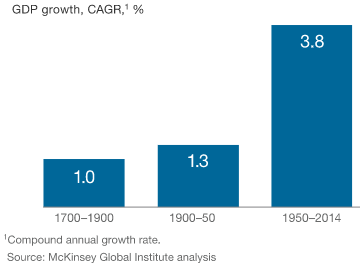
Over the past 50 years, global ...
Free Cash Flow (Yield)
Wenn es um die Einschätzung von Unternehmen und Aktien geht, dann ist der beste Weg, eine detaillierte Bewertung durchzuführen. Dies ist ein aufwendiges Unterfangen, welches eine Menge Arbeit erfordert. Daher ist es eine beliebte Vorgehensweise, zunächst einmal...
...
Bewertung Europa-Aktien versus US-Aktien
Die Grafik zeigt, dass das Kurs-BuchwertVerhältnis europäischer Aktien in Relation zu US-Titeln fast den niedrigsten Stand seit 25 Jahren erreicht hat. Zudem erleben die europäischen Volkswirtschaften derzeit einen simultanen Wirtschaftsaufschwung.
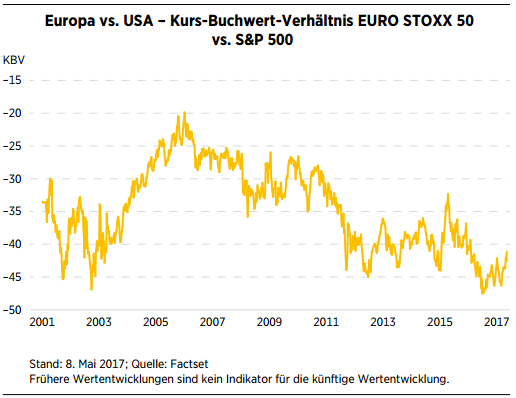
...
The Chicago Fed National Activity Index
The "CFNAI" is a monthly index designed to gauge overall economic activity and related inflationary pressure. The CFNAI is released at 8:30 a.m. ET on scheduled days, normally toward the end of each calendar month.
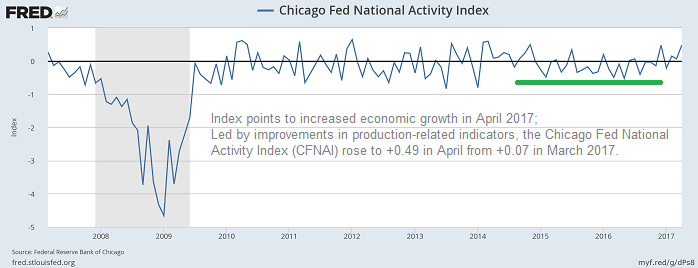
The CFNAI is a weighted average of ...
The unprecedented expansion of the global middle class
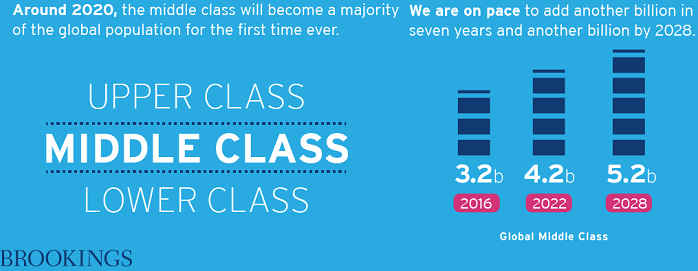
Next 10 years better than last 10 years (?)
Eurozone (Status: Q2/2017)
The Eurozone as a whole is around cyclical equilibrium, but this masks significant divergences between depressed periphery countries and Germany, where the economy is running hot. In response to ECB stimulation, growth...
 ...
...
LEI (U.S)
1973 - 2017
About The Conference Board Leading Economic Index (LEI) for the United States: The composite economic indexes are the key elements in an analytic system designed to signal peaks and troughs in the business cycle. The leading,...
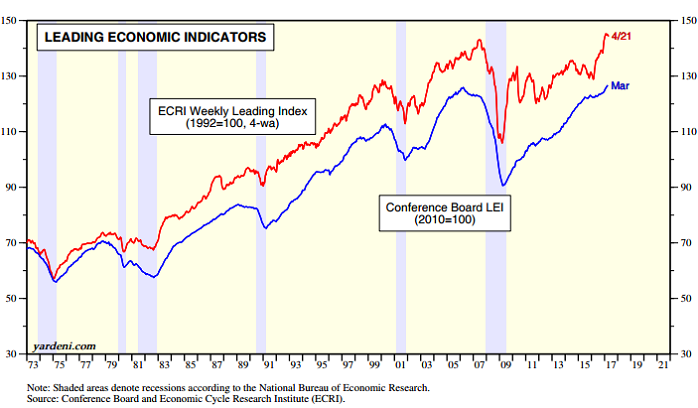
...coincident, and lagging economic ...
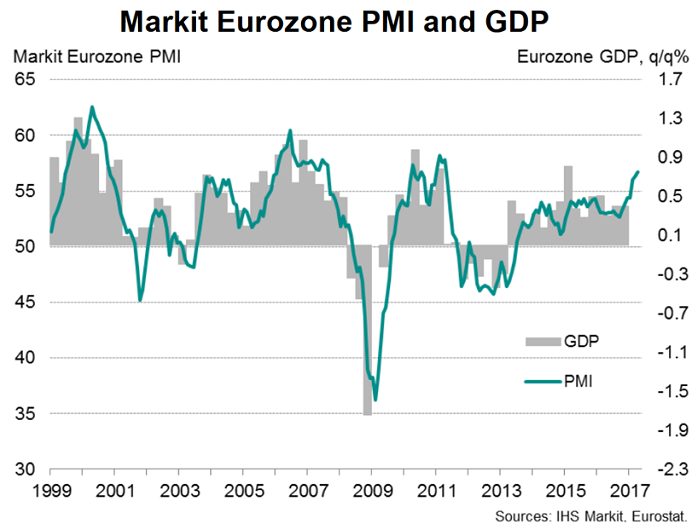
PMI & GDP Eurozone (Q1-2017, April 2017)
Eurozone PMI shows growth a six-year high! The eurozone's private sector has posted its best quarter since the start of the financial crisis.
WrapUp: Data firm Markit reports that Eurozone output and new order growth accelerated to near six-year ...
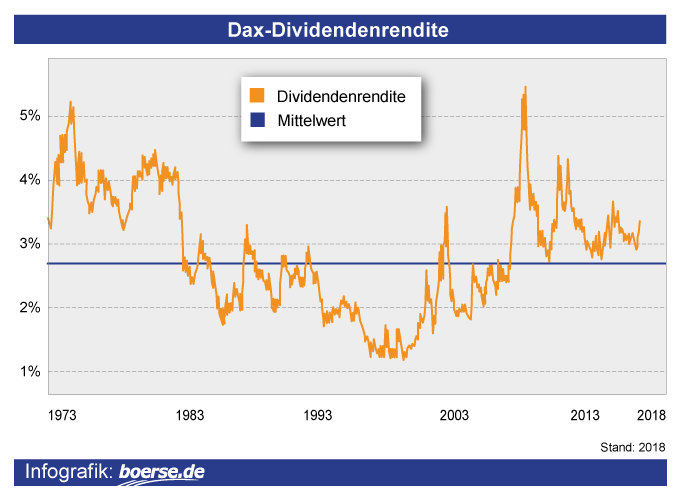
DAX-Dividendenrendite versus...
Die 30 Unternehmen im DAX haben derzeit eine Marktkapitalisierung von 1.200 Milliarden Euro. Die von der CoBa erwartete Dividendensumme von 31,7 Milliarden Euro entspricht daher einer Dividendenrendite von 2,6 %. Die DAX-Dividendenrendite liegt...
...damit ...
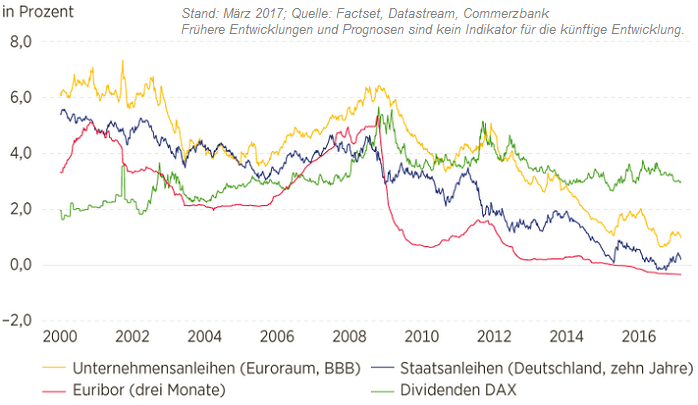
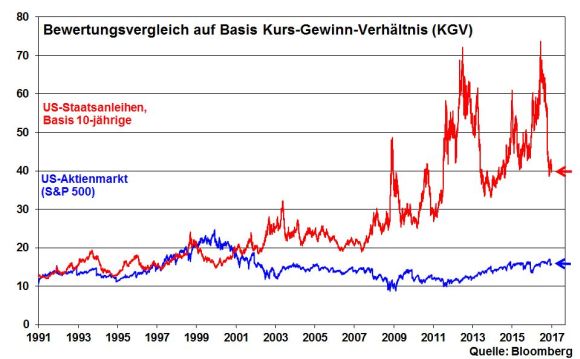
Bewertung "Anleihen versus Aktien"
US-Treasuries (Bonds) versus S&P 500 (Stocks)
Per Q1-2017 rentierten 10-jährige US-Staatsanleihen bei ca. 2,5%. Der Kehrwert dieser 2,5% (also 100/2,5) ergibt ein theoretisches Anleihen-KGV von ca. 40! Das aktuelle KGV des S&P 500 liegt ca. bei 18,5...
 ...
...
Earnings Yield vs. Bond Yield
("Fair Valuation" / Fair P/E ?)
As you learn in finance 101, the value of an asset is based on its future cash flows. To get a present value, you must discount this cash flow, or earnings, using an interest rate. When interest rates are high, the...
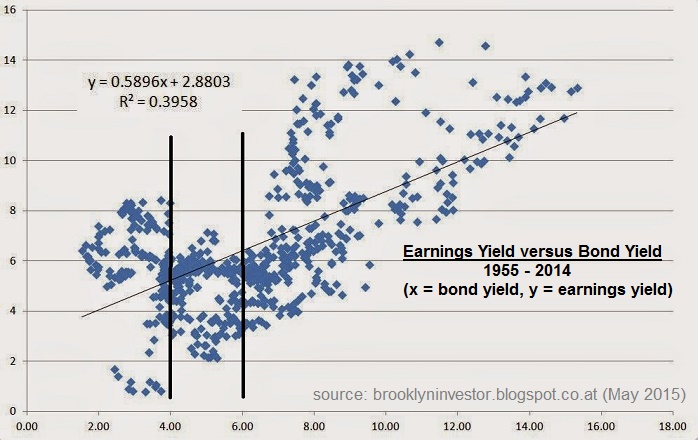
...
Der globale Einkaufsmanagerindex (EMI) notiert über der "magischen 50-er Marke"
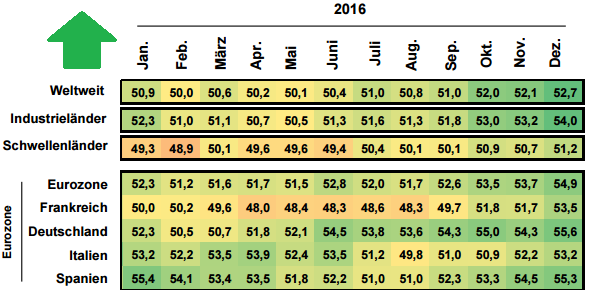 Quelle: FactSet, Markit, J.P. Morgan Asset Management
Der globale Einkaufsmanagerindex (EMI) bewertet die wirtschaftliche Gesundheit des verarbeitenden Gewerbes, indem die Pläne für Leistung und Beschäftigung ...
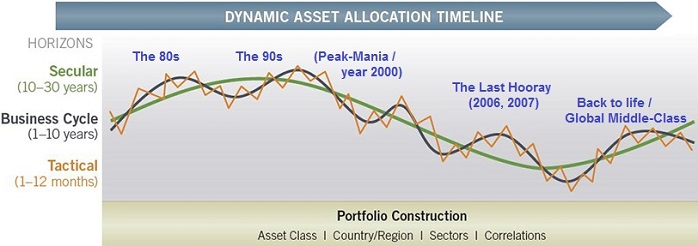
The phases of the economy provide a framework for sector allocation
Over the intermediate term, asset performance is often driven largely by cyclical factors tied to the state of the economy, such as corporate earnings, interest rates, and inflation. The business cycle, which encompasses...
 ...
...
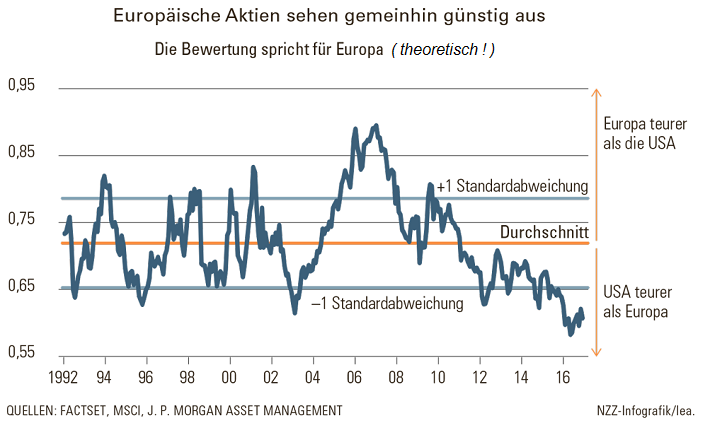
Eine (aktuelle) Analyse von J. P. Morgan Asset Management zeigt, dass das Kurs-Buchwert-Verhältnis europäischer Aktienpapiere im relativen Vergleich mit amerikanischen beinahe den niedrigsten Stand seit 25 Jahren erreicht hat (siehe Chart oben).
Zudem erlebten die europäischen Länder einen ...
DAX-Rollierende 12-Monats-Entwicklung und Buchwert
(2001 - 2016)
Der DAX und "sein Buchwert"; Der Buchwert ist der Wert der Unternehmenssubstanz oder grob vereinfacht: das Eigenkapital eines Unternehmens. Bei der Ausweisung des Buchwertes geht es um die Frage, wie...
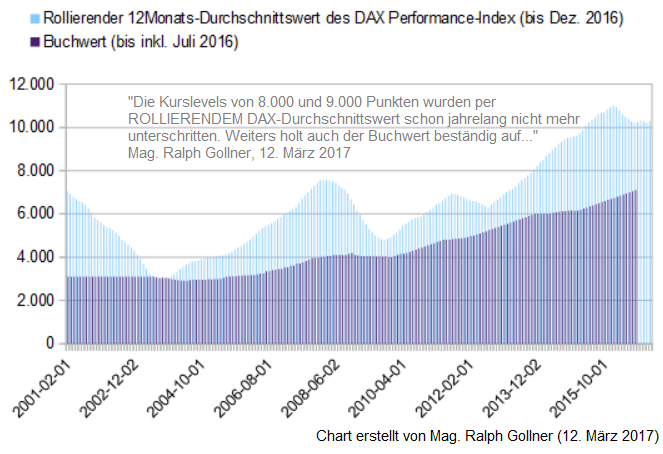
...viel die ...
Price-Sales-Ratio (P/S-Ratio)
1999 vs. 2015
Morgan Stanley's Adam Parker comments on valuations regarding Tech-Stocks. Parker looked a little below the surface in a research note and shared a key difference between the stock markets in 2014/2015 and the dotcom bubble of the 1990's.
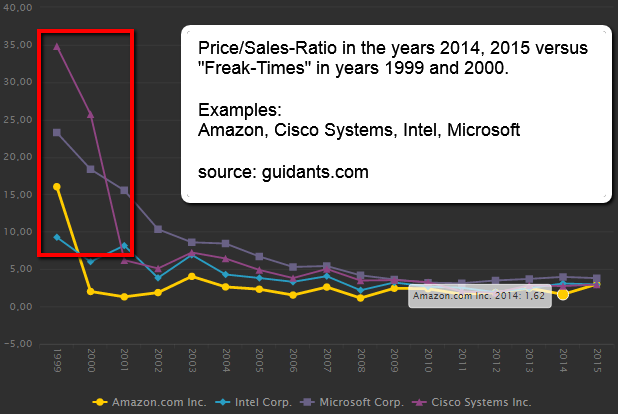
"About ...
DAX-Bewertung 1988-2010
Folgend der fundamentalen Bewertung des DAX und vor dem aktuellen Gewinnumfeld im DAX und der zusätzlichen Erwartung, dass die DAX-Gewinne im Jahr 2017 auf ca. 920 Indexpunkte zulegen könnten (ca. 5% Wachstum), würde dies gleichzeitig...
...auch ein Allzeithoch für ...
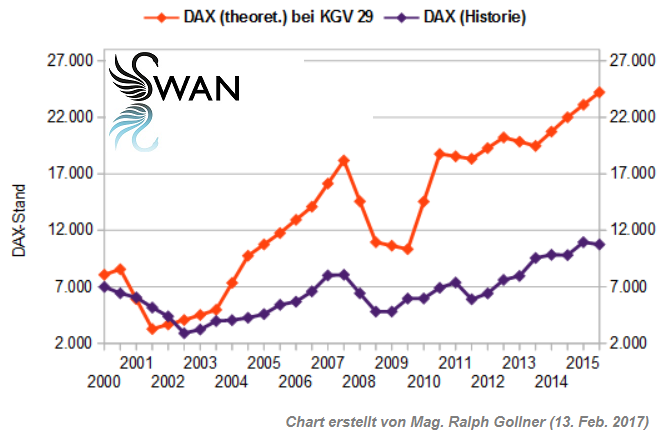
DAX (damals) bei KGV 29
freaky Bewertungen aus den 90ern...
Fakt ist, dass im historischen Vergleich der dt. Leitindex, gemessen am KGV, (wohl) noch relativ fair bewertet ist. Im Jahr 2000 lag das KGV bei circa 29. Aktuell (per 13. Feb. 2017 bei ca. 11.700 Punkten) liegt es UNTER 14.
...
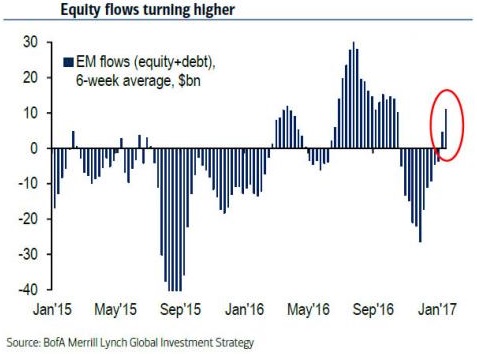
EM Fund Inflows
(Status: 9th Feb. 2017)
According to the latest fund flow report from BofA's Michael Hartnett, "it's risk-on in Bonds, it's inflation-on in Stocks, and EM is now playing role of cyclical catch-up trade." First in bonds, there has been renewed interest in EM debt...
...
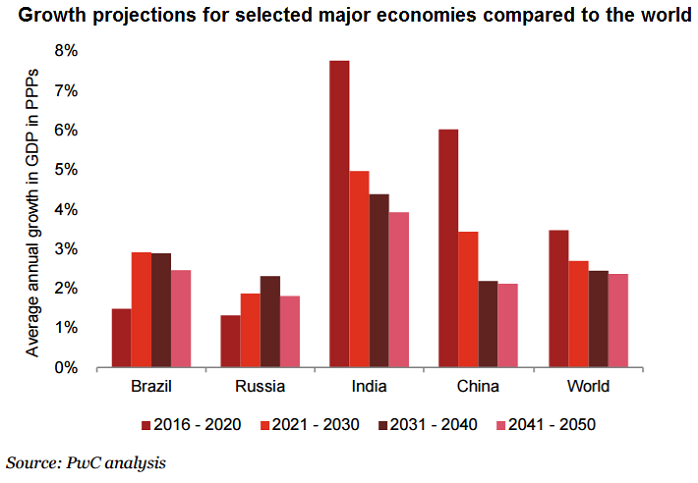
Who knows what the future will bring
(2016-2050!)
Today's advanced economies will continue to have higher average incomes, but emerging economies should make good progress towards closing this gap by 2050. This will open up great opportunities for businesses prepared to make long-term...
...
Emerging Markets
(Valuation)
In terms of valuations, the MSCI Emerging Markets Index has traded at a significant discount to the MSCI World Index, for example, on a price-to-earnings-multiple basis. ("But") earnings growth trends have improved markedly during 2016!
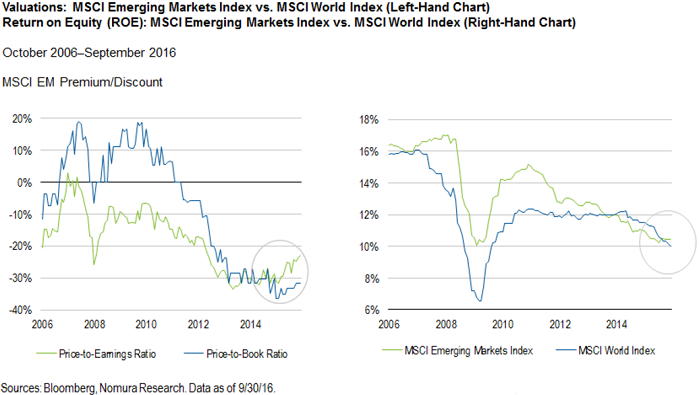
Emerging-market countries ...
Welt-Index (>50%), Zeitraum: 07/2011-12/2016
Der "Welt"-Index basiert auf einer Analyse der 50 weltweit wichtigsten Konjunkturindikatoren. Diese Auswertung wird monatlich für die "Welt am Sonntag" erstellt. Jeder Stand über 50% bedeutet solides Wachstum; Aktuell notiert der Index bei 67%:
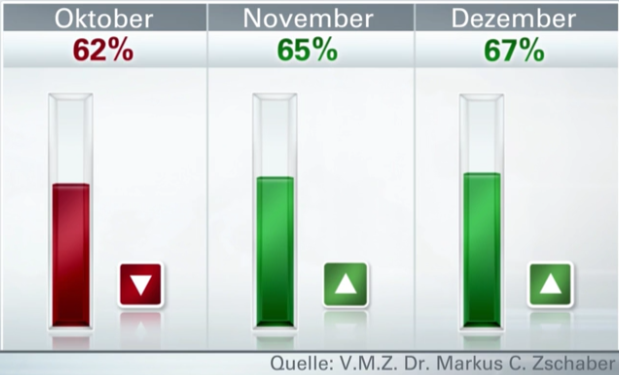
...
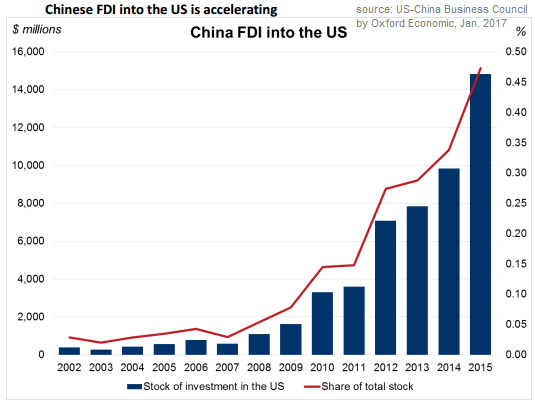
China (2015 - 2025) & U.S.A. - Trade Relationship
As the Chinese middle class continues its rapid expansion over the next decade (the number of Chinese middle-class consumers will exceed the entire population of the United States by 2026), US companies face significant opportunities...
...
DAX-Bewertung, EM-Bewertung (Q4-2016)
(Mögliche Renditen 2016 -2031)
"Unter Schwankungen bergauf"; Unter der Annahme, dass die Zusammenhänge der letzten 130 Jahre fortbestehen, lassen sich auf Basis aktueller CAPE und KBV langfristige Renditeschätzungen für Aktienmärkte ableiten.
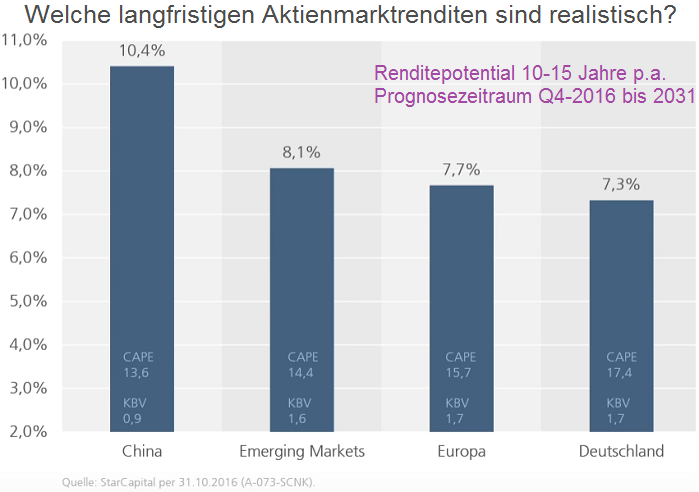
Höhere ...
Cash Flow and S&P 500 - connection
(correlation?)
There are several ways to estimate an intrinsic stock valuation. Companies have an intrinsic value, and that intrinsic value is based on the amount of free cash flow they can provide during their effective lifetime.
Money later is worth less ...
Back-of-the-envelope calculation (?)
Aswath Damodaran is a Professor at the Stern School of Business at New York University and Expert when it comes to Valuation(-techniques). He estimates expected cash flows from dividends and buybacks from holding the S&P 500 for the next five years,...
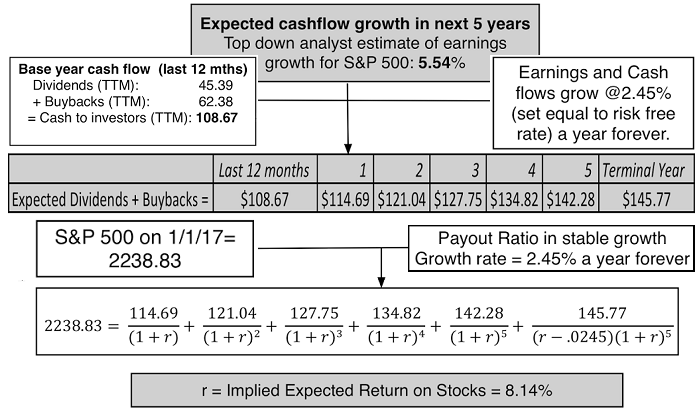
...
Valuation S&P 500 (quick n dirty)
Source for the data below: FactSet, Standard & Poor’s, Tullett Prebon, J.P. Morgan Asset Management. The P/E ratios are forward P/E ratios.
Forward P/E ratio is a bottom-up calculation based on the most recent price data divided by the mean consensus ...
Bitcoin @ USD 1,000
As 2017 kicked off, and with the bulk of other financial markets closed, Bitcoin took the stage, hitting a fresh milestone atop USD 1,000.
A single Bitcoin was trading at USD 1,025 Monday morning (2nd Jan. 2017), according to pricing data from Coin Market Cap. Other big ...
PMIs Global (Jan. 2017)
Global PMI-Status; Out of 47 countries/regions 33 countries carry a PMI reading > 50 (pos. reading), 33/47 = 70%**. Every year (around January) I am building my own Global-PMI-Tachometer Status.
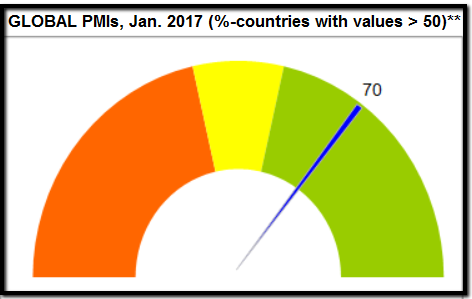
Definition of 'Purchasing Managers' Index - PMI: An indicator of the ...
US Consumer sentiment (highest level in 12 years)
The final December (-2016) reading on consumer sentiment rose to 98.2 in December, up both from the preliminary reading of 98 earlier in the month of December and November's final reading of 93.8.
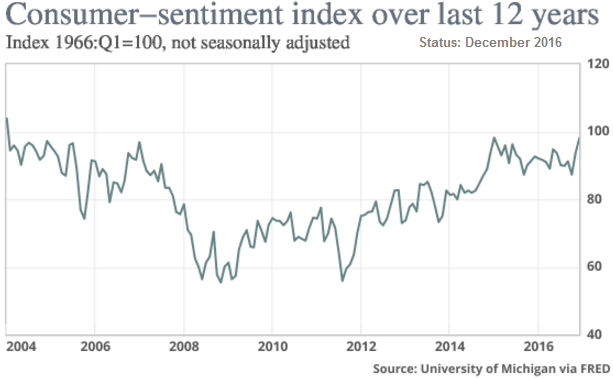
The December reading is the highest since ...
Bank Austria Konjunkturindikator
Mit 1,9 Punkten höchster Wert seit Sommer 2011
Aus dem Bericht habe ich folgende Passagen herausgehoben: "Die Erholung der österr. Wirtschaft gewinnt an Kraft. Der Bank Austria Konjunkturindikator zeigt seit dem Frühjahr klar nach oben."
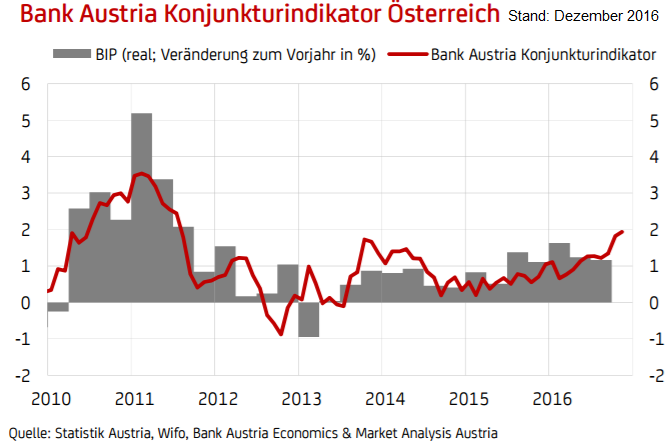
Mit 1,9 Punkten wurde ...
U.S. Economy Briefing (Indicators, Yardeni Research)
Great Long Time Series from Yardeni Research, check out also his blog: http://blog.yardeni.com
Strong relationship between the Weekly Leading Index and the broad stock market (S&P 500)!
This can be clearly seen from 1998 - Dec. 2016:
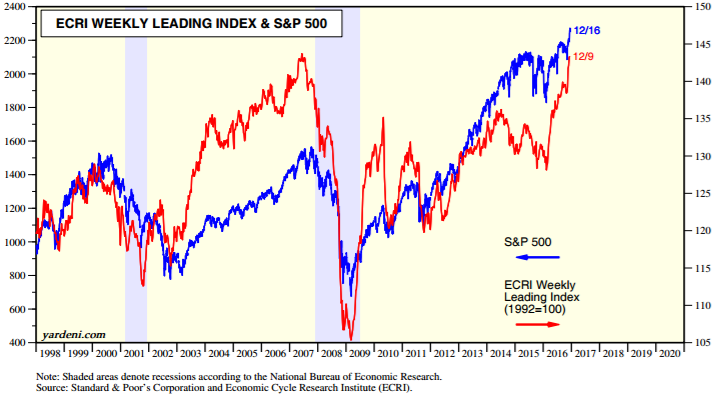
US ...
US-Corporate Profits
(- Q3/2016)
A key measure of after-tax earnings across U.S. corporations rose 5.2% in the third quarter from a year earlier, the Commerce Department reported Tuesday, 29th Nov 2016. That was the first annual increase since late 2014 and the strongest...
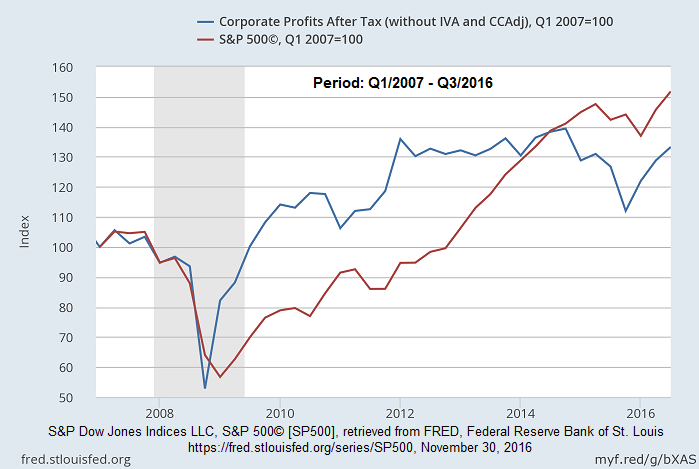
...year-over-year ...
US-Unemployment rate & S&P 500 (inverted / correlation)
(1995 - 2016)
The trend of the unemployment rate and the S&P 500 are highly correlated. The right y-axis scale for the unemployment rate is inverted to better highlight this relationship.
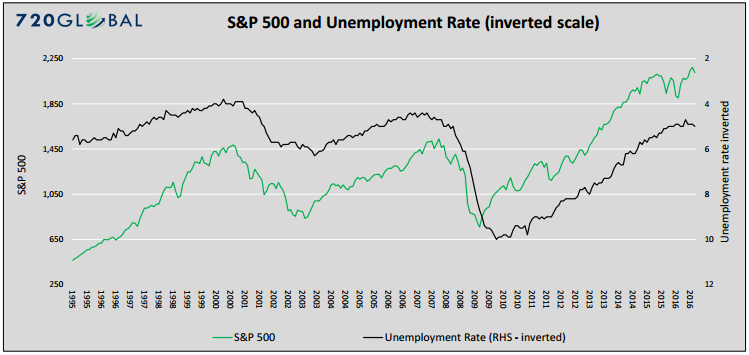 source: www.720global.com/articles-commentary
On ...
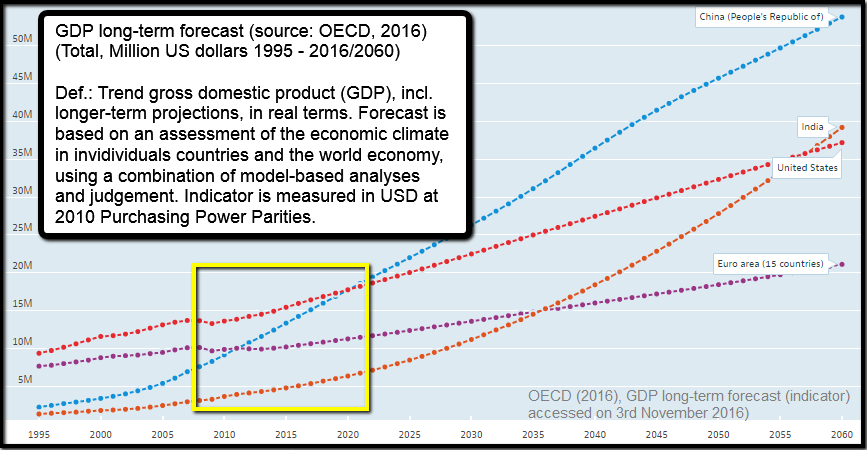
GDP - projections up to 2060 (Status: 2016)
source: OECD
The period from 2008 up to 2015 were turbulent times for the global economy. This can also clearly be seen in the Run-Up of the Chinese economy (in Gross-Domestic-Product terms) versus the so called industrialised countries:
In the ...
ISM versus US-GDP (1995 - 06/2016)
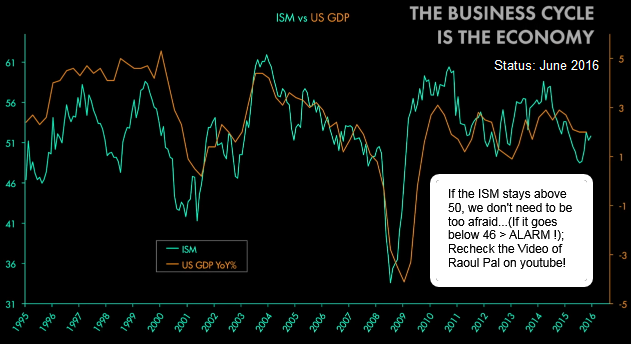
link to the great Video of Raoul Pal: www.youtube.com/watch?v=SDoIbFuKgfU
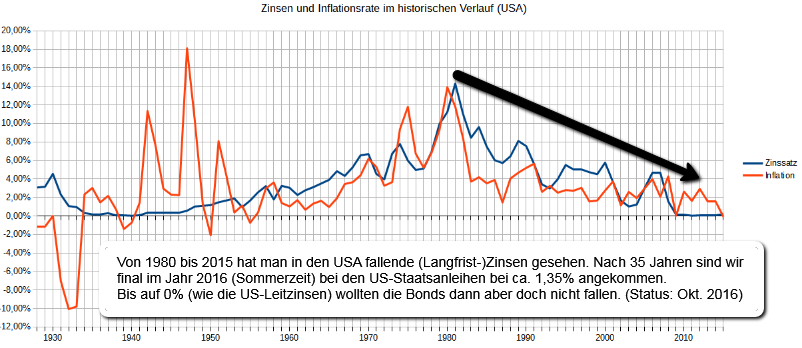
Zinsen & Inflationsrate USA (1800 - 2015)
Wer sich die Geschichte ansieht, versteht die aktuelle Situation besser und kann mit einer realistischen Erwartungshaltung gewappnet auch souveräner damit umgehen. Einleitend der Verlauf der Zinsen und Inflationsrate über acht Jahrzehnte:
 Quelle: ...
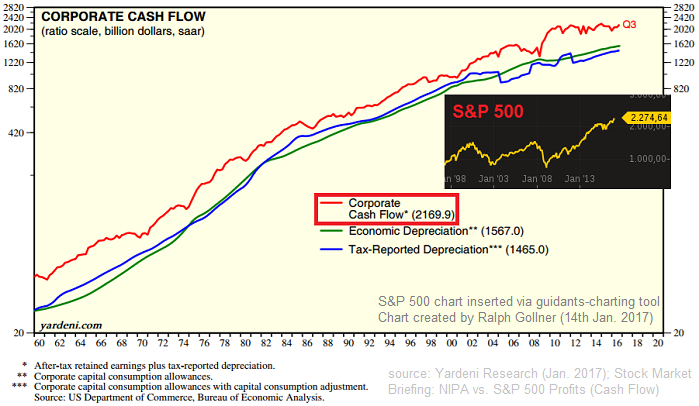
NIPA-Profits (S&P 500-PE-Ratio/"NIPA"/Jeremy Siegel)
Professor Siegel substitutes NIPA data for S&P earnings and produces a metric with higher explanatory power, suggesting that stocks may not be as expensive as previously assumed.
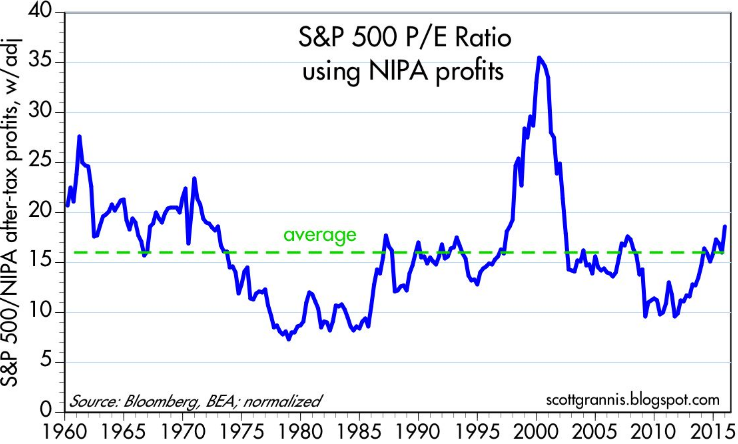
The chart above calculates the PE ratio of the S&P 500 ...
Live-Seminar, Teilnahme möglich am
22. Nov. 2016 (Operngasse 17-21, 1040 Wien, WKO-Gebäude)
ODER
24. Nov. 2016 in Wien (Operngasse 17-21, 1040 Wien)

Vortagender/Seminarleitung: Mag. Ralph Gollner
Tagesablauf/1. Teil (Längere Einleitung/interessante Details)
2. Teil (Die wichtigsten Infos/AUCH ...
Investitionsfalle 2016 (?)
Frage: Wie lässt sich die Nachfrage am Gütermarkt auf das Niveau anheben, das für Vollbeschäftigung notwendig ist? Am einfachsten wäre es, die Zentralbank würde die Zinsen senken und so private Investitionen ankurbeln. Laut Keynes investieren Unternehmen...
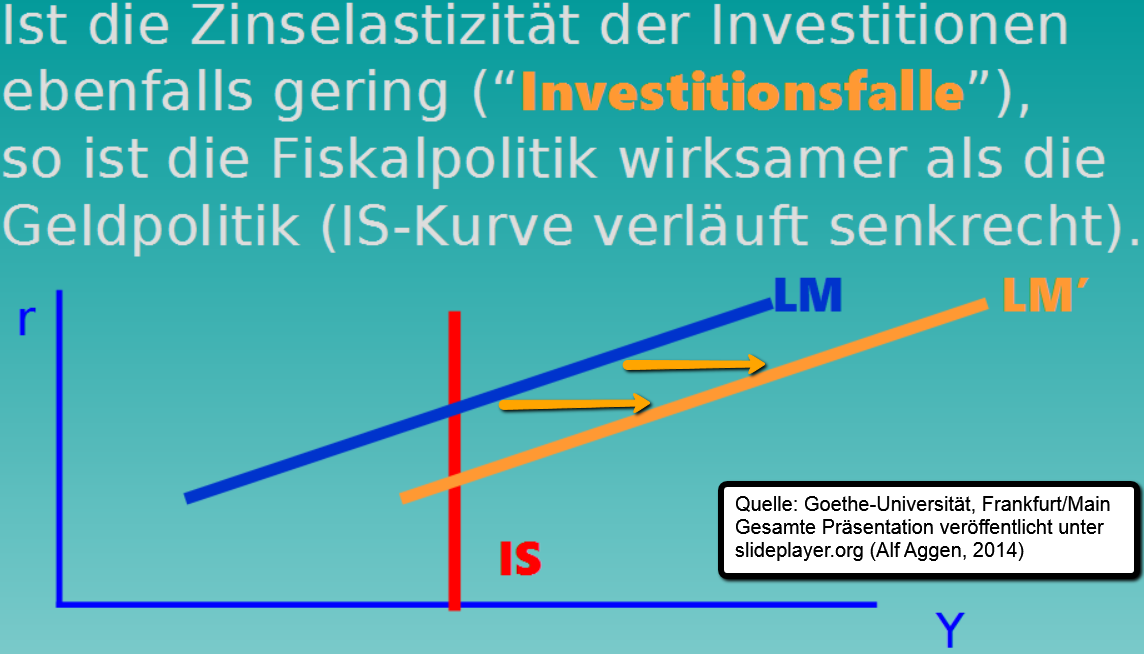
...in ...
Retail Sales In the Euro Area (2011 - 07/2016)
Retail Sales In the Euro Area increased 2.9% in July of 2016 over the same month in the previous year, better than a 1.7 % rise in June and beating expectations of a 1.9 % gain.
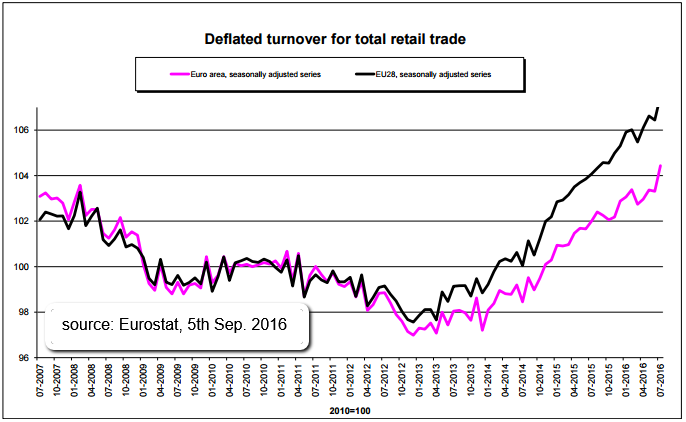
Retail Sales YoY in the Euro Area averaged 1.04 % from 1996 until ...
US-Recessions since 1929 & Stock-Returns
Reminder: Normally, recessions are a fact of life, so we need to get used to them every 4-10 years or so. The following table shows each US-Recession since the late-1920s:
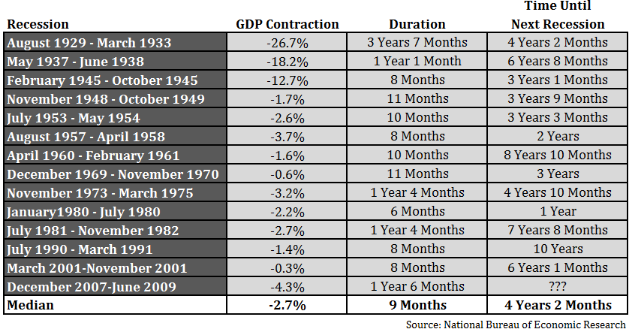
The next logical step from here is to see how stocks performed in and around ...
S&P 500 Forecast (2015, 2016)
The S&P 500, which tracks the biggest U.S.-listed companies closed on Thursday, 31st Dec. 2015 at 2,043 points. It ended the year down 0.73 percent after three straight years of double digit gains.
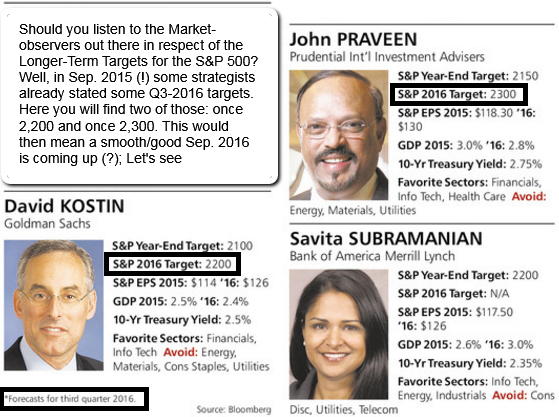
It marks a significant change from the 11.5 percent gain posted ...
Shiller PE (1881 - 2016)
One of the primary weapons that rational bubblers use to back up their case is the Cyclically Adjusted Price Earnings (CAPE), a measure developed and popularized by Robert Shiller, Nobel prize winner...
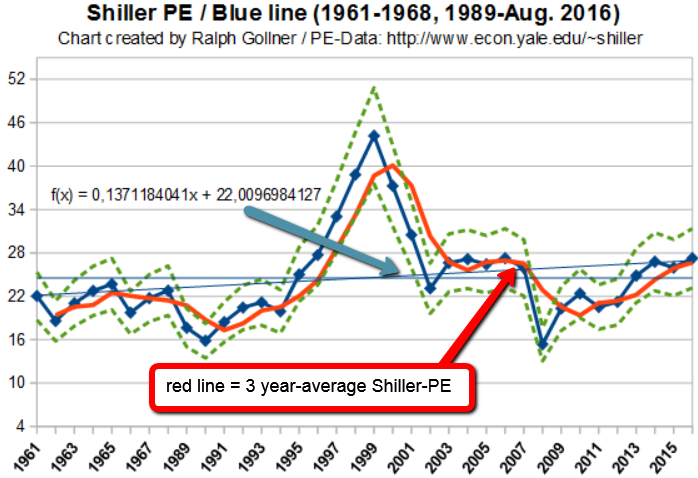
...whose soothsaying credentials were amplified by his calls on ...
CAPE-Ratio vs. T.BOND PE
The current CAPE of 27.27 is well above the historic average of 16.06 and if you buy into the notion of mean reversion, the case makes itself, right? Not quite! (Status: 24th Aug. 2016)
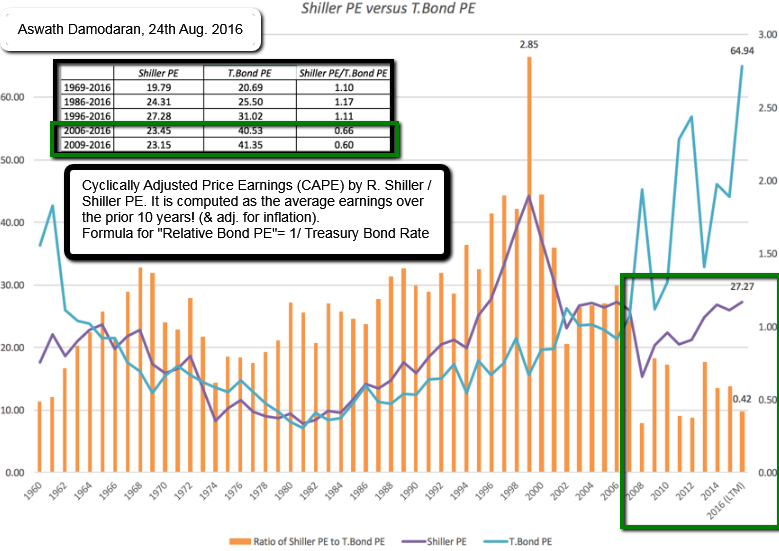
As you can see, even within the CAPE story, there are holes, largely depending ...
S&P 500 (TTM/Trailing Twelve Month Earnings)
There are different sources regarding EPS-figures out there in the market. Here I want to show the EPS-figures, distributed by factset-research. Below following chart I will show then a longterm-P/E-history since 1990.
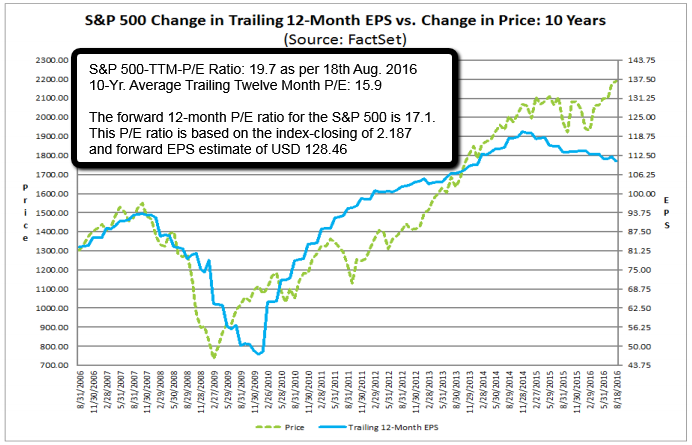 original chart-source: ...
Caixin China General Manufacturing PMI
(PMI = Purchasing Manufacturing Index)
Commenting on the China General Manufacturing PMI™ data, Dr. Zhengsheng Zhong, Director of Macroeconomic Analysis at CEBM Group said: "The Caixin China General Manufacturing PMI came in at 50.6 for July,...
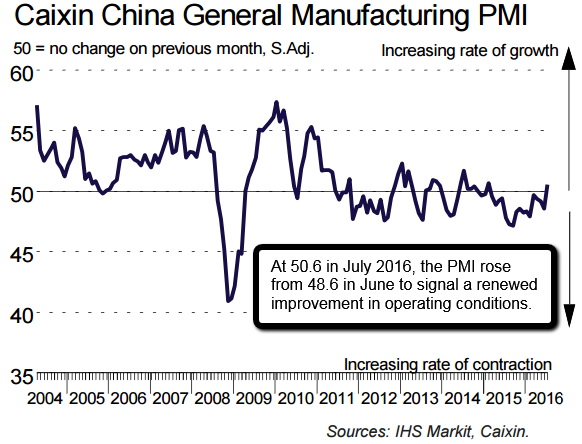
...up ...
S&P500 dividend yield vs. 30-year U.S Treasury bond
On 8th July 2016, the dividend yield on the S&P 500 was higher than the yield on the 30-year U.S Treasury bond for the first time since March of 2009 and this, of course, makes no logical sense at all...
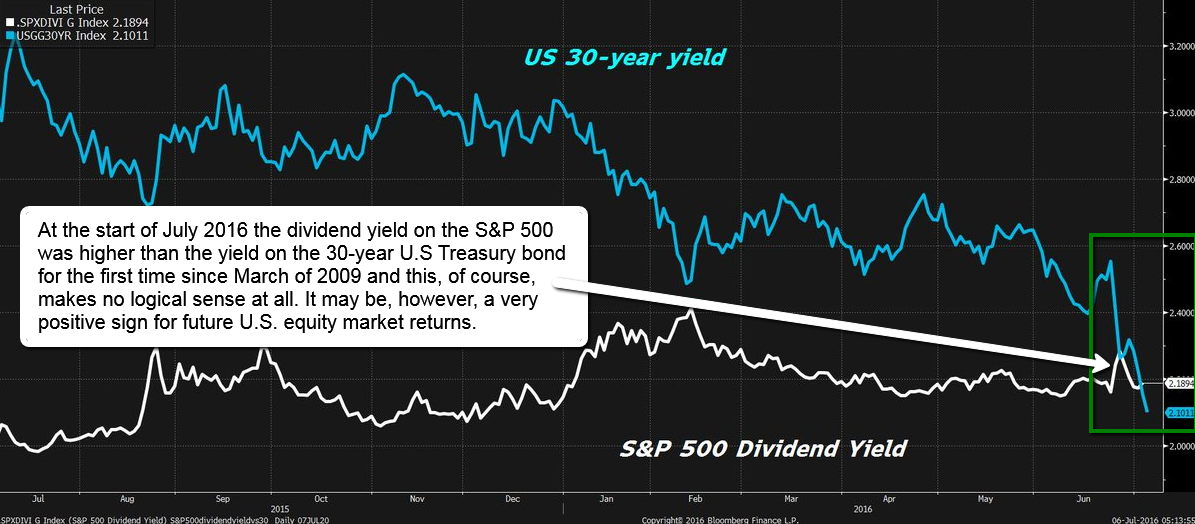
It is, however, a very positive ...
S&P 500, ROE & Price/Book-Ratio
(1999 - June 2016)
Return on Equity (ROE) is now lagging for several quarters. One should highlight in this respect the historical relationship between ROE and the S&P 500-price/book ratio. Investors typically reward superior profitability with...
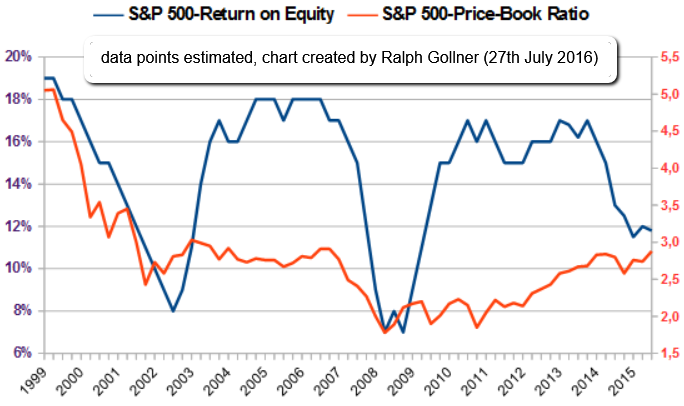
...higher ...
DAX-Kursindex & DAX-Buchwert
(1999 - 26. Juli 2016)
Der DAX-Kursindex hat seit dem Jahr 1999 eine wahnwitzige Berg- und Talfahrt hinter sich. Per 26. Juli 2016 notiert diese DAX-Variante (der DAX-Kursindex) UNTER dem Hoch aus dem Jahr 2000!
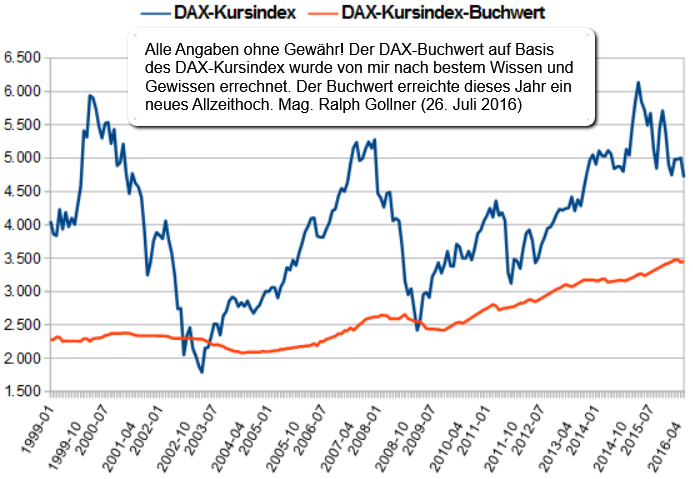
Reminder #1: Die wichtige Unterscheidung zwischen ...
Baltic Dry Index (Snapshot July 2016)
Chart 2007 - 22nd July 2016
Since the Baltic Dry Index débuted, in 1985, economists of all stripes have routinely consulted it as a trusted proxy for trade activity. Based in London, the Baltic Dry Index (B.D.I.) reflects the rates that...
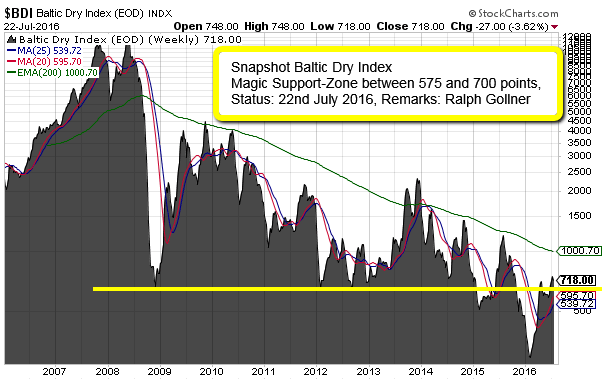
...freight ...
Dax-Kurs-Buchwert-Verhältnis (Juni 2016)
Buchwert-Rückschau: 1996 bis 06/2016
Parallelen 2004, 2010/2011, und auch 2016 (?) bzgl. der KBV-Bewertung im DAX; So ist im Jahr 2010 das KBV für den Dax von 1,50 Richtung 1,30 gefallen (KBV v. 1,3 impliziert aktuell einen floor bei ca. 9.230 im DAX):
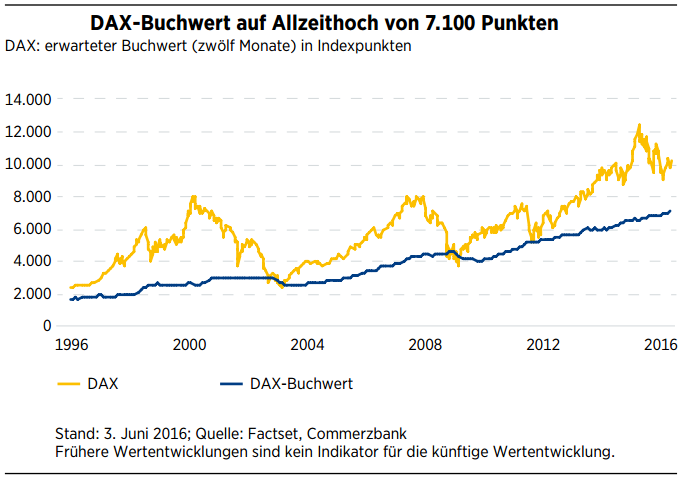 ...
...
UK base rate since 1694
Interest rates in the UK have been maintained today. Find out just how this compares to rates in the past. Interest rates in the UK have stayed at a low level for some time. In fact, they haven't been this stationary for years:
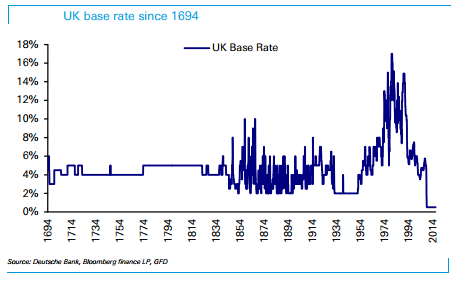
Why do rates matter? Here is some ...
Bremain vs. Brexit Polls (22nd June 2016)
This is just a snaphost of the last 10 individual polls regarding Bremain OR Brexit (Status: 22nd June 2016; CET 11:15):
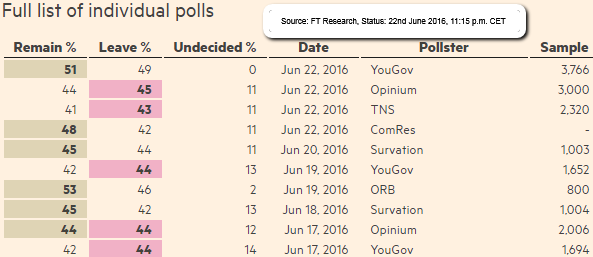
BREXIT-Poll tracker*: The latest developments indicate a REMAIN-camp of 47% versus the LEAVE-camp of 45% (status as per 22nd ...
Rule of 20 (PE of 18.9 reasonable?)
Status: June 2016
Many market commentators have been banging the drum about the stock market being overvalued for a long time and they primarily cite the almighty and high P/E ratio. But there is also the "famous (?) Rule of 20":
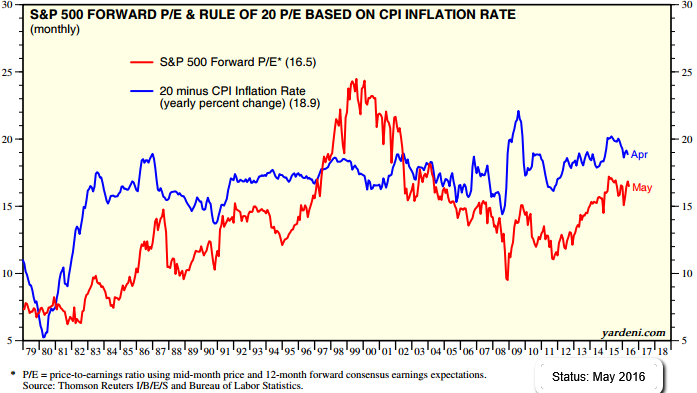
Looking only at the "naked ...
S&P 500 earnings (actuals & estimates, I/B/E/S)
Thomson Reuters
The current earnings estimates for the S&P 500 are more or less near the actual earnings in 2014. The index is also more or less near the level, the stock-barometer reached 18 months ago...
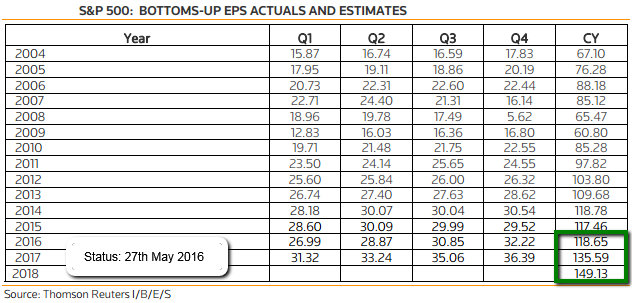
link (.pdf), 27th May 2016: ...
The Fed Model
The basic theoretical idea behind the model is simple. An investor faced with buying bonds or equities might choose between a 10-year U.S. Treasury yielding, say 5%, or buying an equity with an earnings yield (earnings/price) of 5%.
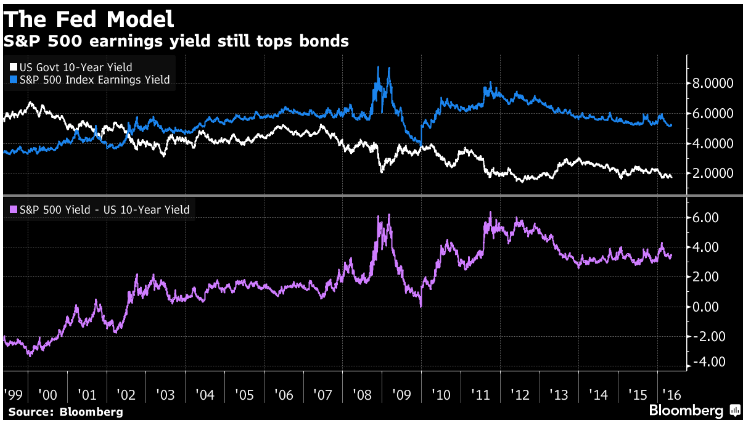
Roughly speaking, when the Treasury yield is ...
GDP-Growth for Everyone (Poverty)
The world has an astonishing chance to take a billion people out of extreme poverty by 2030. In 1990, 43% of the population of developing countries lived in extreme poverty (then defined as subsisting on $1 a day); the absolute number was 1.9 billion people.
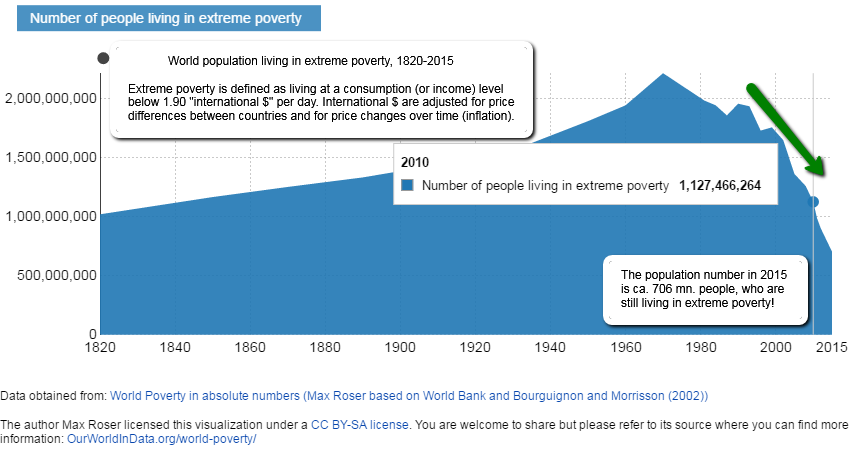 ...
...
Economics-update U.S.A.
Capacity Utilization in the United States averaged 80.41 percent from 1967 until 2016, reaching an all time high of 89.4 percent in January of 1967 and a record low of 66.89 percent in June of 2009. Maybe some stabilsation now?!
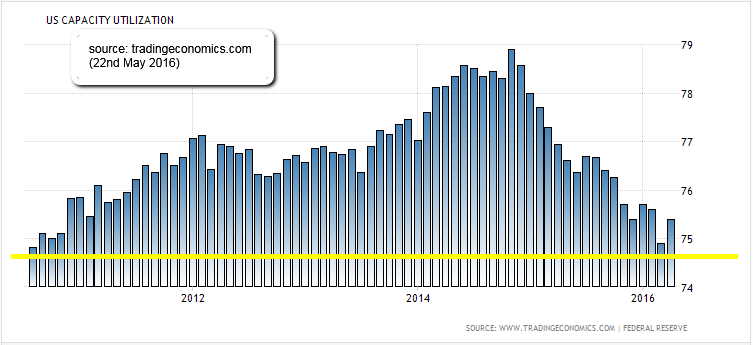
As can be seen in the graph above, ...
EPS and S&P 500
(Earnings and the broad US-Stock Market)
Nobody knows why markets move as they on a day-to-day or month-to-month basis. But long-term returns hinge on earnings-per-share (EPS) growth & dividends, as can be seen below. "It's not the economy, stupid", but the earnings-per-share.
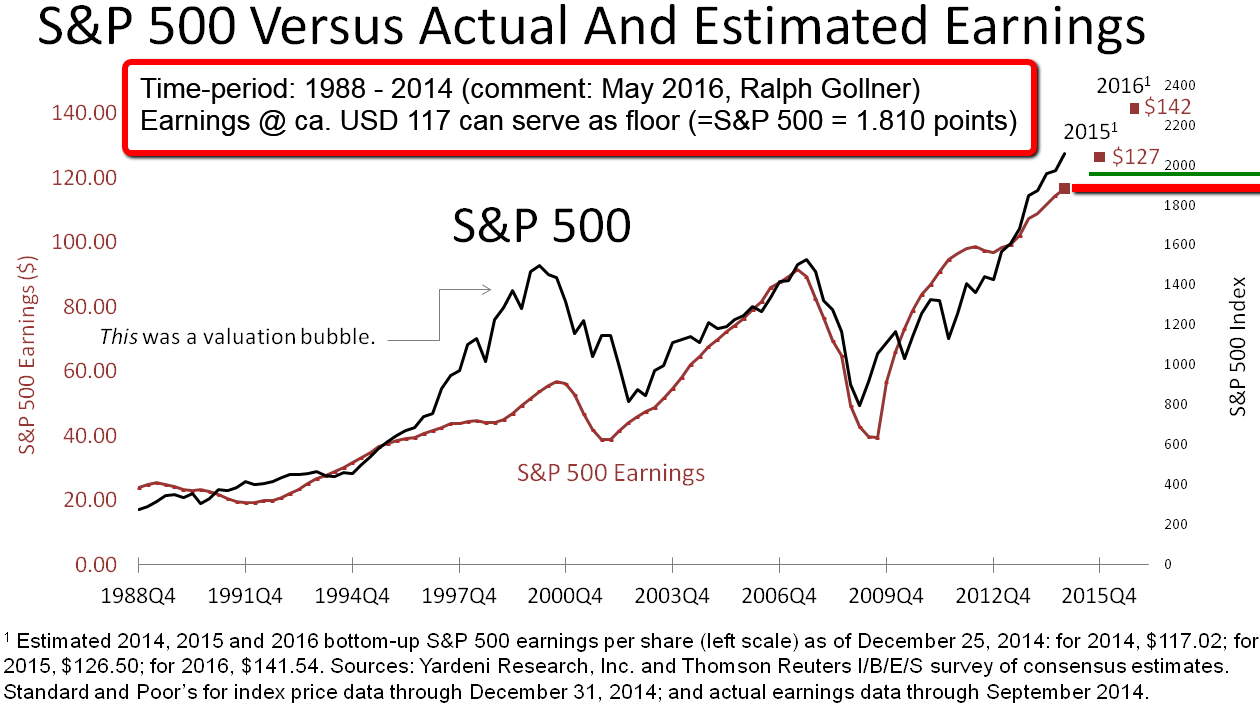 ...
...
Berkshire Hathaway (P/B-Valuation)
time period: 2000 - May 2016
In his book "One Up on Wall Street", Peter Lynch, maybe the best mutual fund manager ever, revealed a powerful charting tool that helped him to achieve a gain of 29.2% in his portfolios for 13 years.
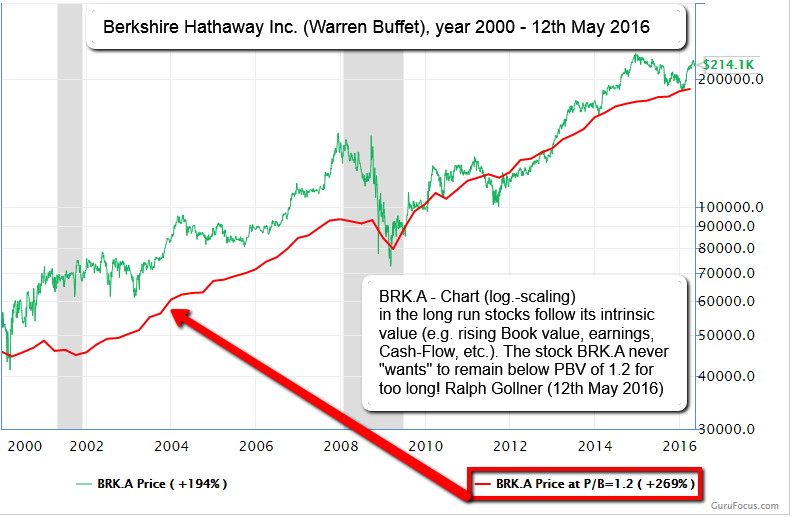
In his chart, Peter Lynch ...
US Media Ad Spending (2014-2020)
Next year (2017) will mark a major milestone for ad spending, as total digital surpasses TV for the first time. In 2017, TV ad spending will total USD 72 billion, or 35.8% of total media ad spending in the US.
 source: eMarketer’s newest quarterly ad spending ...
Banking Stocks (US)
Banks are the backbone of every economy. It is very important that banks remain healthy financially, otherwise a financial crisis can hit a country leading to a recession like the US in 2008.
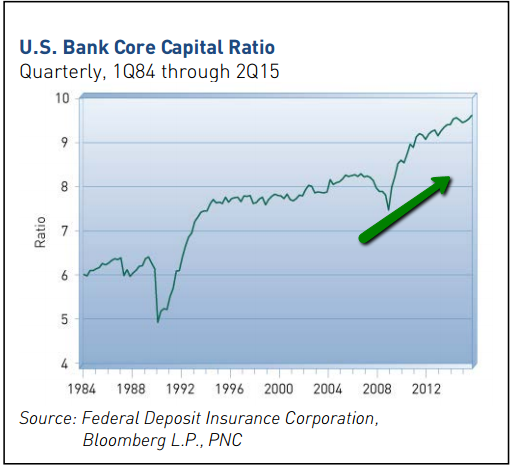
"The banks are the lifeline of the economy and play a catalytic role in ...
Default Rates US-Consumer
(2010 - 2016)
Some years ago S&P Indices launched an index series designed to provide an insightful gauge into the financial health of the American consumer. In the following chart I gathered the two-month interval data showing the improvement since Q4-2010:
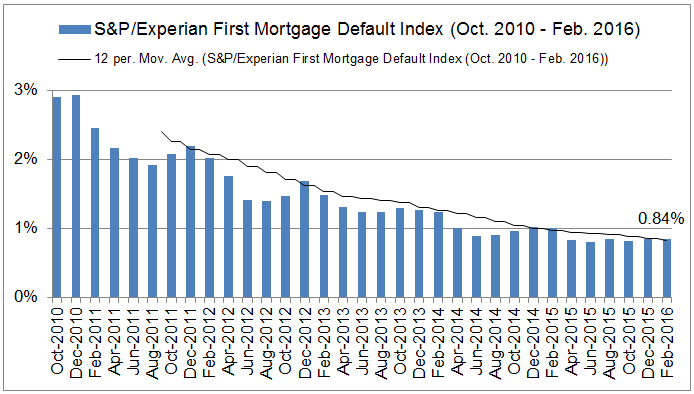
...
Monopoly - lessons
Charles Darrow of Philadelphia developed the game in 1933 and sold it to Parker Brothers on 19th March 19 1935.
Following its 81st birthday here are some lessons monopoly teaches us about Finance and Investing.
Monopoly has been a classic board game for decades. It's a real ...
Austrian Economics
(Definition)
It is the School of economic thought originating in Austria in the late nineteenth century which focuses on the concept of opportunity cost. Following some confronting views of Keynesian Economics VERSUS Austrian Economics:
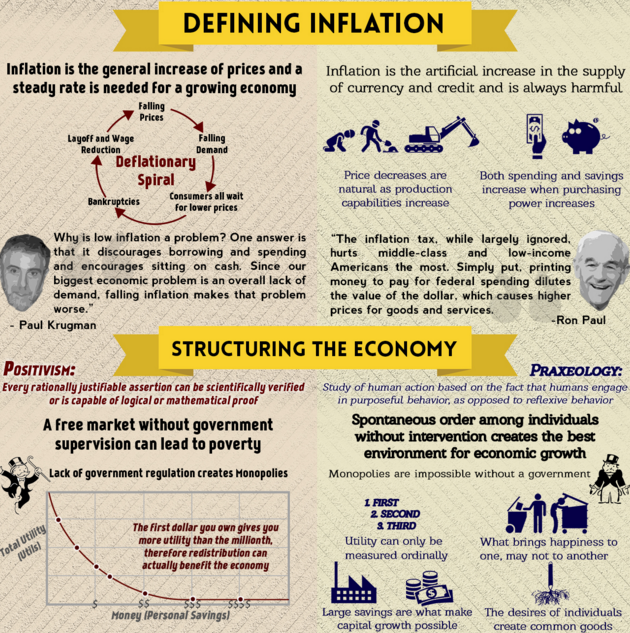 source: ...
Valuation NYSE / Morningstar Tool
A ratio below 1.00 indicates that the Index-level is lower than Morningstar's estimate of its fair value. The further the price/fair value ratio moves below 1.00, the more the median stock is undervalued.
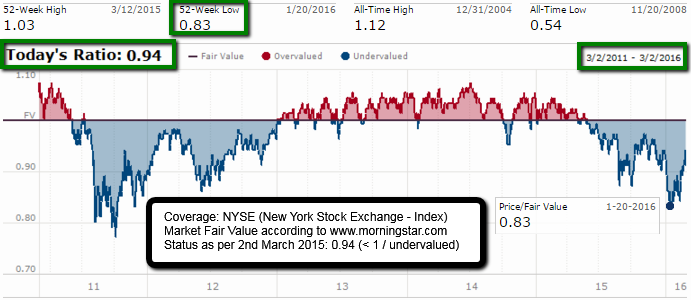 source: http://www.morningstar.com
Magic Formula Investing (Joel Greenblatt)
Joel Greenblatt recommends buying a portfolio of 20-30 Magic Formula stocks, holding for one year, and then re-running the process annually. Check out the Internet-site provided by Joel Greenblatt (s. screenshot/picture below).
 picture/source: ...
Shiller-KGV & Gewinnpotential (Jan. 2016)
Wer bei einem Shiller-KGV von weniger als zehn in Aktien einsteigt, streicht in den folgenden zehn bis 15 Jahren im Mittel eine Rendite von 12,3 % p.a. ein. Bei einem KBV von < 1,0 sind sogar Renditen in Höhe von gut 14 % pro Jahr drin.
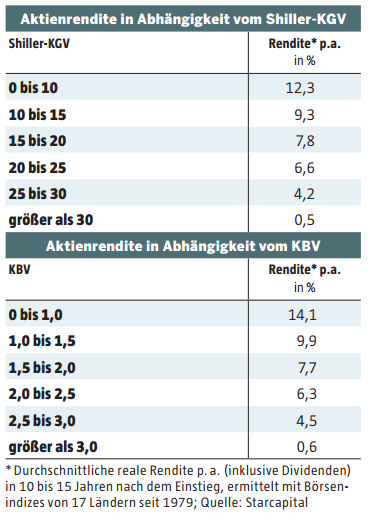
Sind ...
Abweichung vom "Gewinn-DAX"
Abweichung vom MEDIAN-Gewinn-KGV
Die Grenze der gerade noch typischen Unterbewertung im DAX liegt per Feb. 2016 bei ca. 9.100 Punkten; Historisch schwankte das DAX-12-Monats-Forward-KGV zwischen 7,6 im Tief und 32 im Hoch (Fehlbewertungsgrenzen im folgenden Chart):
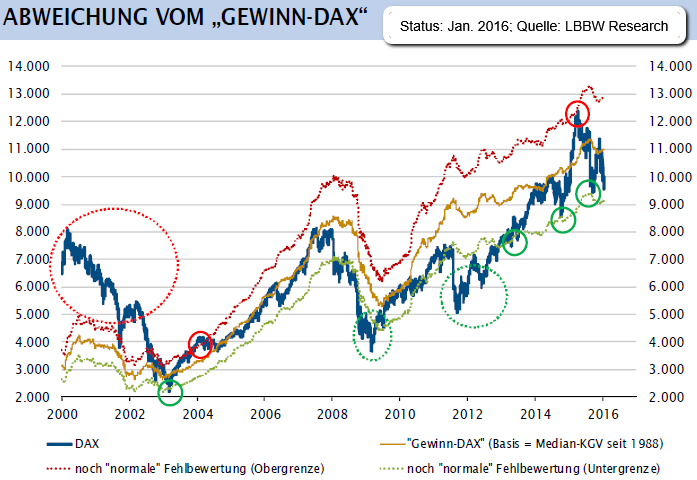 ...
...
Price-Book-Value S&P 500 (history up to Aug. 2015)
Some investors put more "faith" in the Price/Book Value ratio than the P/E ratio when assessing the valuation of stocks or the stock market as a whole. As a result, Forbes conducted a historical review of Bloomberg data for the S&P 500.
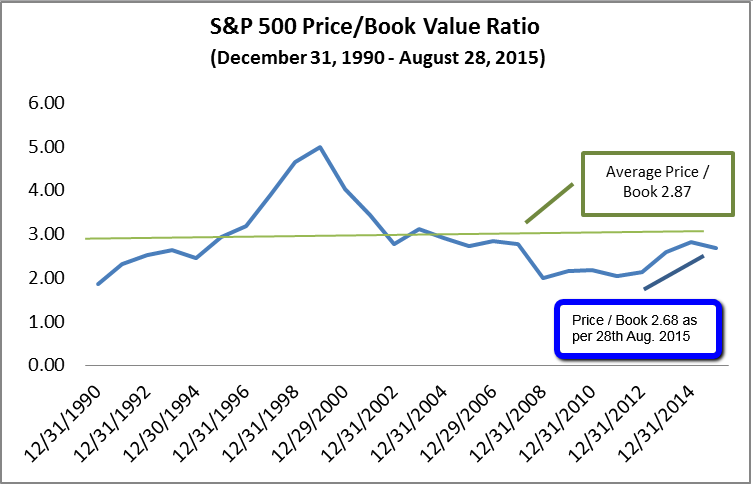 ...
...
Shiller PE-Ratio (Feb. 2016) vs. S&P 500/Market Timing
Following the idea of a valuation-based market timing-model and tactical asset allocation models based on the Shiller PE ratio (PE10), the following model was tested for the time period 1988 up to 2015 (versus the S&P 500):
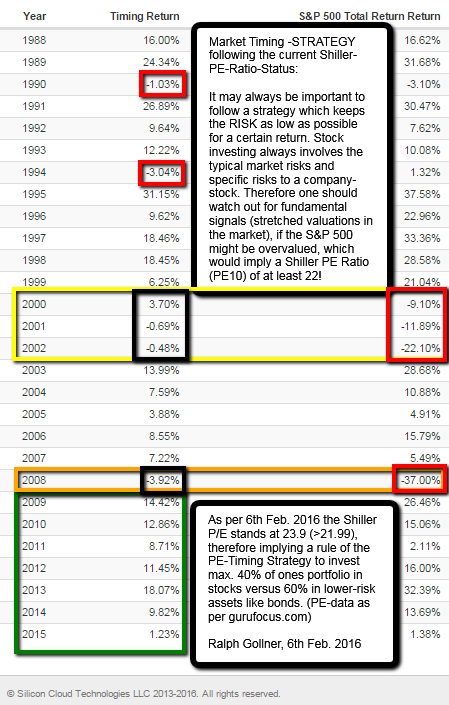 The ...
China/Yuan (CNY), Feb. 2016 (FX-Reserves)
Société Générale, using the International Monetary Fund’s rule of thumb on reserve adequacy, estimates that China’s foreign-currency reserves are at 118% of the recommended level.

But that cushion (my word creation:) MIGHT evaporate soon on a ...
PMIs GLOBAL (Jan. 2016)
Global PMI-Status; Out of 42 countries/regions 29 countries carry a PMI reading > 50 (pos. reading), 29/42 = 69%**. Be aware, that also the Euro Area is also counted as a country/region, emphasising the importance of the European region as a whole!
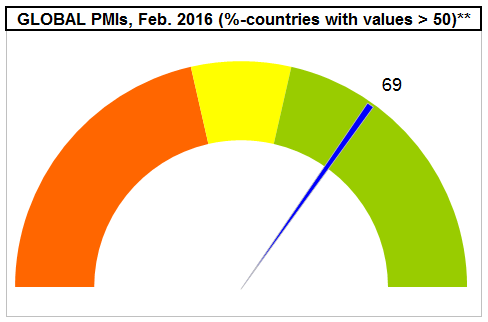
Definition of ...
Inflation oder Deflation (Jan. 2016)
Die Frage der Fragen; Noch hat Keiner einer "sichere" Antwort, was die Jahre 2016 und 2017 bringen werden...
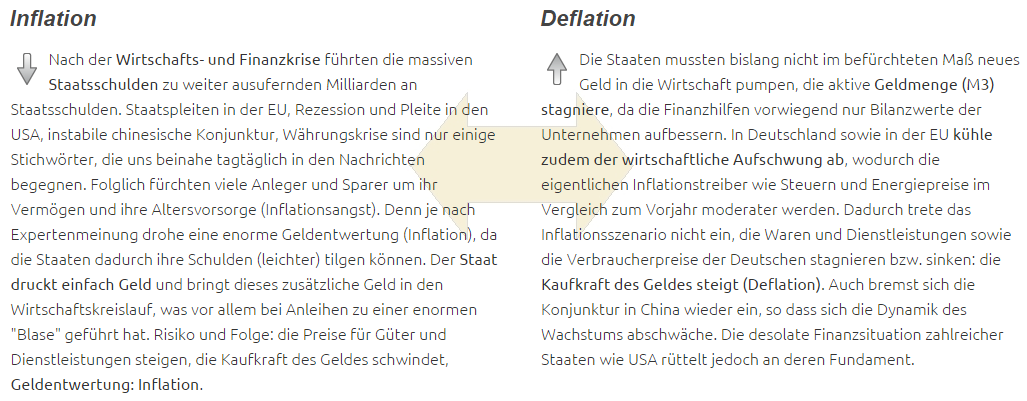
Quelle: http://www.inflation-deflation.de
Eine aktuelle Übersicht die Preisentwicklung von Gütern (Deutschland): ...
Global Exports
The following table shows revised trade projections for 2015 and 2016, which depend on consensus estimates of world real GDP growth at market exchange rates. Important to know, that EM-exports tend to correlate with returns from EM-investments:
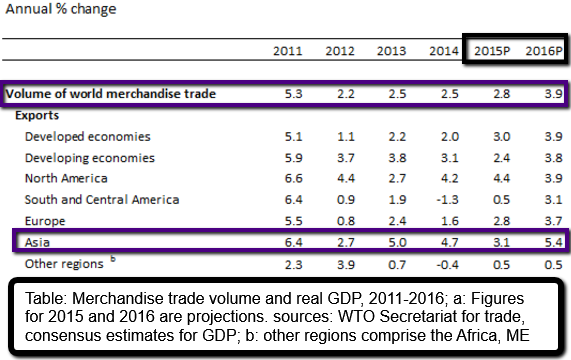
The WTO now expects world ...
Valuation CAPE & Price-Book as per 31st Dec. 2015 (Selected global markets)
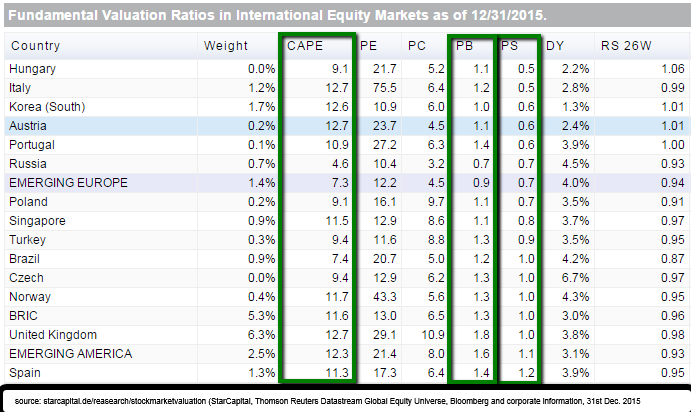
direct link: http://www.starcapital.de
In a most recent article (Bloomberg, as per today: 21st January 2016) it was mentioned that Hong Kong stocks fell below the value of their net assets for the first time since ...
Industrial Production December 2015
Industrial Production in the United States decreased 1.8 percent in December of 2015 over the same month in the previous year, following a 1.2 percent fall in the previous month. The drop in November 2015 was the first drop since December of 2009...
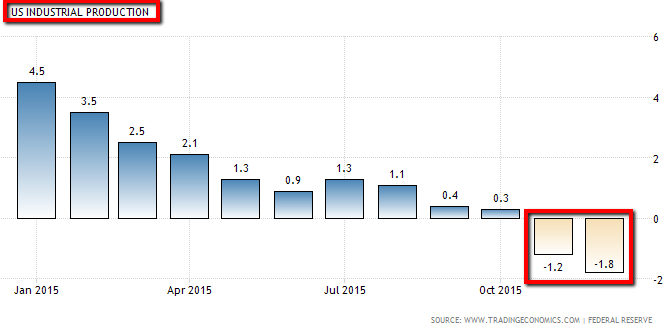
To ...
Industrial Production November 2015 (versus S&P 500)
Industrial Production in the United States decreased (!!) 1.2 percent in November of 2015 over the same month in the previous year. It is the first drop since December of 2009...

..as mining output fell 8.2 percent and utilities went down ...
US-GDP versus US-Stock Market (Atlanta FED)
The Stock Market ist discounting future expectations, therefore I should be more specific; US-GDP-expectations for the 4th quarter 2015 versus the US-Stock Market evolution since Nov. 2015 up to 5th January 2016:

S&P 500 (SPX) & (RUT) Russel 2000 ...
Welthandel (2015 bis 2050!)
Experten gehen davon aus, dass das globale Handelsvolumen (per 2015) sich bis zum Jahr 2050 vervierfacht. Das entspräche einem Anstieg auf 68,5 Bio. US-Dollar pro Jahr.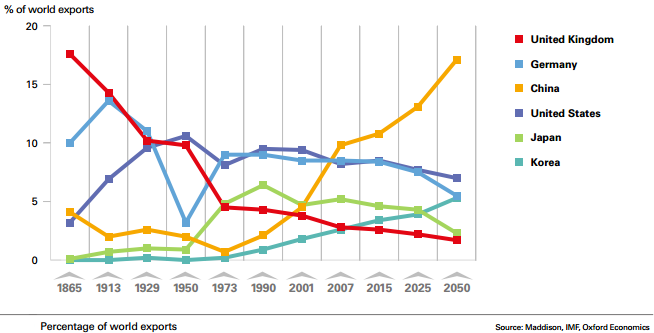
Die Marktanteile von Deutschland und USA werden nachlassen, jener Marktanteil von China dafür ...
Industry Trend (Online Sales)
Following chart says that you've probably shifted a lot of your retail shopping to the web, whether you're in the U.S., China, or the U.K...(If you are an investor, you may also want to focus on LONGTERM-INDUSTRY-TRENDS!)
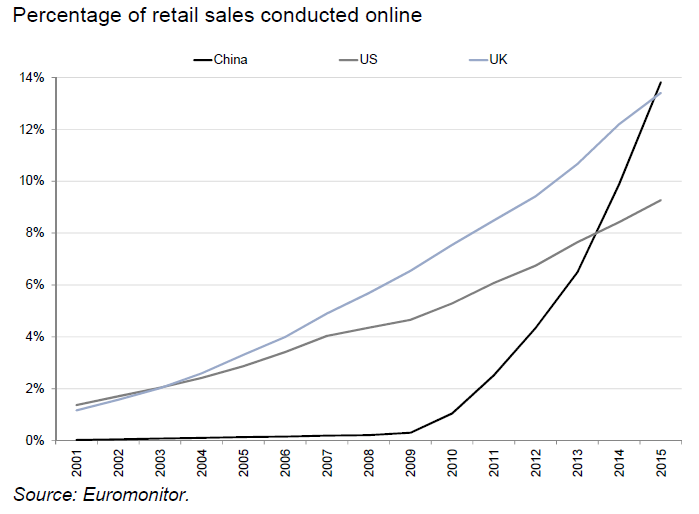
source: http://www.bloomberg.com
Since ...
Tobin's Q
Diese Variation der Buchwertanalyse wurde 1969 vom Yale-Ökonomen und Nobelpreisträger James Tobin entwickelt.
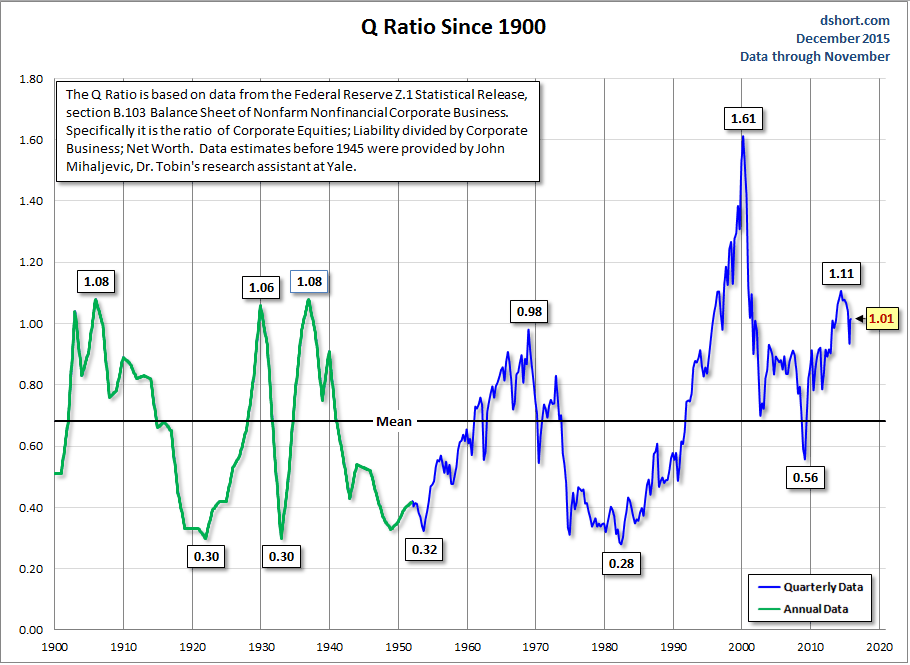 http://www.advisorperspectives.com
Die Tobin’s Q-Ratio stellt den Unternehmenswert (Enterprise Value, EV, einfach definiert als Börsenkapitalisierung plus Nettoschulden) ...
Valuing Wall Street: Protecting Wealth in Turbulent Markets (Book on q ratio)
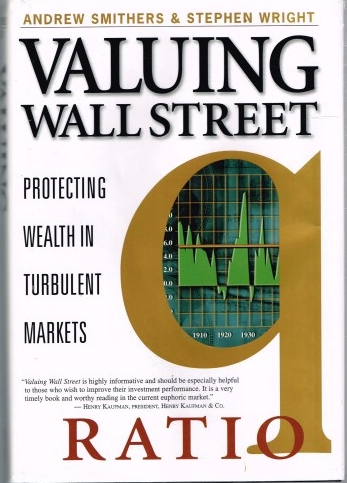
When Valuing Wall Street was published in March 2000, the following statement was set out on the cover of the book:
"The U.S. stock market is (was in the year 2000) massively overvalued. As a result, the Dow ...
US-Stocks (Valuation-History up to 2015)
Price/FCF historical average (1986 - 2015) / Average EXCL. Tech Bubble: 24.8 (Valuation as per Feb. 2015: 23.3);
It may also be of interest to know, that the S&P 500-Index stood slightly above 2,100 points on the 27th Feb. 2015.
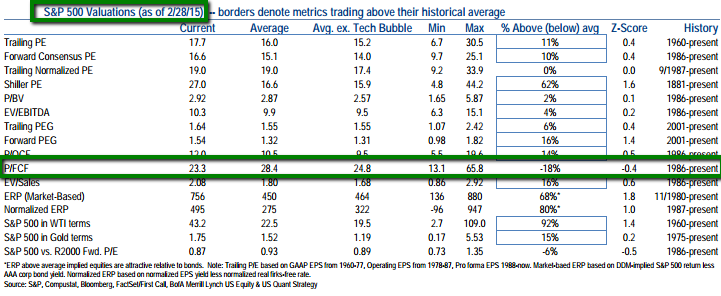 source re. ...
Welthandelsindex (2 Quellen), per Q3/2015
Um das globale Wirtschaftswachstum und die globalen Wachstumsaussichten einschätzen zu können,...
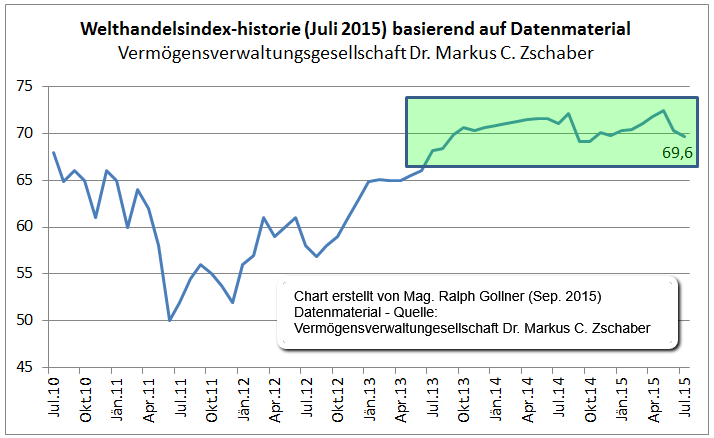
...bedarf es einer Aggregation von Informationen und Interdependenzen der globalen Wirtschaftsströme, siehe z.B. den Welthandelsindex der ...
China Purchasing Manager Index (PMI, 31st Aug. 2015)
China manufacturing sector is losing steam; Activity in China's manufacturing sector slowed markedly in August 2015, the latest sign that the world's second largest economy is fast losing momentum.
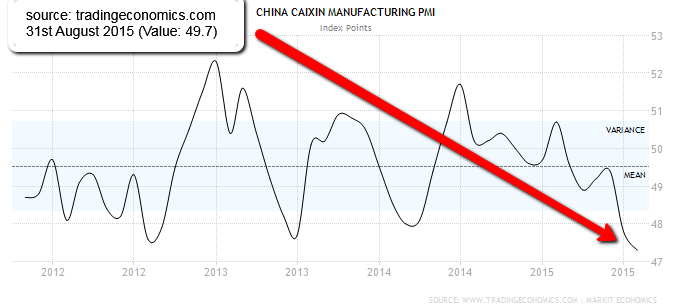
source: ...
S&P 500 up ca. 59% since the last GOLDEN CROSS (x-over SMA50/SMA200), Status as per ME July 2015
But what comes up to mind is then the question about what defines a so called "Golden Cross"? Let's recap history for that matter:
In January 2012 (more than 3 years ago ;-) Birinyi Associates has ...
NASDAQ-100 July (2015)
If one leaves aside the Efficient Market Hypothesis and knows about seasonal patterns, July may be an interesting month for NASDAQ (-100) – Investors.

According to the statistics from equityclock.com over the last 20 years (up to Dec. 2014) following historic averages ...
United States ISM Purchasing Managers Index (PMI)
Business Confidence in the United States remained unchanged at 51.50 percent in April of 2015. Business Confidence in the United States averaged 52.79 percent from 1948 until 2015, reaching an all-time high of 77.50 percent in July of 1950 and ...
2015-Kursverlauf sollte positiv enden (lt. Historie)
SeasonalCharts (.de) offeriert in der Rubrik 4-Jahres-Wahlzyklus nicht den saisonalen Verlauf während eines Jahres, sondern einen Zyklus über vier Jahre. Zu jedem Markt gibt es dabei fünf Charts. Zum einen den Wahlzyklus-Chart, der den ...
Definition of "Dow Jones Transporation Index - DJTA"
A price-weighted average of 20 transportation stocks traded in the United States. The Dow Jones Transportation Average (DJTA) is the oldest U.S. stock index, compiled in 1884 by Charles Dow, co-founder of Dow Jones & Company.
The index ...
Aus rein statistischer Warte müsste das Aktienjahr 2015 grandios werden.
Jahre, die auf fünf enden, also beispielsweise 2005, 1995, 1985 usw., waren in der Vergangenheit oft Jahre mit einer herausragenden Performance. In den letzten 130 Jahren gab es nur zwei Jahre, die eine geringere Rendite ...
Artikel von April 2007 / Das Jahr 2007 ist ein besonderes Jahr:
Es ist das dritte im amerikanischen Präsidentschaftszyklus. Das Besondere? Dritte Jahre sind fast immer sehr ertragreiche Jahre. Erst 2008 wird der nächste US-Präsident gewählt. "Dritte Jahre" sind signifikant ertragreicher als ...


