Related Categories
Related Articles
Articles
Price-Book-Value S&P 500 (history up to Aug. 2015)
Some investors put more "faith" in the Price/Book Value ratio than the P/E ratio when assessing the valuation of stocks or the stock market as a whole. As a result, Forbes conducted a historical review of Bloomberg data for the S&P 500.
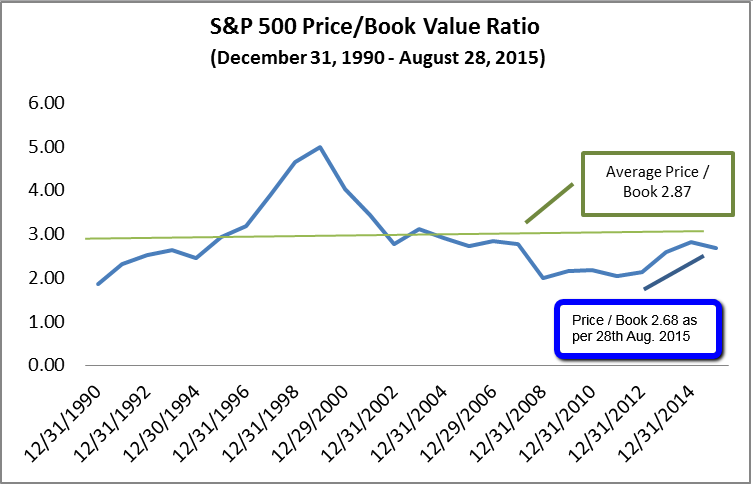 Source: Bloomberg, 28th August 28, 2015. Past performance is not indicative of future results
The average Price/Book Value ratio of the S&P 500 for the period December 1990 - August 2015 is 2.87 (according to the mentioned Forbes-article). The Price/Book Value ratio of the S&P 500 as of 28th August 28, 2015 was 2.68 at a S&P 500 level of ca. 1,985 points (history-quote taken from finance.yahoo.com).
If one looks at the current S&P 500 level of ca. 1,860 (10th Feb. 2016, CET 6:00 p.m.) one arrives at a PBV-ratio of 2.51! (which would be below the ratios between the period 2002 - 2007, or below last years' 2.87 reached in March)
Taking another source (status 4th Dec. 2015; Commerzbank calculations), they arrive at a PBV-ratio of 2.66 at an Dec. 2015/S&P 500 -Level of 2.092 points. Commerzbank-calculations also mention the 10years-average regarding the PBV of S&P 500, which should be at 2.25 (calculated from Dec. 2015 backwards). I just wanted to mention this info, since there may never be two different sources giving the same exact valuation results (due to timing of calculation, data-interpretation, etc.).
♦ Taking the Forbes data-source into account, one may think that the current S&P 500 level represents a discount to the 25 year average (Forbes-data: 2.51 versus 2.87) as per 10th Feb. 2016.
The PBV, calculated by the site: http://www.multpl.com also arrives at a current valuation (10th Feb. 2016) of 2.51.
Reminder: As per March 2015 the PBV-ratio of the S&P 500 stood (according to multipl.com) at 2.84!
It should be noted, that in the years 2002 up to 2007, the PBV-ratios of the S&P 500 were following as per 31st Dec. (Year-End, source: multipl.com):
2007: 2.77
2006: 2.81
2005: 2.76
2004: 2.92
2003: 3.03
2002: 2.73
I excluded the valuation ratios in some years before, because (to my point of view), the valuation-ratios in the years 1999 and 2000 made "no sense"...(irrational exuberance).
sources:
http://www.forbes.com
http://zertifikate.commerzbank.de


