Related Categories
Related Articles
Articles
Valuation (PE-Ratio)
Nasdaq-100
Despite the Index's solid gains in recent years, this has been often matched by growth in forward earnings - such that the forward PE ratio up until the year 2016 had barely changed. In 2017, however, price gains have exceeded...
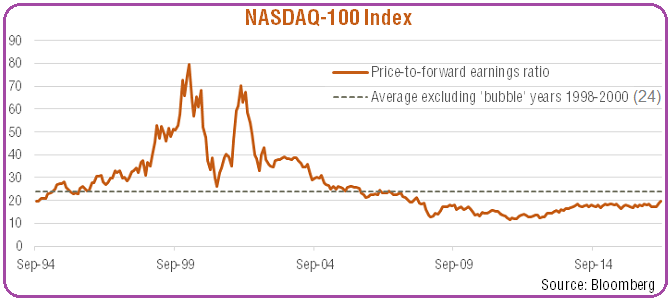
...gains in earnings - such that the forward PE (Price-Earnings) ratio has increased from around 18 in the year before 2017 to ca. 21 by now, July 2018. But it is important to mention that this remains below the market's long-run average (since the mid-1990s) of 27.4. Even stripping out the "bubble" years of inflated PE valuations between 1998 to 2000, the average PE drops to 24 over this period. In other words, even today, the NASDAQ-100's PE valuation is below its long-run average (despite the still -relativelly- low level of bond yields).
As per Friday, 13th July 2018, the PE-Ratio (Valuation) of the Nasdaq-100 was ca. 21.36 (based on Forward Earnings, Birinyi Associates, Site: The Wall Street Journal).


