Related Categories
Related Articles
Articles
Shiller PE-Ratio (Feb. 2016) vs. S&P 500/Market Timing
Following the idea of a valuation-based market timing-model and tactical asset allocation models based on the Shiller PE ratio (PE10), the following model was tested for the time period 1988 up to 2015 (versus the S&P 500):
 The underlying logic for tactical strategy shifts is the current market valuation/Shiller PE Ratio (PE10) which leads to the dynamic allocation between stocks and bonds (1) 40% vs. 60%, (2) 60% vs. 40%, or (3) 80% stocks versus 20% bonds.
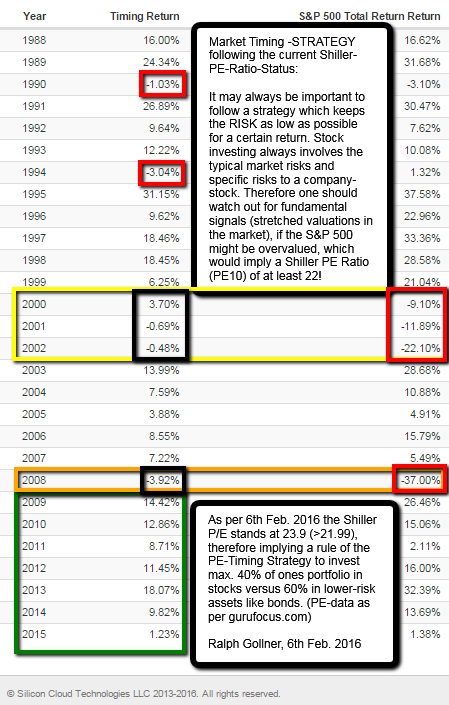
♦ (1) If PE10 >= 22, then the portfolio allocation shall be 40% stocks, 60% bonds (current status as per Feb. 2016)
♦ (2) If PE 10 should be higher than 14 <= PE10 < 22, then the allocation shall be 60% stocks, 40% bonds
♦ (3) If PE10 < 14, then the subsequent allocation shall be 80% stocks, 20% bonds
The Market timing results in the series/picture above give the annual returns from 1988 to 2015 based on the Shiller PE10 ratio market valuation-Strategy. The timing portfolio adjusts the stock and bond allocation of the baseline 60%/40%-stock/bond portfolio annually at the start of each year based on the Shiller PE10 ratio.
Performance statistics for the PE-ratio-Market timing portfolio:
♦ Portfolio Initial Balance (year 1988) of USD 10.000 would have led to a balance of ca. USD 139.000 by the year 2015
♦ CAGR would have been 9.85% (comp. average growth rate per year)
♦ Best year was +31.15%
♦ Worst year was -3.92% (nice for private investors...)
Recap/Currently the model is set on the lowest of the three allocation models since already January 2014 (40% stocks/60% bonds); Currently the uncertainty in the market (China, FED-interest rate hike) seems pretty high so I would set the stocks-level maybe even lower than the 40% bound...(short-term-idea).
The best positive streak on record (data rechecked/backtested down to the year 1950!) was:
♦ from Jan. 1974 up to Dec 1986 (156 months in a row!), allocation idea set by the model was 80% stocks/20% bonds
♦ performance in that 156-months period was +376.58%
source for model-calculations:
https://www.portfoliovisualizer.com
http://www.gurufocus.com


