Related Categories
Related Articles
Articles
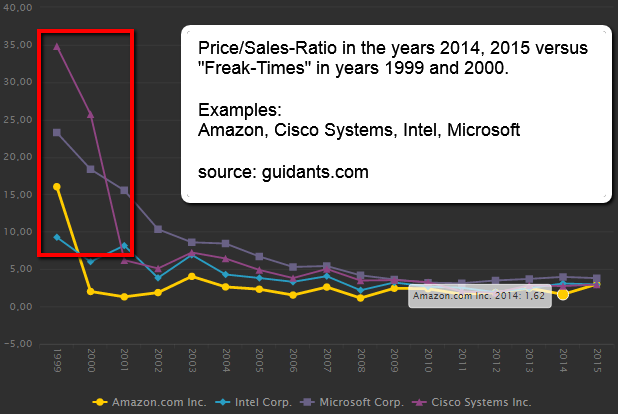
Price-Sales-Ratio (P/S-Ratio)
1999 vs. 2015
Morgan Stanley's Adam Parker comments on valuations regarding Tech-Stocks. Parker looked a little below the surface in a research note and shared a key difference between the stock markets in 2014/2015 and the dotcom bubble of the 1990's.
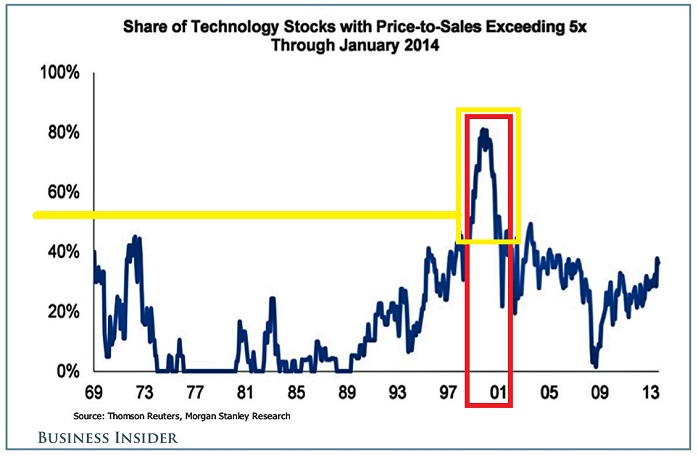
"About 40% of all technology stocks have price-to-sales levels above 5x in the year 2014, 2015, levels seen briefly during the early 1970s but otherwise only during the internet bubble buildup and unwind," he noted.
Because the high-flying tech stocks of the dotcom bubble had no earnings, investors looked to the price-to-sales ratios. Parker dug even deeper. "Most of the highly priced stocks are not the mega caps that dominated the expensive spectrum during the internet bubble," he wrote.
This is not to say there aren't overpriced tech stocks that could crash. Rather, they just don't account for as big a share of the market as they did in the past.
links from the years 2014:
www.businessinsider.com/dotcom-stocks


