Related Categories
Articles
VDAX New
Vola(tilität) - DAS ANGSTBAROMETER
VDAX New bei 70
Hektische Zeiten im DAX
Euphorie, Kapitulation. Nur wenige Wochen liegen mittlerweile (per 12. März 2020) zwischen diesen Gefühlswelten, und nichts fängt die verschiedenen Gefühlslage der Börsianer besser...
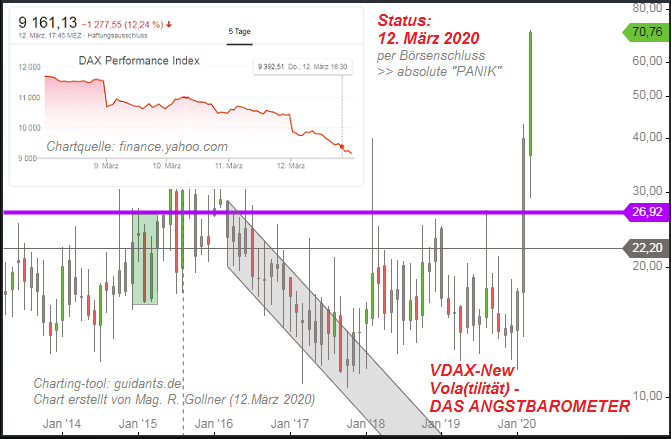
...ein als der VDax New. Dieser Indikator misst die Volatilität, also die Standardabweichungen der Renditen. Wie oben erwähnt, gilt der VDax New als "Angstbarometer". Er steigt in der Regel, wenn die Kurse fallen. Wenn er hingegen fällt und/oder über längere Zeit niedrig notiert, macht sich bei den Börsianern Sorglosigkeit ...
Vola > 39 is always RISKY !
In eigener Sache: Ich versuche nun ein evtl. Abtauchen unter diesem Level abzuwarten...(in der Zwischenzeit ist das Aktiendepot teilweise abgesichert). Volatilität kann kurzfristig ein grosses Risiko darstellen, wenn man...
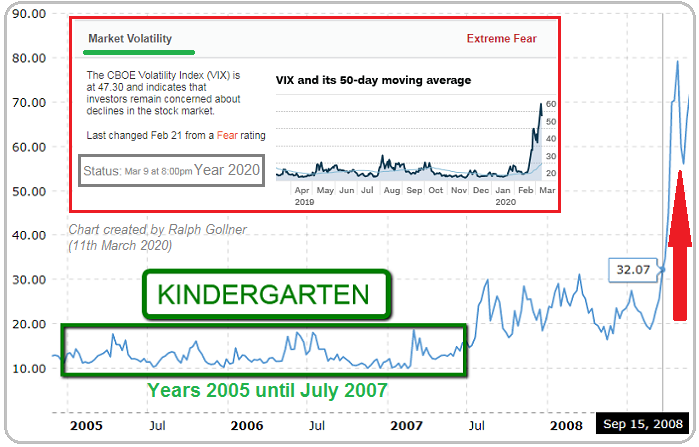
VIX Volatility Index - Historical Chart
...aus stark überbewerteten Aktienmärkten kommt. Langfristig (!) erfolgreiche Investoren verstehen jedoch unter Volatilität, kurz VOLA (Schwankungen), kein Risiko, sondern im Gegenteil eine Chance. Große Kurschwankungen kann man nämlich für sich nutzen, in dem man zum Beispiel nach einer längeren ...
VDAX-New
Vola(tilität) - DAS ANGSTBAROMETER
Gleich einleitend: Erfahrene Börsianer sagen "Kaufen, wenn die Kanonen donnern"
Bzw. mehr technisch: Buy, IF VDAX-New is "HIGHEST", Sell (if needed) if VDAX-New is starting to leave the "blue zone coming up from the green zone"...
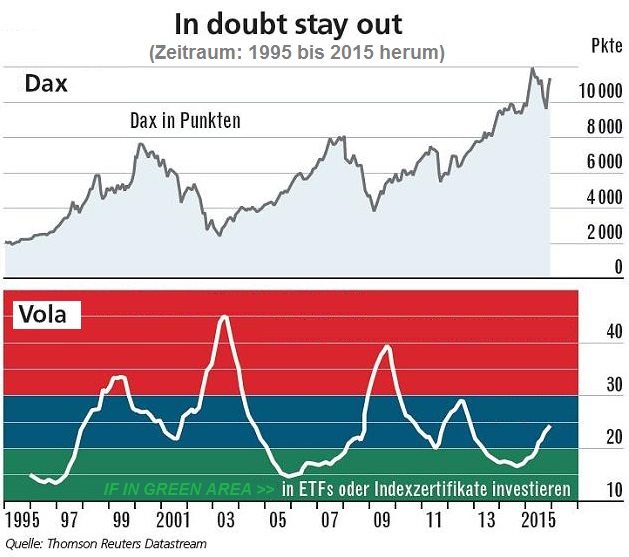
Vola = 12-Monats-Mittelwert des Vdax-New in Prozent
Am Besten hört man nun beim Lesen die Musik vom "Weissen Hai" und stellt sich in der Grafik oben Folgendes vor:
>> Blau steht für "ruhiges Meer"
>> > Rot steht für BLUT!
Euphorie, Kapitulation. Nur wenige Monate liegen zwischen diesen Gefühlswelten, und nichts fängt ...
Sotheby's and the Dow Jones Ind. Average
As per End-of-May 2019 Sotheby's (the company-stock) had a Drawdown (DD) of ca. 40% from its High. Often Sotheby's was a good indicator for the overall stock-market. Calculating away from the recent 40% DD-level I figured out...
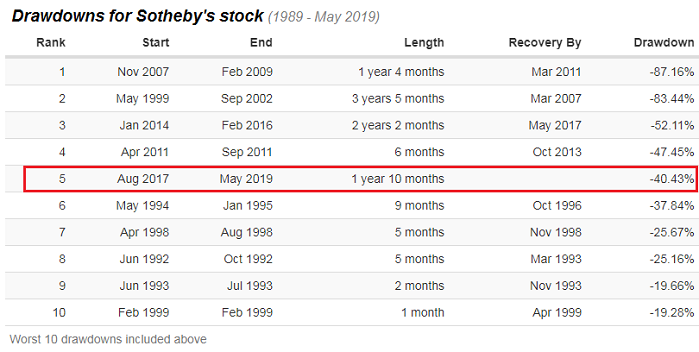
...a further 7%-decline should be the maximum Risk for that stock (see the 2011-Drawdown period).
If that were to happen, I would have seen a correlated risk for the Dow Jones Ind. Average of ca. 5%. That would have meant following result, calculated away from a End-of-May 2019 level of 25,169 points: 23,910 points.
...
Ralph's MinVol-selected stocks
(Backtest 1993-2016)
| years | 1995 | 2002 | 2008 | 2012 | 2013 | 2014 | 2015 |
| Ralph's MinVol-Strategy (BACKTEST only!) | 47.31% | -6.7% | -15.46% | 5.51% | 28.14% | 16.98% | 8.39% |
| MinVol ETF ("some issuer") | n/a | n/a | n/a | 11.04% | 25.11% | 16.34% | 5.50% |
| S&P 500 (Standard-Benchmark) | 37.58% | -22.10% | -37.00% | 16.00% | 32.39% | 13.69% | 1.38% |
I selected 23 stocks out of a "hypothetical MinVol-Universe". Therefore I took a look at one of the more famous MinVol-ETFs out there available in the market. Currently there are 178 holdings in the MinVol-ETF, ...
Volatilität (PUT-Option/Einflussfaktor)
Die implizite Volatilität bezieht sich auf die erwartete Beweglichkeit einer Aktie oder eines Index und wird durch Nachfrage und Angebot von Optionen bestimmt. Folgend der "Vola-Smile" (ein Faktor bei der Optionspreisbildung ist das "Vega"):
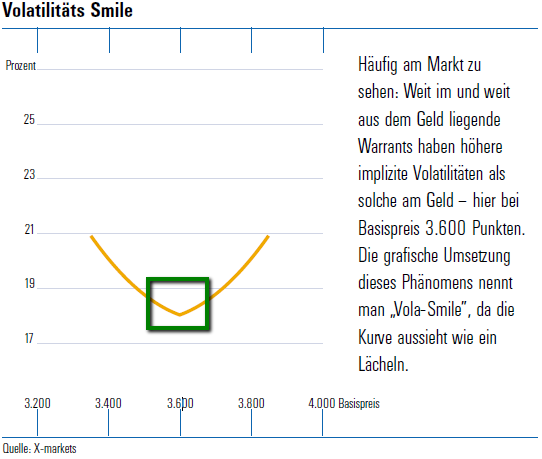
Während die historische Volatilität sich auf die Vergangenheit bezieht, gibt die implizite Volatilität die Erwartungen für die Zukunft wieder. Diese wird, genau wie die historische Volatilität, standardmäßig als ein Prozentsatz auf Jahresbasis ausgedrückt. Im Gegensatz zur historischen Volatilität verändert ...
Value @ Risk - DAX Index
Die Risikoklasse-Einstufung dient als Orientierungshilfe für den risikofreudigen Anleger (weil DAX-interessiert ;-). Die Einstufung beruht auf dem am Finanzmarkt genutzten Value at Risk Ansatz (VaR) zur Bewertung von Anlagerisiken.
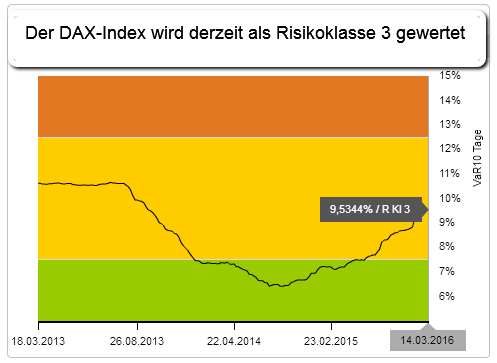
Der Deutsche Derivate Verband (DDV) ermittelt als Branchenverband den VaR für eine Vielzahl von Produkten. Darauf basierend werden die Produkte (hier z.B. ein Zertifikat auf den DAX-Inde) in eine von fünf Risikoklassen eingeordnet. Diese Einstufung wird regelmäßig überprüft und gegebenenfalls angepasst.
Value-at-Risk
Der ...
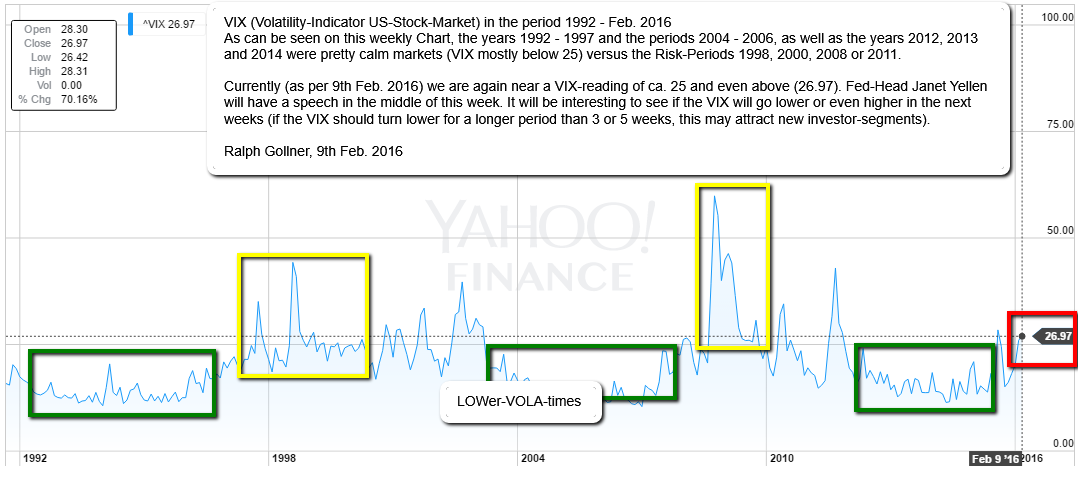
VIX (Volatility/Risk - measure for US-Stocks)
click here for bigger chart: http://www.private-investment.at_VIX_Reading
Leseprobe: "Risiko" / Wie man die richtigen Entscheidungen trifft (Gerd Gigerenzer)
https://www.randomhouse.de
Risiko/erkärt anhand des DAX-Perf.index in 2015
Von April 2015 bis Sep. 2015 hat der DAX in der Spitze von ca. 12.390 Punkten beinahe 25% verloren. Normalerweise erfolgen Korrekturen (bzw. die klassische Baisse) in kürzeren Zeiträumen als Kursanstiege (Hausse-perioden).
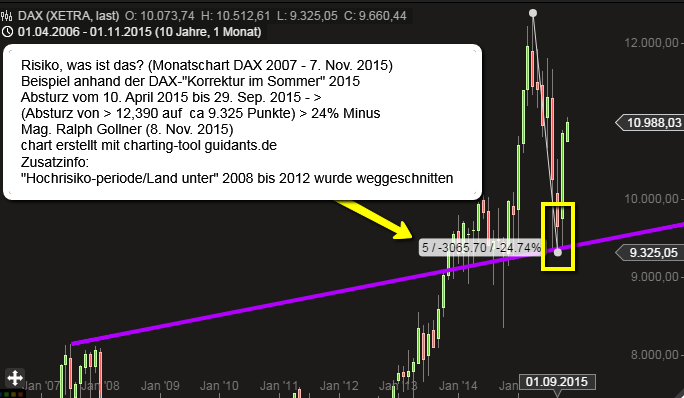
Dies hat auch mit dem fluchtartigen Herdenverhalten (Herdentrieb) der Investoren zu tun (Angst/Fluchtreflex). Diese emotionale Reaktion kann insbesondere dann verstärkt werden, sofern im Abwärtssog auch neue/zusätzliche fundamentale Unsicherheiten aufkommen, wie im Sommer 2015 das Thema Griechenlandkrise oder die ...
Charlie Munger ("Investment partner "of Warren Buffet) tips on Risk
-) “Each person has to play the game given his own marginal utility considerations and in a way that takes into account his own psychology. If losses are going to make you miserable – and some losses are inevitable – you might be wise to utilize a very conservative patterns of investment and saving all your life. So you have to adapt your strategy to your own nature and your own talents. I don’t think there’s a one-size-fits-all investment strategy that I can give you.”
“If we’d used the leverage that some others did, ...
Volatility Clustering
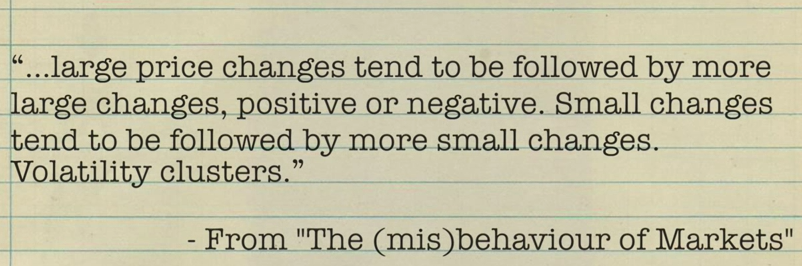
Das beschriebene empirische Phänomen wird als Volatility Clustering bezeichnet. Ein möglicher Erklärungsansatz hierfür ist die Hypothese der Market Overreaction. Danach führt die Veröffentlichung neuer kursrelevanter Informationen zu einem Overshooting bzw. übertriebenen Kursreaktionen der Martktteilnehmer, die osziellierende Gegenbewegungen auslösen. Auffalend ist auch, daß die Volatilität mehr oder weniger stark um ihren Durchschnitt schwankt. Sie besitzt folglich die Tendenz, sich in Richtung ihres langfristigen Mittelwerts zu bewegen.
Unabhängig davon, wie ...
Related Articles

Assess
Evaluate
Take action
Follow your rules
Adapt your strategy if needed (before it's too late)
Always remember: Sometimes there is NO 2nd chance !!
"Lower Risk" - Strategy/Minimum Effort - Defensive Grade Stocks
Benjamin Graham was an economist and professional investor who taught Warren Buffett, Irving Kahn, Walter J. Schloss and other famous investors at Columbia Business School.![]()
The first grade of stocks recommended by Graham are called ...
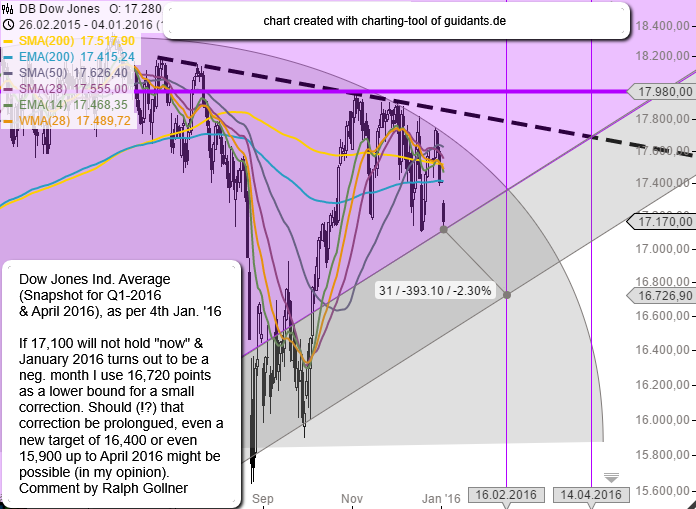
Dow Jones Ind. Average (Risk-Scenario Q1-2016)
There is some risk in the market - especially after the strong Chinese headwind on the awakening of the 1st trading-day in the year 2016. In the S&P 500 the support-level of ca. 1,990 has to hold as well as in the GERMAN DAX @ ca. 10,120!
...
LTCM - Debacle (1998)
Long-Term Capital Management
Reared on Merton's and Schole's teachings of efficient markets, the professors actually believed that prices would go and go directly where the models said they should. The professors' conceit was to think that models could forecast...
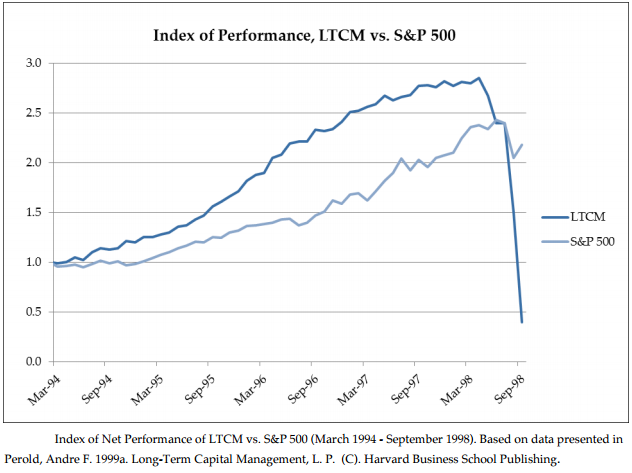
... the ...
DAX Y2K vs. Brexit/Bremain-Factor
(23. Juni 2016 / 24. Juni 2016)
Eine "binäre Option kommt auf uns zu"; Entweder 1 ("sie bleiben drinnen"), oder 0 (= BREXIT). Folgend diesem unsicheren Ausgang, bzw. unsicheren Folgetagen für den DAX ein Blick zurück auf die Milleniumswende:
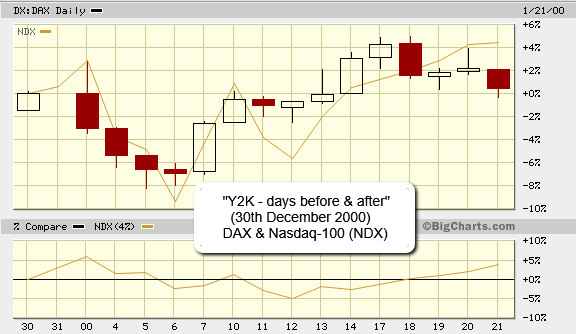
Man kann somit ...
BREXIT-voting - outcome for stocks
(24th June 2016)
A small selection of S&P 500 stocks, which had a pretty bad day in the TECH-Sector of the S&P 500, the broad US-Stock Market Index. Following the unexpected BREXIT (British people voting for a drop-out of the EU) the stock-market crashed:
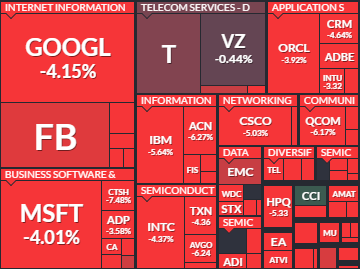
...
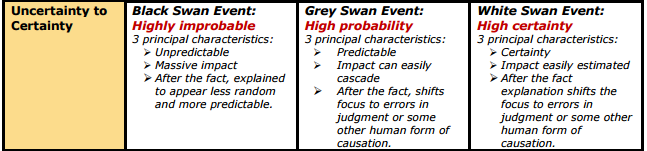
Black Swans, Grey Swans, and White Swans
Brexit (Grey Swan)
Life is full of surprises. Good and bad. We all know that. What we learn over time is that a few of those surprises have sculptured the bodies of our lives. The whole world evolves through large incremental random changes!
KEEP CALM AND CARRY ON
„Keep calm and carry on“ – „Ruhe bewahren und weiter machen“… erst mal durchatmen und dann gehts weiter. Es gibt so viele Situationen in denen „Keep calm and carry on“ der Spruch der Wahl ist und gerade scheint er auch wirklich angesagt zu sein. Überall springt es uns ...
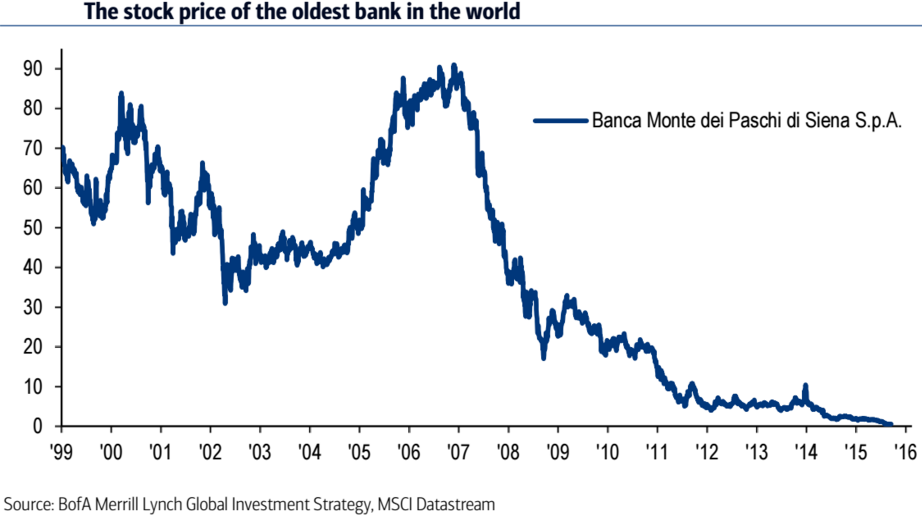
The oldest bank in the world...
Brexit rückt Italiens Bankensystem und dessen NPLs ins Zentrum; NPLs - also "Non-Performing-Loans" sind ein großes Problem für das italienische Bankensystem, dessen chronische Schwäche nunmehr dank des Brexit-Voting wieder an die Oberfläche gelangt.
Ich war ...
Alles wird gut (HOFFENTLICH!)
NPL-Italy
Der gesamte italienische Bankensektor hat 360 Milliarden Euro an Krediten in seinen Büchern, davon dürften 18 Prozent faul sein. Krachen die italienischen Banken, so könnte das eine Kettenreaktion auslösen.

Denn laut der Bank für Internationalen ...
What's your risk number?
"Risk Tolerance"
Do you really know how much you can afford to lose in the market (in German aka: "Rumrutschfaktor")? The Portfolio-management process starts with you setting an acceptable range of outcomes, be it in percentage or absolute terms (in EUR, USD, etc.).
...
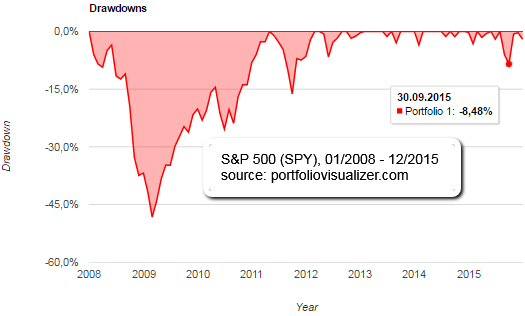
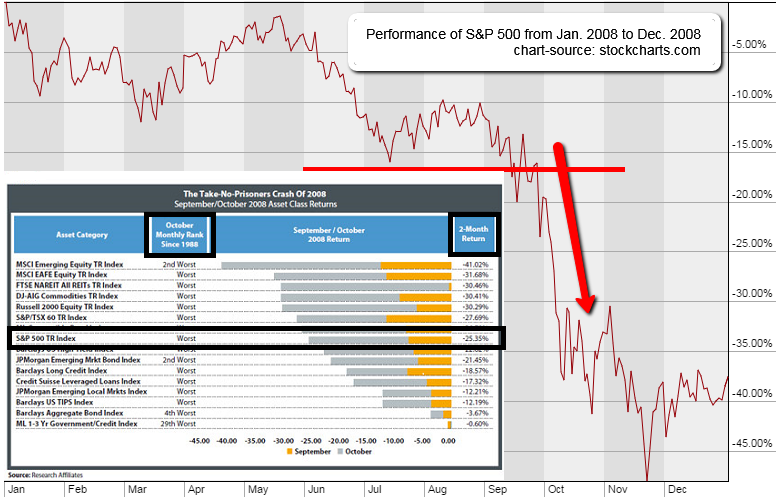
Black Swan/2008 Market Crash
Diversification
If 2008-09 teaches us anything, it’s the truth in the old adage: "The only thing that goes up in a market crash is correlation." Diversification is overrated, especially when we need it most.
In the asset allocation work for North American ...
S&P 500 Verlustwahrscheinlichkeit / Anlagehorizont
(Historie 1960 - 2015)
In der Praxis werde der Anlagehorizont oft zu kurz gewählt, was zu einem suboptimal kleinen Aktienanteil führe (Quelle: Emch, Urs; Renz, Hugo; Arpagaus, Reto (Hrsg.) (2011): Das...
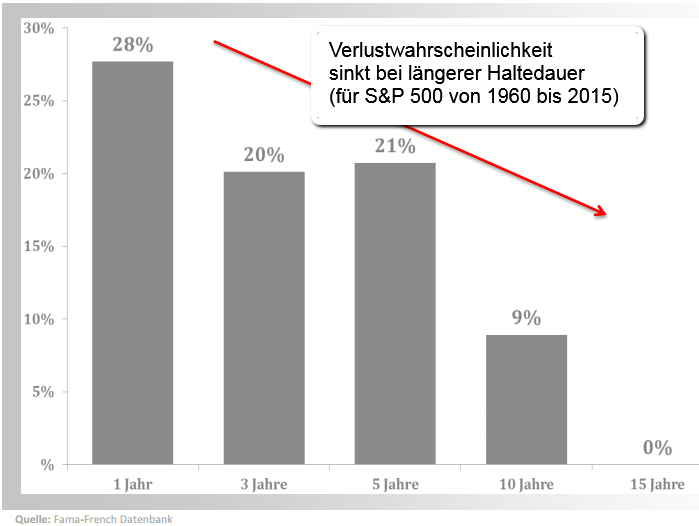
...Schweizerische Bankgeschäft . 7. ...
Be careful in your "1st years"
According to the U.S. market research group Dalbar, which publishes the Quantitative Analysis of Investor Behavior study, the Standard & Poor's has managed an annualized return of over 10% over the past 30 years,...
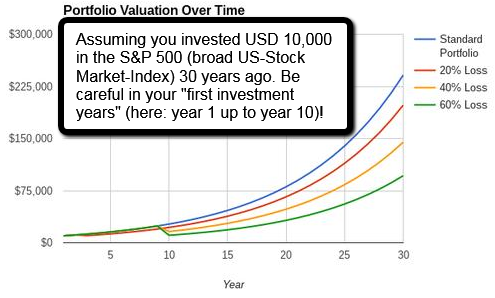 ...far outstripping inflation, which has ...
Elliott-Wellen
Textpassagen aus Original von André Tiedje und Einführungsvideo
Die sogenannten Elliott-Wellen tragen den Namen ihres Erfinders bzw. der Person, die sie entdeckt hat. Und diese Person war der US-Amerikaner Ralph Nelson Elliott, der von 1871 bis 1948 lebte.
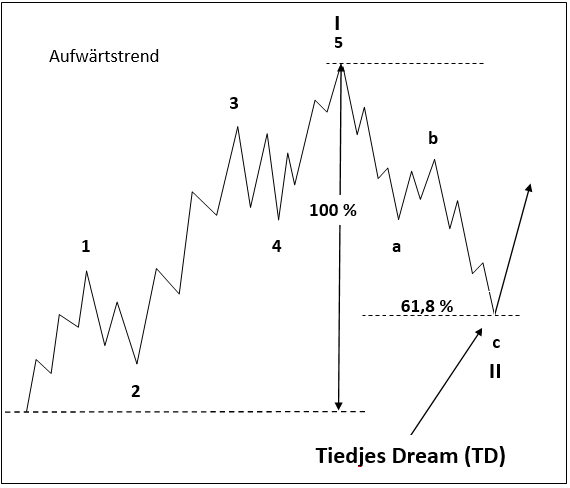
Ausgangspunkt für ...
Artificial Inteligence Trading-System
Focusing on powerful algorithms and modelling techniques allows one to extract the most information from ones data ("BIG DATA") and find correlations, using regressions and Backtesting. Here explanations on AI and 2 highly profitable FX-systems.

...
Travis Rice (Pro Snowboarder) on RISK
Travis is known for being the best snowboarder in the world. But what makes him really special is that he is an innovator, a risk taker, a visionary, the star of the most progressive action sports film ever made (The Art of Flight).
Quote: "[You] should ...
Probabilites for success (> 69% ?)
Warren Buffet was lucky *g* He was born with the ability to THINK LONGTERM ! As an example I am showing following 10years-periods to show the probability to achieve positive yearly gains, while only following a Stock-Index:
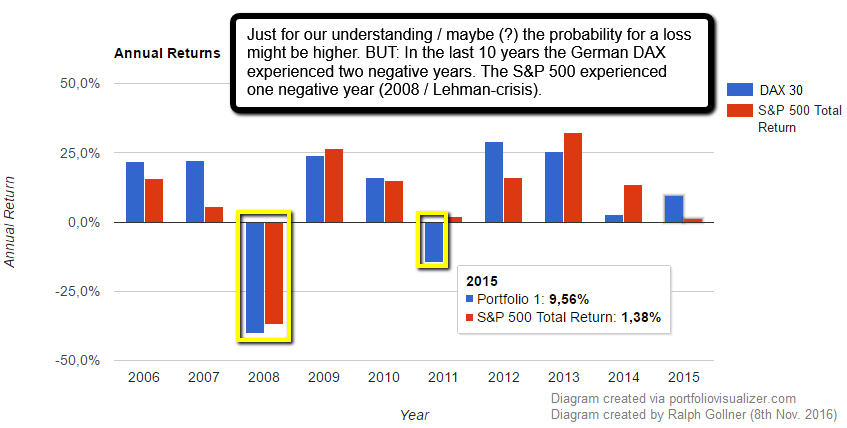
After having checked that the ...
Risk from Election day until Inauguration day
(Dow Jones in the upcoming period: 9th Nov. 2016 - 20th Jan. 2017)
Dow Jones Industrial Average Closing was at ca. 18,333 points on the election-day (8th Nov. 2016). If we had to experience a minus 6%-move like we did from Nov. 2000 - Jan. 2001...
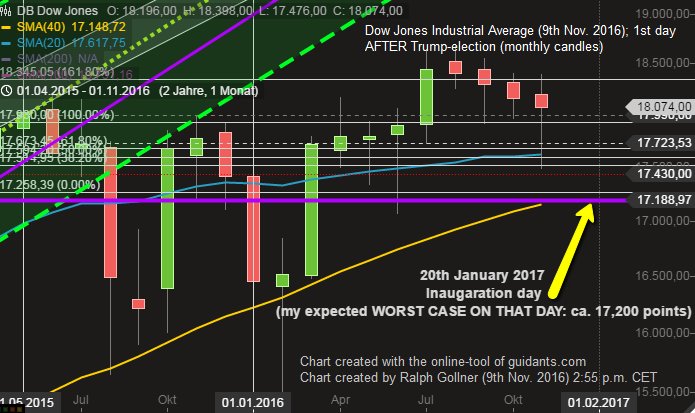 ...
...
The Mouse, The Helmet & The Cheese
(Risk-Taking)
Drawdowns (20year-period)
Don't be afraid, it's only a "Drawdown"..."what draws down, goes up again (hopefully)"
I made some Monte-Carlo-Simulation runs and put up some Drawdown-Scenarios, but let´s start with the S&P 500:
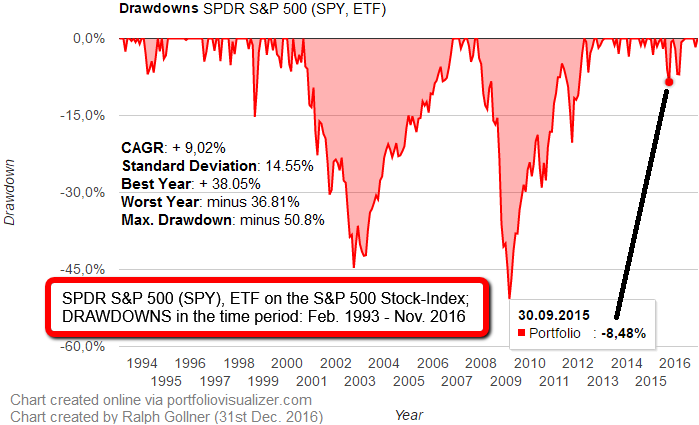
a) Based on Statistical Returns (Allocation-Mix: US Stock Market ...
Diversification (Number of stocks)
Investment theory, and intuition, tell us that risk is reduced by diversification - not putting everything in one basket by holding more than one stock. The question naturally arises: how many stocks should one hold?
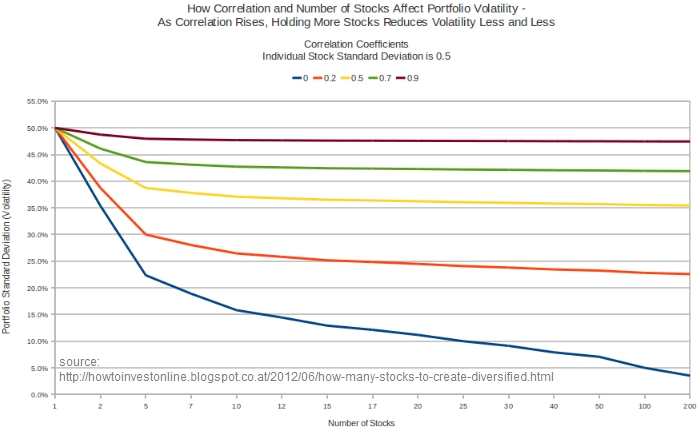
What diversification can and cannot ...
Warum haben Anleger Angst vor Aktien,
einem Aktienkorb und der Börse generell?
Im Jan./Feb. 2016 ging es mit dem MSCI-World-Index um 17% und mit dem DAX um 19% bergab. Rechnerisch lässt sich die Robustheit eines Portfolios durch den Maximum Drawdown darstellen. Er gibt an,...
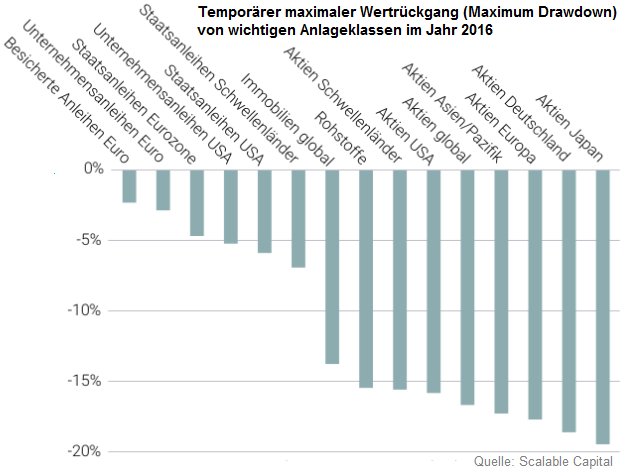
...welchen ...
"Kindergartenbörse"
(Max. Drawdown S&P 500; 06/2012 - 07/2015)
Maximaler Drawdown (Max. Wertverlust) bezeichnet den stärksten Wertrückgang, den ein Fonds oder Index während eines bestimmten Zeitraums verzeichnete. Dazu werden gleitende Zeiträume gemessen,...
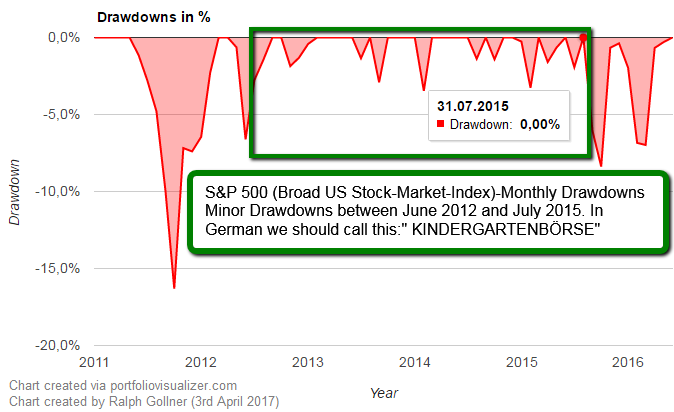
...d.h. der maximale Verlust wird ...
Dynamische Komplexität, Entscheidungen unter Risiko
Es ist für uns Alle eine Herausforderung, mit den Risiken in einer (dynamischen) komplexen Welt effektiv umzugehen. Diese dynamische, komplexe Welt wird von Fachleuten in den USA mit dem Akronym VUCA gekennzeichnet.
VUCA (deutsch: VUKA) ...
TEMPORARY Market losses are the one constant that...
...don't change over time - get used to it !
"One needs to show" what the distributions of stock returns are over time. This paraphrased recommendation was given by University of Chicago professor Eugene Fama at a CFA...
...Chicago Society ...
40 stocks & Diversification
Can/Do you sufficiently spread out your risk by holding a large number of different securities across sectors, industries, and companies? This spreading out of risk, or diversification, is one of the basic...
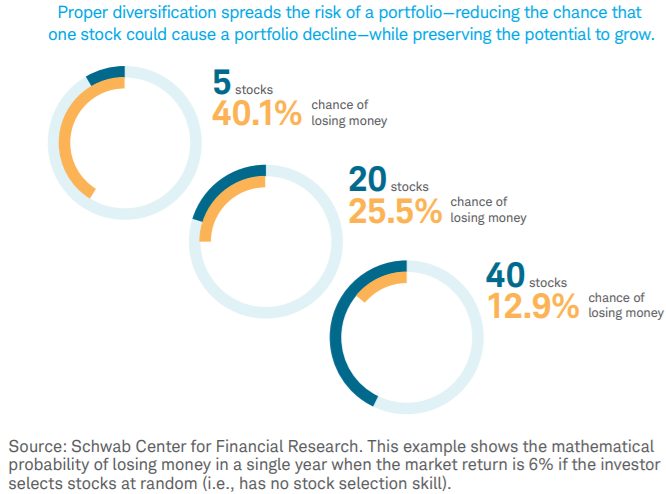
This example above shows the mathematical probability ...
DAX, Dow Jones (Rücksetzer, "Drawdowns")
Seit dem inoffiziellen Start von meinem Projekt "Black Swan" im Sommer/Juli 2014 herum legten Dax und Dow Jones um +25,1% sowie +29,5% zu (Status: 8. Sep. 2017). Dazwischen, seit 1. Juli 2014, kam es in beiden Aktienindizes zu Korrekturen.
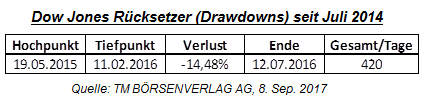
Beim Dow ...
DAX im Okt. 2017 (& Q4-2017)
Q1-2018 (auch eingezeichnet)
Sofern der DAX im Okt. nicht extrem abschmiert, könnte es tatsächlich einen schönen Jahresausklang geben - SOFERN die 11.825 Punkte im DAX Performanceindex halten (sofern kfr. Absturz?). Zugegeben: 6% Plus oder...
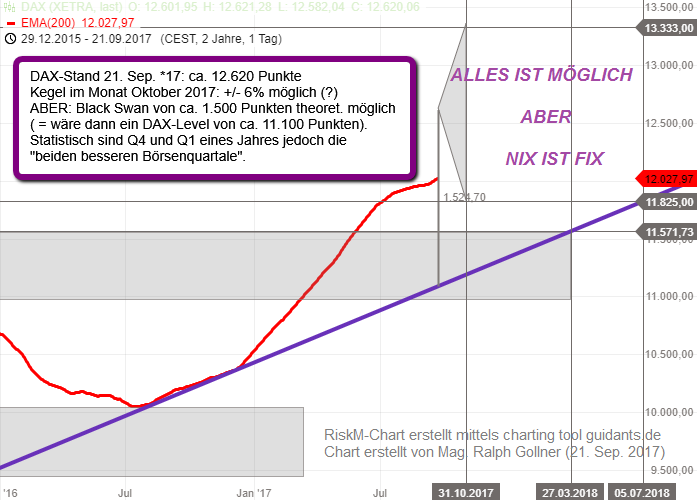
... Minus im Monat ...
Meine 3 ersten Jahre an der Börse (2000 bis 2003)
Die beste Börsenschule EVER (!)
Betrachtet man die großen Aktienindizes und konzentriert sich auf das Ausmaß der größten Rückschläge in den letzten Dekaden (genauer im Zeitraum 2000 bis 2017) ergibt sich in der historischen Rückrechnung...
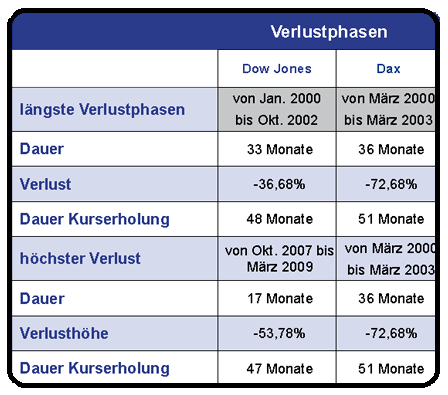
...
DAX EOM-Indikator
Man stelle sich vor, Jemand will von sich sagen: Ich will EINMAL im Monat aktiv an den Börsen "agieren". Nun, wie könnte das gehen? Alle Infos in den Kursen enthalten - ok...(?), daher reicht es vielleicht nur einmal im Monat zu wissen, was man zu tun...
...hat: ...
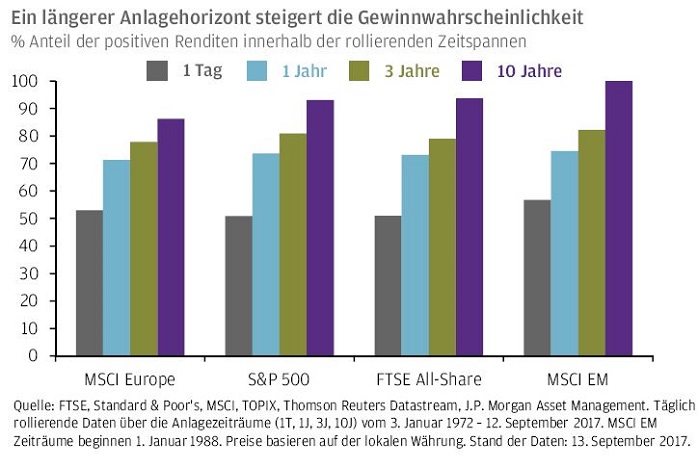
Der Anlagehorizont als
"Risiko-Management Werkzeug"
Je länger der Anlagehorizont, desto höher die Gewinnwahrscheinlichkeit. Interessanterweise sind Emerging Markets-Aktien aus diesem Blickwinkel betrachtet über zehn Jahre Anlagedauer wesentlich "sicherer" als europäische Aktien. Jene...
...
Potential Black Swans
(Date of Survey: Jan. 2018)
Another month, another year; New potential "Fat-Tail risks" detected in the latest Bank of America Fund Managers Survey. Asked what they see as the top "tail risk", most investors responded that Inflation and a bond...
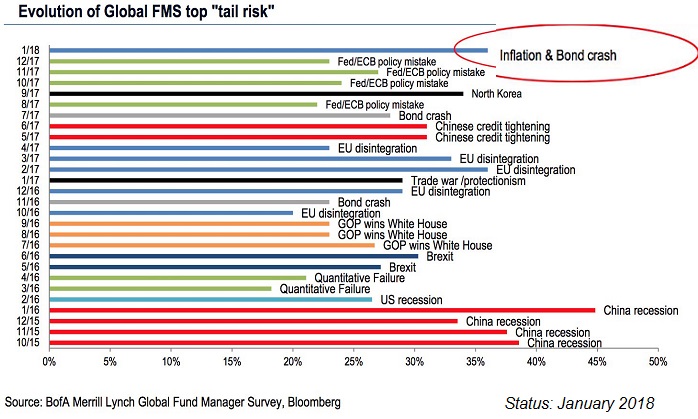
...crash could ...
Weniger Mathe, Statistik, mehr bio-logische Resilienz
Erkenntnisse und Berechnungen aus Mathematik, Statistik und Psychologie sollen Anleger vor den Launen der Kapitalmärkte schützen und helfen, Portfolios robuster zu machen, Stichwort: Resilienz. Die Biologie blieb bislang aber...
...
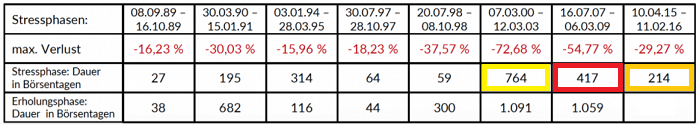
DAX Aktienmarkt
(Risiko / Stressphasen)
Laut folgender DAX-Aufstellung durfte ich seit März 2000 in Summe um die 1.400 Tage in der "Börsen-Stressphase" miterleben (Hier die Daten für den deutschen Aktienindex DAX). Die Börsen in den Jahren 2000 bis 2016 waren definitiv herausfordernder...
...
Tail Risks
A "trade war" is the top tail risk for financial markets, according to fund managers, who also now overwhelmingly describe the global economy as entering the "late cycle" period. "Cracks in the bull case are starting to emerge, with fund managers citing concerns...
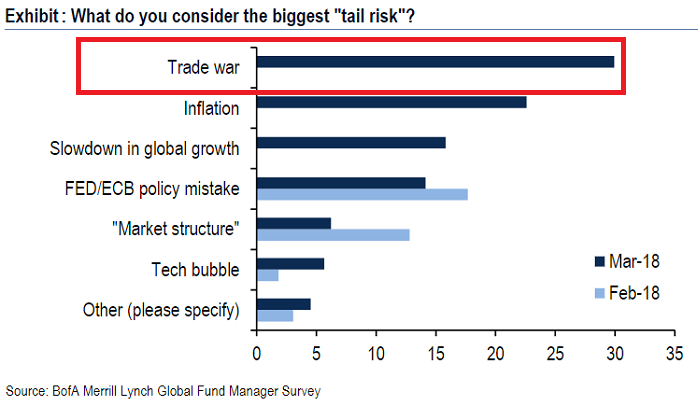
...over trade, ...
Geopolitical Risks
Something rare, something you've never considered a possibility...these events are, what Nassim Taleb calls 'fat tails' or 'black swans,' and he is convinced that they take place far more frequently than most human beings are willing to...
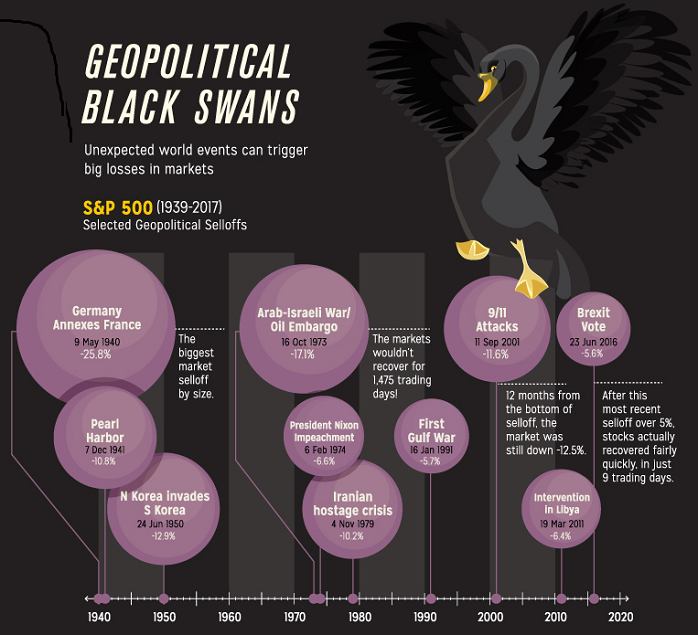
...contemplate. The normal ...
What goes up (2017), can come down (Q1-2018)
Just a small selection of stocks, which had a nice performance in the previous year (2017). Furthermore I selected those, which registered a negative start in Q1-2018. We will eventually see, what the historical drawdown periods of...
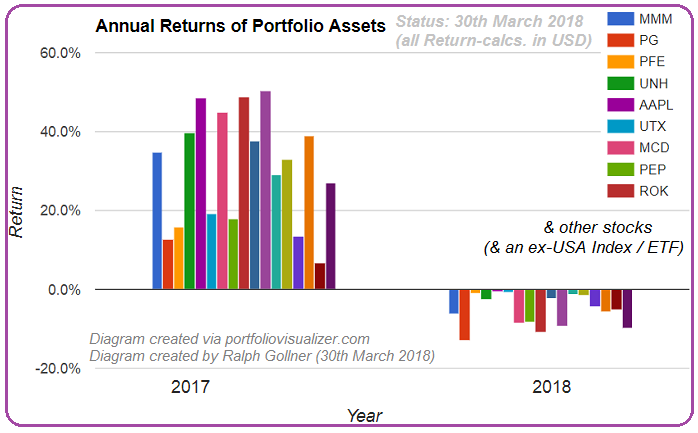
...the ...
Timing the stock-investments
(Mag. R. Gollner)
A Buy & Hold Portfolio may give you some nice outperformance. But when using an adaptive approach - therefore varying the stock-investment-ratio in the portfolio you could avoid potentially disastrous downmoves like the one...
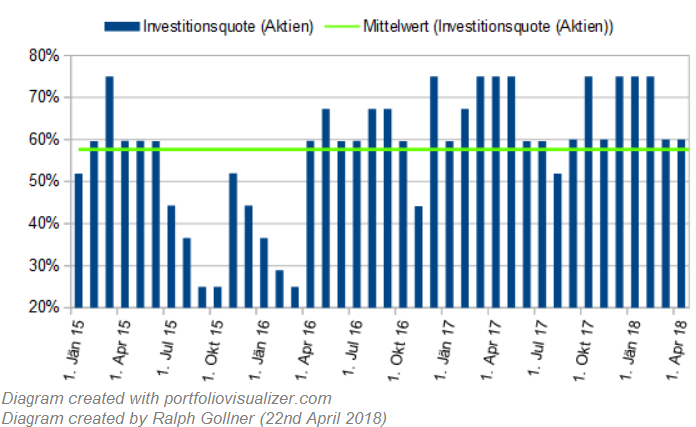
...experienced in ...
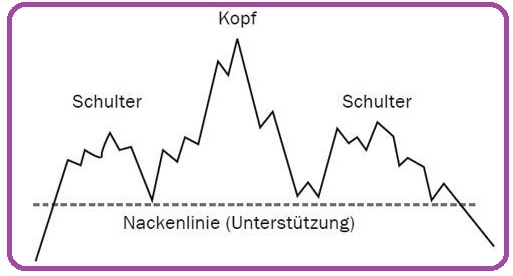
Die "SKS-Formation"
Es gibt ein unbestreitbares Phänomen. Und das lautet: Kurse bewegen sich in Trends. Und diese Trends besitzen die Tendenz, sich solange fortzusetzen, bis sich die Angebot-Nachfrage-Konstellation ändert. Und noch mehr: Die Änderung der...
...
Playing it safe
Remember this: "Of the 26,000 stocks, a mere 1,000 have accounted for all of the profits in stocks since the year 1926. And just 86 stocks - one-third of 1% - were responsible for half of those gains...

So you may only need to take 86 instead of 100 shots ;-)
"the story ...
Small Swans...
(RISK)
Events labelled as tail events are not the result of unknown unknown, but rather known unknown. For example, the latest Global Financial Crisis (GFC) was at the end of the day not a tail event, but rather the product of mismanagement borne...
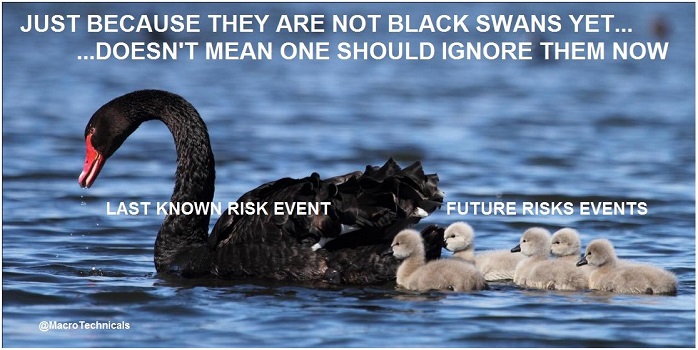
...both by the bankers ...
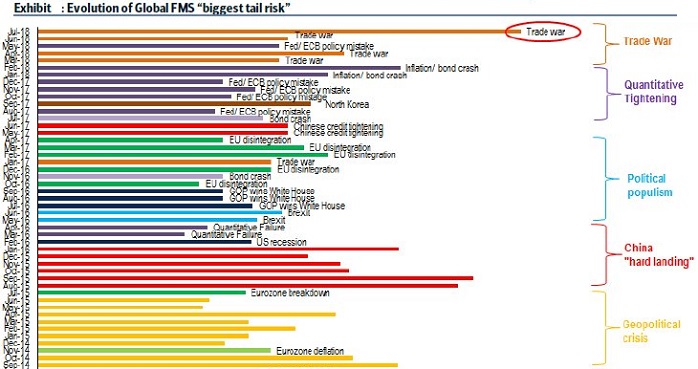
BofAML's Fund Manager Survey Sees
"Trade as Biggest Tail Risk"
link (Video):
www.bloomberg.com/news/videos/2018-07-17
Is "Trade War" still the biggest market risk?
The chart below is remarkable because it demonstrates the top tail risk that fund managers fear. Tail risks, by their statistical definitions, are low probability events which can cause big problems. Naming the biggest tail risk...
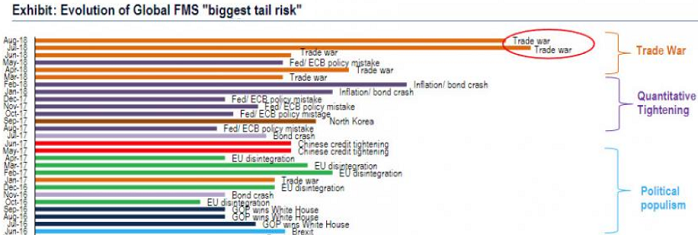
...isn't a ...
(possible) Definition of Risk
in the Investment process (short remarks by Mr. Warren Buffet, made in the year 1994)
QUESTION
on how to define risk?
ANSWER by
Warren Buffett: Well, we do define risk as the possibility of harm or injury. And in that respect we think it's...
...inextricably ...


