Related Categories
Related Articles
Articles
Ralph's MinVol-selected stocks
(Backtest 1993-2016)
| years | 1995 | 2002 | 2008 | 2012 | 2013 | 2014 | 2015 |
| Ralph's MinVol-Strategy (BACKTEST only!) | 47.31% | -6.7% | -15.46% | 5.51% | 28.14% | 16.98% | 8.39% |
| MinVol ETF ("some issuer") | n/a | n/a | n/a | 11.04% | 25.11% | 16.34% | 5.50% |
| S&P 500 (Standard-Benchmark) | 37.58% | -22.10% | -37.00% | 16.00% | 32.39% | 13.69% | 1.38% |
I selected 23 stocks out of a "hypothetical MinVol-Universe". Therefore I took a look at one of the more famous MinVol-ETFs out there available in the market. Currently there are 178 holdings in the MinVol-ETF, issued by iShares.
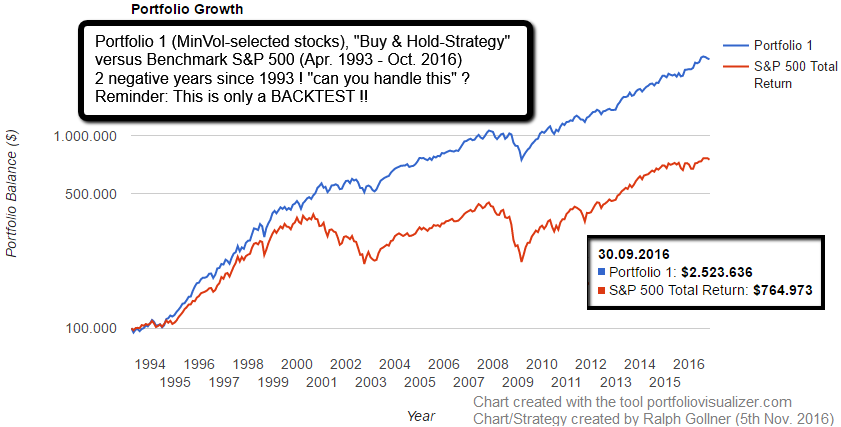
Following you will see the performance-chart of Ralph's MinVol-Backtest ("Portfolio1") since April 1993 (23 stocks fighting against the S&P 500). The Backtest started with a hypothetical investment of USD 100,000:
As I have indicated in the short performance-table at the start of this posting there was a high variability in the yearly performance of the MinVol-Strategy ("Portfolio1"). In the next diagram you get a nice overview year by year:
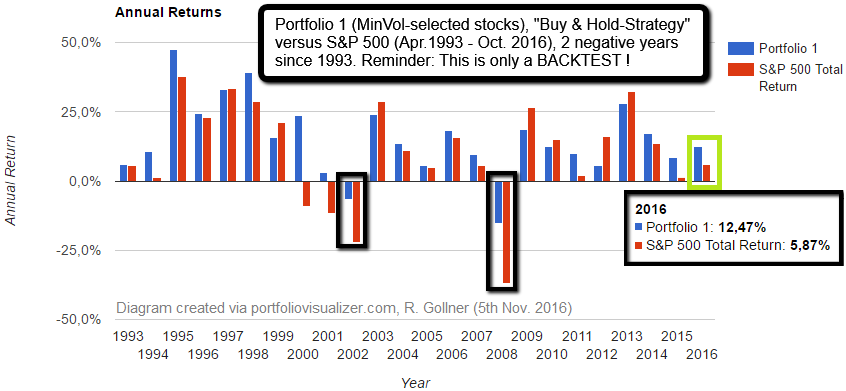
One can also clearly see, that in the current year (2016) the strategy is trying to outperform the S&P 500. The same happened in the year before (2015) and in 2014. It should be clear that I am trying to prepare a "Buy&Hold-Strategy" which can also last the next 3 to 5 years (therefore covering the period 2017 up to 2021)! This means, that I deliberately excluded MORE then 150 stocks from the 178-stocks-MinVol-Universe of the famous US-ETF, which is carrying out this pretty well known Investment-Style.
If one takes some time to see how the "Ralph's MinVol-selected stocks"/"Portfolio1" performed against the S&P 500 each year since 1993 on can cleary see the nice outperformance in difficult years like in 2000, 2001, 2002 or 2008!
To put the performance of the strategy ("Portfolio1") into perspective (period from Apr. 1993 - Oct. 2016):
♦ The Sharpe Ratio (indication of Return versus "used Risk") for the "Portfolio 1": 1.02 (S&P 500: 0.49)
♦ Compound average growth rate: 14.62% (S&P 500: 8.93%)
♦ Standard deviation (Volatility during the year/s): 11.70% (S&P 500: 14.67%)
♦ Final Balance as per Oct. 2016: ca. USD 2,500,000 (S&P 500: ca. USD 750,000)
(adjusted for inflation the initial amount of USD 100,000 grew to an amount of ca. USD 1,480,000)
! Lesson: Inflation is eating away the value of your hard-earned money - over time !
♦ Best year: 47.31% (S&P 500: 37.58%)
♦ Worst year: minus 15.46% (S&P 500: minus 37.00%)
x-x-x-x-x-x-x-x-x-x-x-x-x-x-x-x-x-x-x-x-x-x-x-x-x-x-x-x-x-x-x-x-x-x-x-x-x-x-x-x-x-x-x-x-x-x-x-x-x-x-x-x-x-x-x-x-x
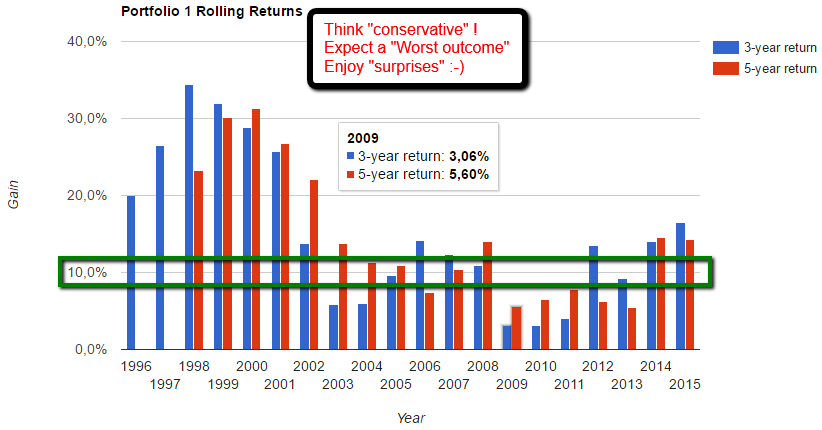
It should also be clear, that a "normal" Investor is not investing for one, two or three years only. From my experience I can say that an Investment horizon of 5 years up to 12 years should be ok for the average-Joe, BUT: My real opinion would say: "Invest for the Long-Term, invest - as if you were never to receive ANY Government-Pension!" This would then mean for a 40 year-old person nowadays to have an Investment-Horizon of 20 to 30 years ! (yeah ; -)
some links
Try yourself the MinVol-challenge: www.minvolchallenge.com
Low Vola getting out of fashion (?) www.bloomberg.com/news/articles/2016-08-25/bad-dream-comes-true-for-quants


