Related Categories
Articles
EURO/USD
Fair Value (?)
Der Big Mac Index basiert auf der Theorie der Kaufkraftparität (KKP), die von David Ricardo im frühen 19. Jahrhundert entwickelt wurde. Es handelt sich hierbei um die Erwartung, dass sich die Wechselkurse auf lange Sicht einem..
...Punkt annähern, an dem sich die Preise eines identischen Warenkorbs aus Gütern und Dienstleistungen (hier: eines Burgers) in zwei beliebigen Ländern angleichen. In diesem Moment weist das Gut keine Preisunterschiede mehr auf (Gesetz der Preiseinheitlichkeit). Bis es allerdings soweit ist, werden Preisdifferenzen ausgenutzt (Arbitrage, ...
EURO/USD-Chart
(1999 bis Mai 2018)
Im Monatschart des Währungspaares EURO / USD erkennt man schön die 200Monate-Linie, welche nun final als Widerstand gewirkt hat. Folgend der Aussagen von Hrn. Draghi bei der IWF-Tagung im April 2018 lenkte der Euro in einen...
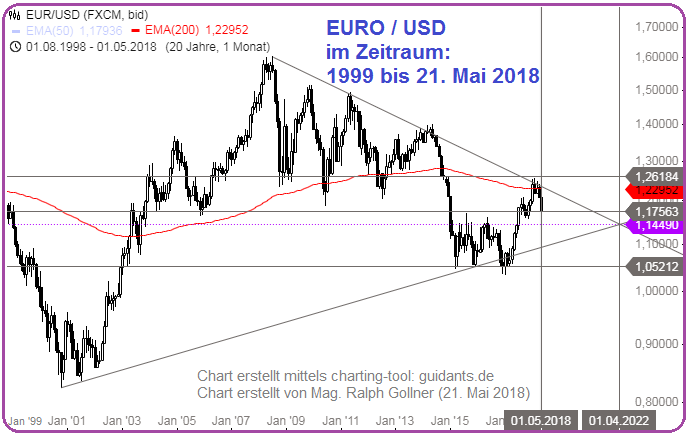
...kurz- bis mittelfristigen Abschwung gegenüber dem USD ein.
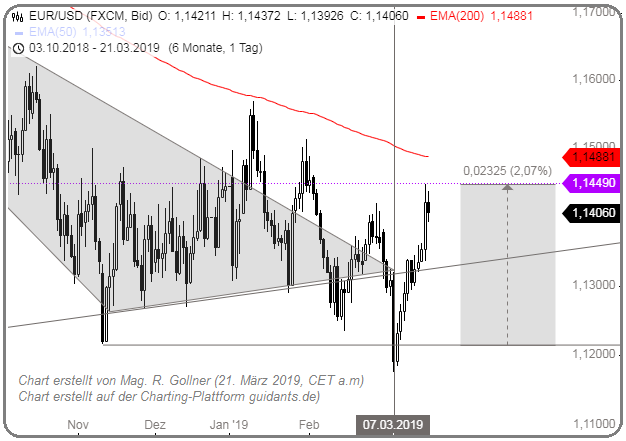
EUR/USD zw. 1,20 und PPP (?)
Egal, wo sich der "faire value" des EUR/USD mittel- bis langfristig befinden sollte, der langjährige Trendkanal im Chart sollte doch klar ersichtlich sein. Sollte die PPP ("Purchasing Power Parity") bei ca. 1,28 oder gar 1,30 (etc.) liegen - so müsste vorerst...
...- in den nächsten Quartalen - der eingezeichnete Abwärtstrendkanal (nachhaltig) überwunden werden!
Kurz zur Info (quick n dirty): In der Volkswirtschaftslehre spricht man bei der theoretischen Kalkulation des fairen Wert eines Währungspaars auch von der Kaufkraftparitätentheorie oder PPP (auf ...
EUR/USD - PPP (1999 - Sep. 2017)
Euro/US-Dollar-Wechselkurs und "fairer" Wert; "Fairer Wert" definiert nach Kaufkraftparität (PPP) der OECD; +/- eine und zwei Standardabweichungen. Währungen finden grundsätzlich in langen Zyklen retour zu ihrem wahren inneren Wert:
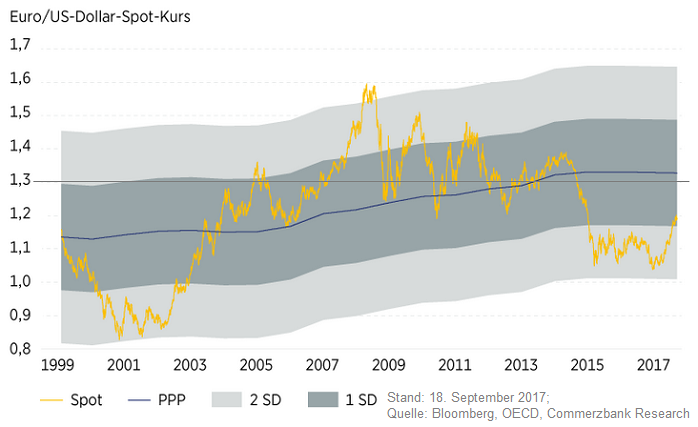
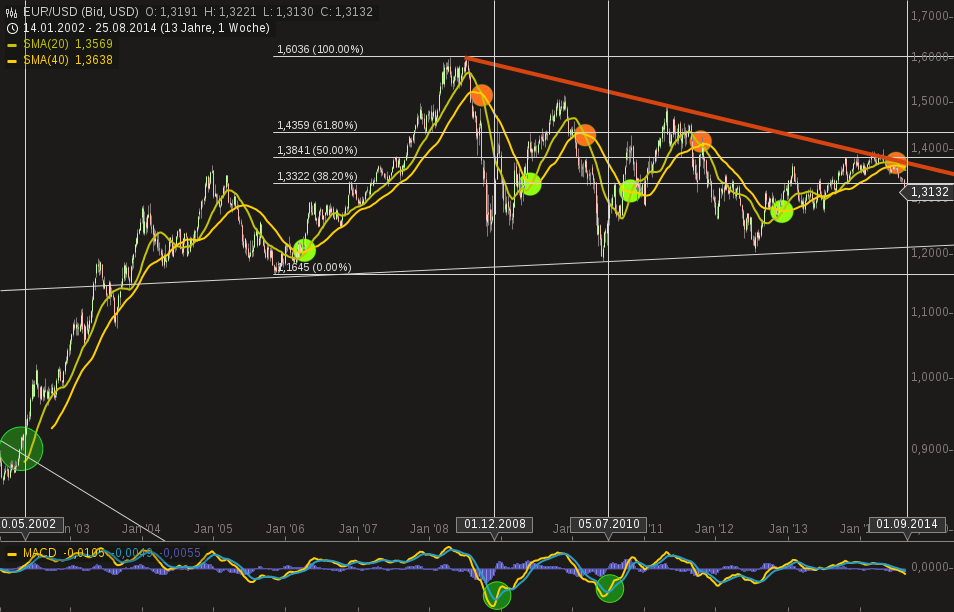
EUR/USD (theoretisch) seit dem Jahr 1953
EUR/USD bewegt sich seit dem Zerfall des Bretton-WoodsSystems fixer Wechselkurse Anfang der 1970er Jahre in langen Wellen. Zwischen Hoch und Tief dieser Wellen liegen zwischen fünf und neun Jahre. In diesem Zeitraum bewegt sich der Wechselkurs grob...
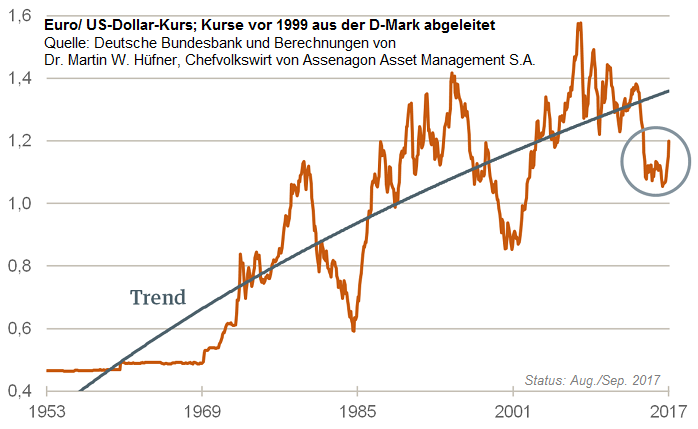
...in einem Schwankungbsereich zwischen 50 Cent und 70 Cent.
Die letzte große Welle führte den Euro von 1,60 EUR/USD im Jahr 2008 auf 1,04 Ende 2016. Inzwischen könnten wir uns evtl. (!) am Beginn einer nächsten großen Welle befinden, die eine deutliche Euroaufwertung erwarten lässt. Legt man die ...
Dow Jones Ind. Average & EUR/USD
(2017 / Year-to-date Entwicklung)
Das Protokoll zur letzten EZB-Zinssitzung enthielt interessante Hinweise auf die aktuelle Einschätzung und die weitere Vorgehensweise der EZB. So wurde die Aufwertung des Euro gegenüber dem USD als eine Normalisierung nach...
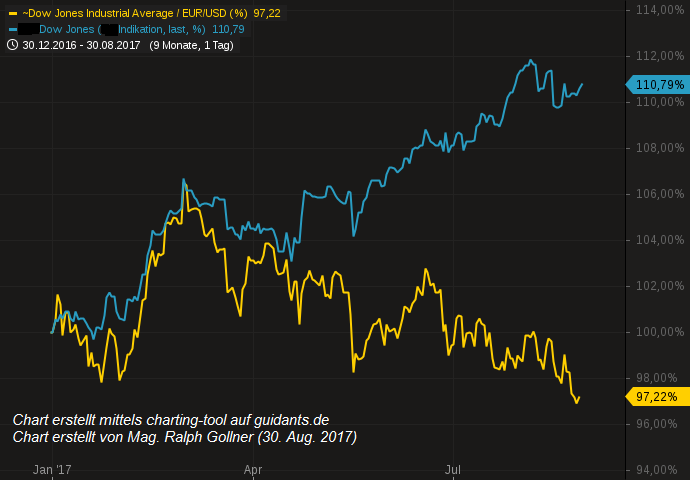
...den politischen Ereignissen der letzten 18 Monate gewertet.
Dazu gehörten Brexit, die Wahl Präsident Trumps mit all den daran geknüpften Hoffnungen auf eine weitere Beschleunigung (bzw. zumindest Erhalt) des Wirtschaftswachstums in den USA sowie die Euro positiven Wahlausgänge in den ...
EUR/USD - PPP
(Purchasing Power Parity)
The US dollar might have more room to fall (?)...The USD has been going nowhere but down recently and could be due for a near term reversal or consolidation. However, the fundamentals driving the weakness in the USD persist,...
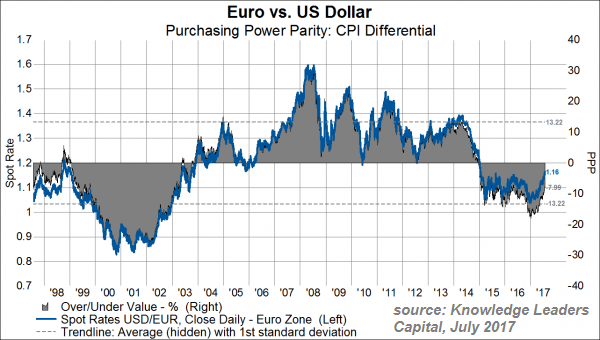
...namely: monetary policy convergence (or slowing of divergences), relative US economic underperformance, and higher budget deficits in the US.
Furthermore, according to the purchasing power parity (PPP) model -calculated here be Knowledge Leaders Capital- which takes into account price differentials between economies, ...
EUR/USD
@ or near magic 1.15 - level
Let's see, if the Euro can manage to climb above the 1.15 level (vs. the USD) for several weeks or if the currency pair is hitting its ceiling here for the medium term...
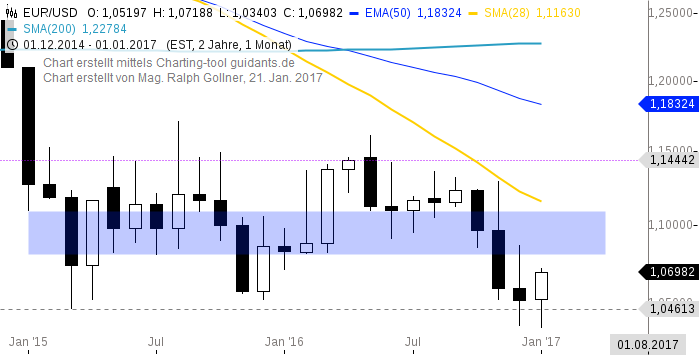
EUR/USD
(Jan. 2015 - 20. Jan. 2017)
Folgend der Chart des EUR/USD im Zeitraum Jan. 2015 bis inkl. 20. Januar 2017. Hier die Monatssicht (Kerzenchart); Somit lässt sich gut erkennen, dass die magischen 1,08 noch nicht erreicht wurden - daher noch "unter dem Wasser"-Streifen (auch < 1,11).
EUR/USD (2015-11th March 2016)
Important to know about the seasonality of the USD in US-election years (pl. see below); Still: One has to remember, that the USD showed real strength in Q4/2014 and also into the year 2015! From July 2016 onwards, the volatility may begin to rise (again).
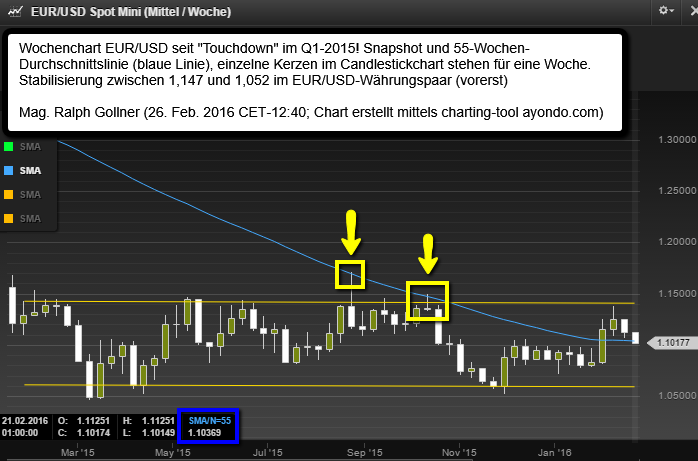
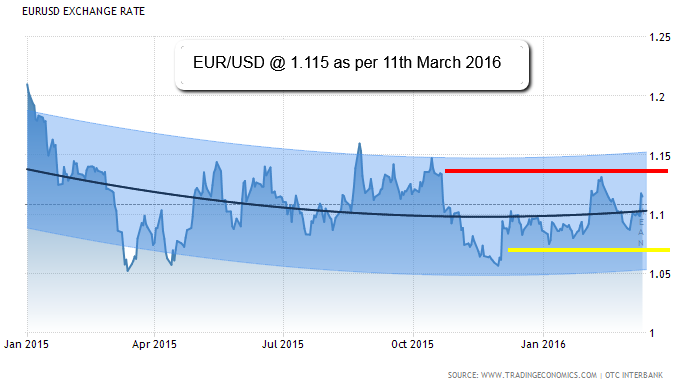 As can be seen in the chart above, the currency-pair seems to stabilise between 1.05 and 1.14. A further strengthening above or below the relevant levels could imply further trend-strengthening in the respective direction.
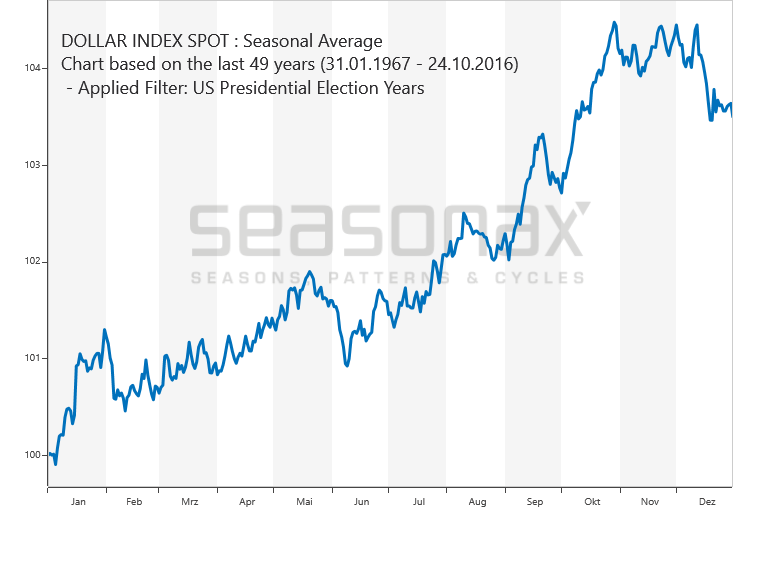 source: http://seasonalcharts.de
Long-Term Chart synthetic EUR/USD
(1958-2016/03)
The Euro was only introduced as a currency on the 1st January of 1999. However, synthetic historical prices going back much further can be modeled if we consider a weighted average of the previous currencies (source: tradingeconomics):
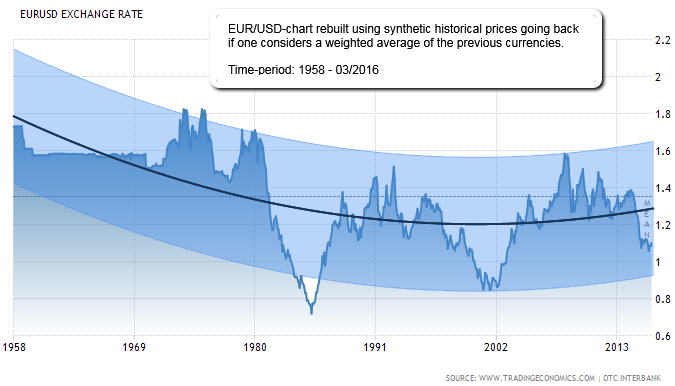
Historically, the Euro Dollar Exchange Rate - EUR/USD reached an all time high of 1.87 in July of 1973 and a record low of 0.70 in February of 1985. In the following chart (source: tradingsignal) one can see the "magic-level" of ca. 1.0 EUR/USD, which the media is so keen on writing about the last ...
EUR/USD 2015 bis Feb. 2016 (Wochenchart)
EUR/USD & Purchasing Power Parity (01/2016)
THE Big Mac index was invented by The Economist in 1986 as a lighthearted guide to whether currencies are at their “correct” level.
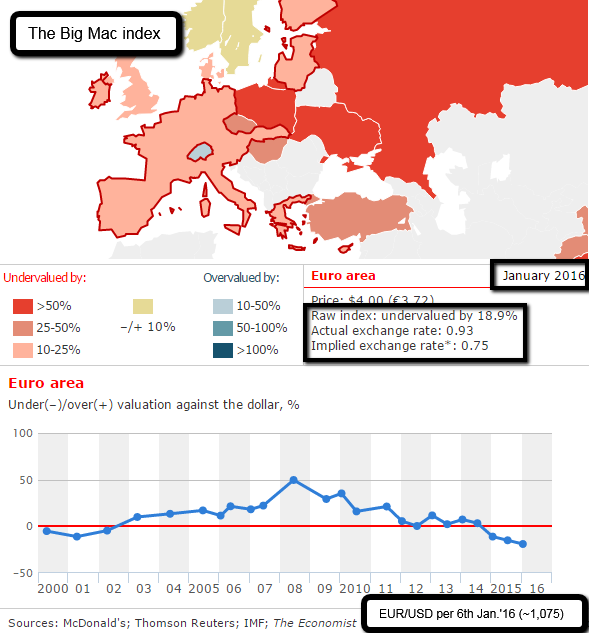
As can be seen in graph above a currency always floats (!) in the long run (!) around its "fair value". From the beginning of the paper-money EURO until now (Jan. 2016), the EUR/USD-rate was either strongly overvalued or undervalued, in some years even fairly valued (but this is still a subjective assessment!).
The Big Mac index is based on the theory of purchasing-power parity (PPP), the notion that in the ...
EUR/USD - Trend-Snapshot (28. Okt. 2015)
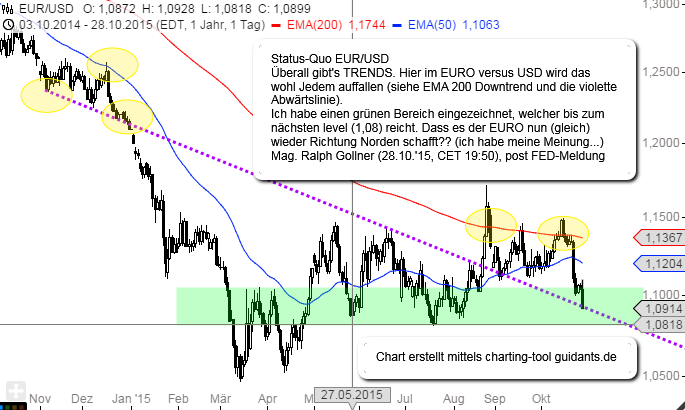
EUR/USD Langfristchart (1980 bis Okt. 2015)
Der Langfristchart von chartbuero.de sagt mehr als tausend Worte. Der aktuelle Bereich zwischen 1,09 und ca. 1,15 hat eine hohe Relevanz bzgl. der weiteren Entwicklung, sofern das Währungspaar (nachhaltig) darüber, oder darunter ausbricht. Fundamental wird dies wohl kurz- bis mittelfristig von der amerikanischen Notenbank (FED), bzw. von den Notenbanken weltweit beeinflusst werden.
weekly recheck EUR/USD for a global portfolio investor
Folgend ein täglich aktualisierter Chart vom EUR/USD-Währungspaar:
Es geht hauptsächlich darum, die Entwicklung des EUR gegenüber dem USD im Hinblick auf die mittelfristige Zukunft abschätzen zu können. Währungen können, im Gegensatz zu Aktien, langfristig gleichförmige Bewegungen mit wenigen ERRATISCHEN Auschlägen aufweisen (Ausnahmen mit starkem Notenbankeinfluss wie EUR/CHF gibt es natürlich, Stichwort: BLACK SWAN). Seit Juni 2015 kann man eine Stabilisierung des EUR/USD (100-Tage Durchschnitts) bei ca. 1,10 sehen. Solange der ...
a possible medium-term Turnaround-Signal in EUR/USD (see weekly chart below) ?
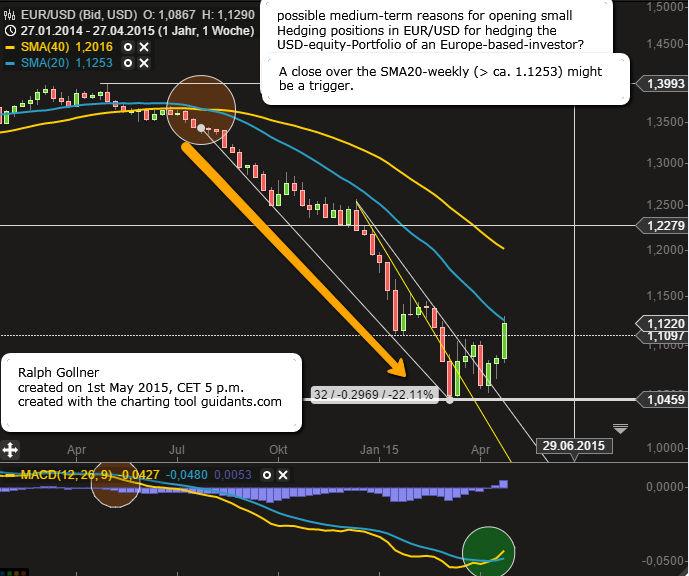
EURO as per 29th Aug. 2014
EUR 1,27 as first target (ein Chart sagt mehr als tausend Worte !!)
weekly chart, short moving averages (SMA) on weekly basis, 20 & 40 say everything (my opinion)
red circle: SELL SIGNAL, green circle: BUY SIGNAL
(KISS = Keep It Short & Simple ;-)
Chart, daily and short term-target; latest by end of Nov. 2014 => as mentioned above, 1st Target = 1,276 (my opinion)
Related Articles
Gold Ratios
There are two gold and silver miners indices frequently referred to: Philadelphia Gold and Silver miners index with ticker ^XAU (data since Dec 19, 1983) and the AMEX Unhedged Gold Bugs Index with ticker ^HUI (data since Jun 04, 1996).
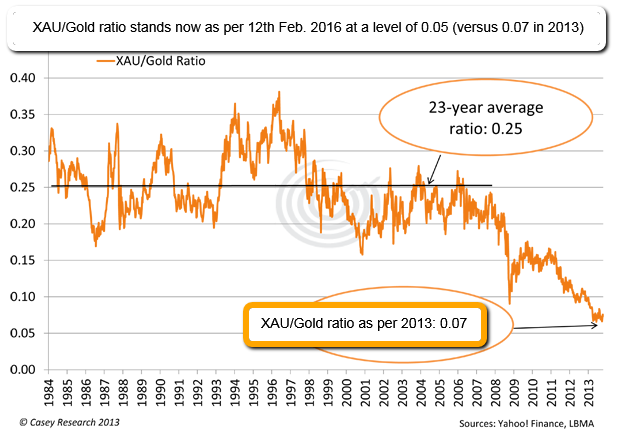 The Philadelphia Gold & Silver Index (XAU) is ...
Silber (2003 - April 2016)
Silber profitiert Marktbeobachtern zufolge von einer Wiederbelebung der Industrienachfrage insbesondere in China. Und mehr als die Hälfte der Nachfrage nach dem „Edelmetall des kleinen Mannes“ stammt aus diesem Bereich.
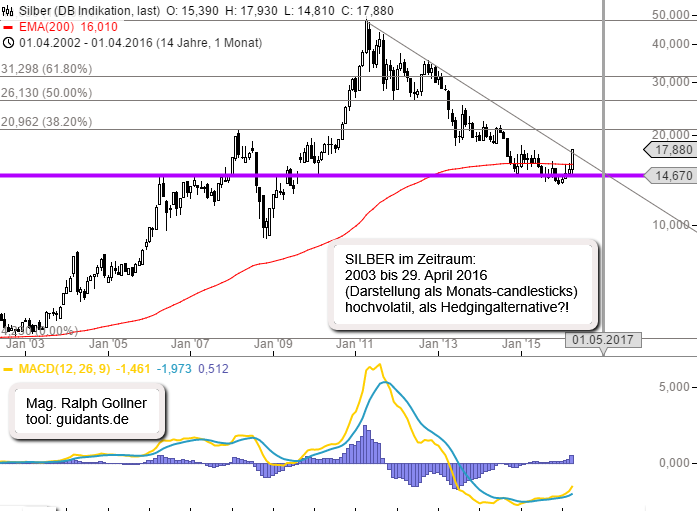
Silber wird beispielsweise in Legierungen, ...
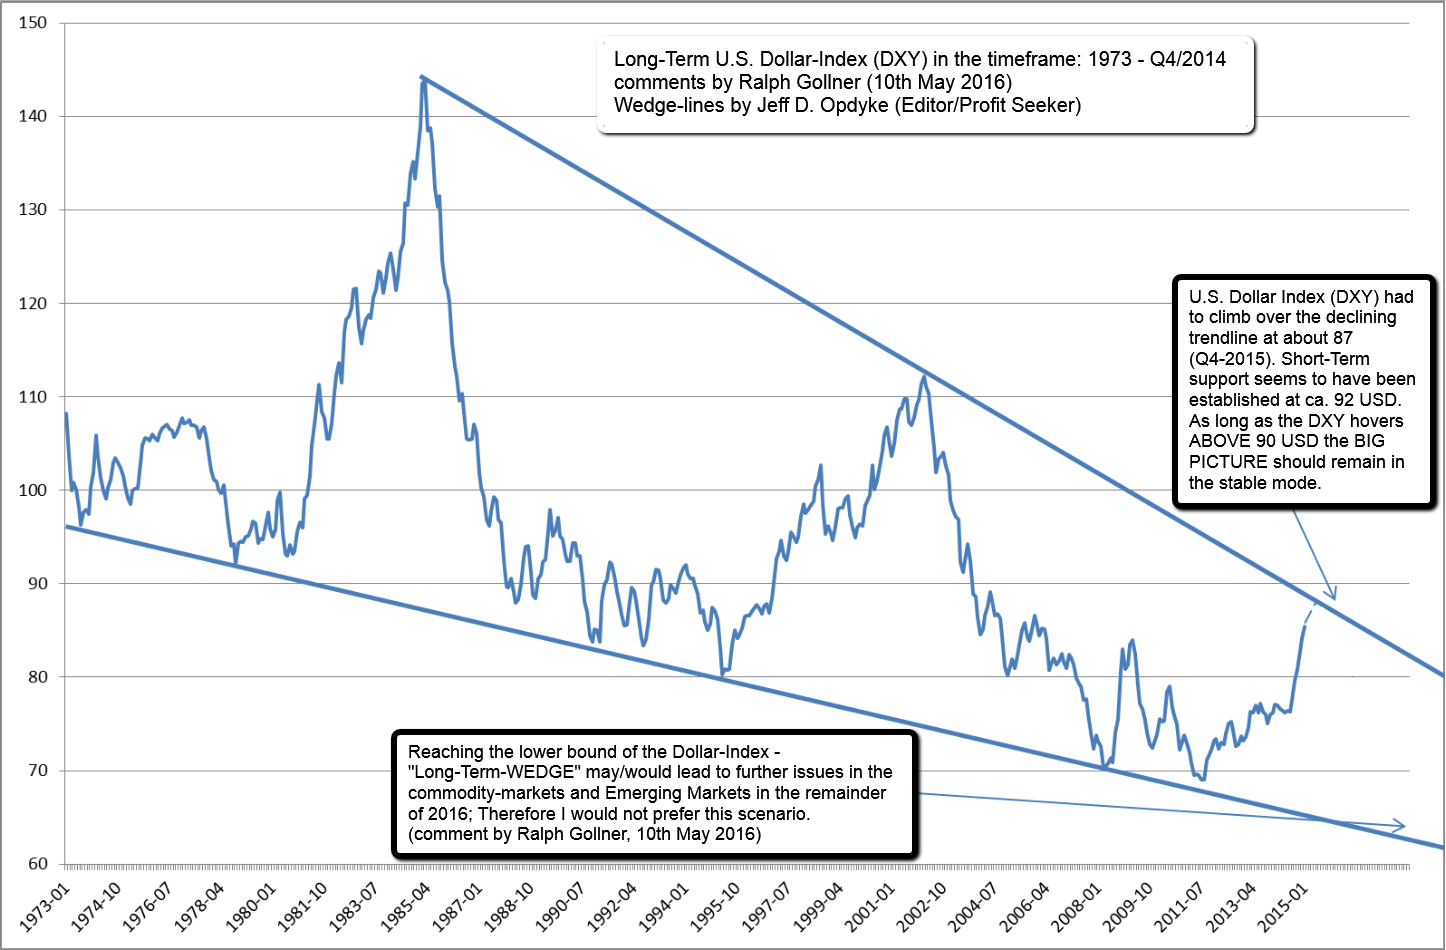
U.S. Dollar Index (DXY, 1973 - 2015)
To stock market technicians, the Long-Term Chart below is the mother of all "descending wedge" patterns. It's the U.S. Dollar Index, as measured and reported monthly by the Treasury Department, going back more than four decades.
 Please click for the BIG ...
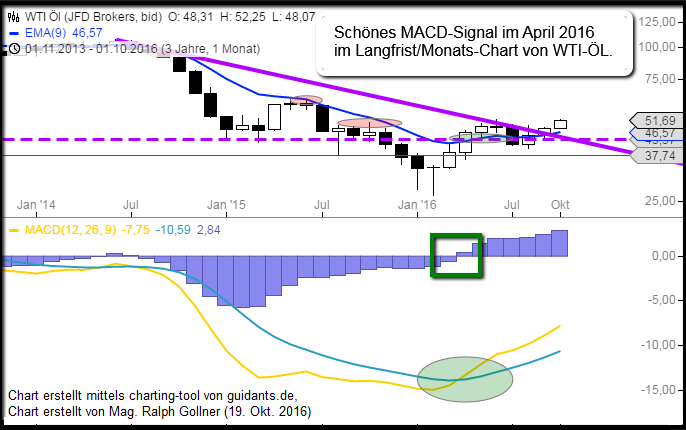
Oil (WTI)
Die durch den Fracking-Boom in den USA mitausgelösten Überkapazitäten bei der Ölproduktion belasteten seit Sommer 2014 massiv den Ölpreis. Zuletzt führten Förderkürzungen aber wieder zu einer Stabilisierung.
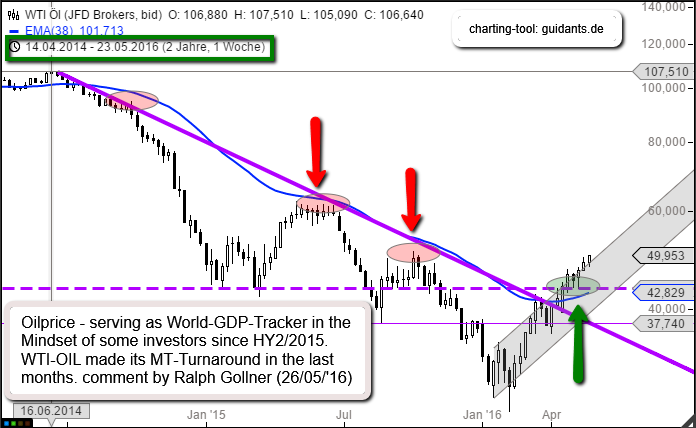
So sind die Rohöllagerbestände in den USA sind in der vergangenen Woche ...
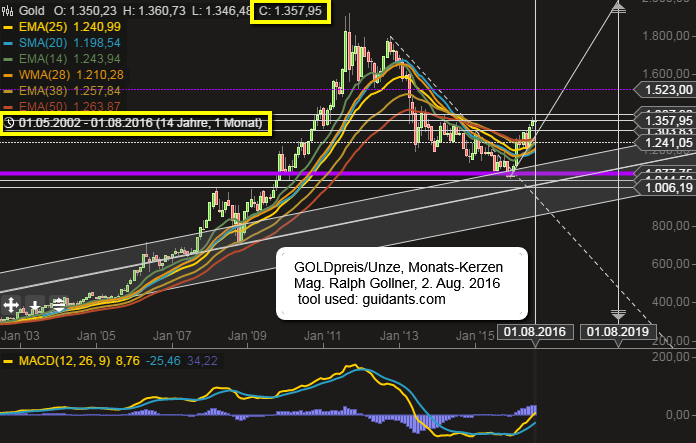
Gold (2003 - Aug. 2016)
Solange der Goldpreis über 1.300 USD, bzw. zumindest 1.241 USD notiert, bzw. gar weiter ansteigt, erscheint GOLD in Zeiten wie diesen (Unsicherheit durch Geopolitik, Notenbankpolitik) eine sinnvolle Ergänzung.
USDJPY (1972 - 3rd Aug. 2016)
For the most part, as goes the Yen over the past several years, so goes the carry trade - and risk-on assets. For example, the relationship between the Yen and equities has been very tight (on an inverse basis) over the recent years.
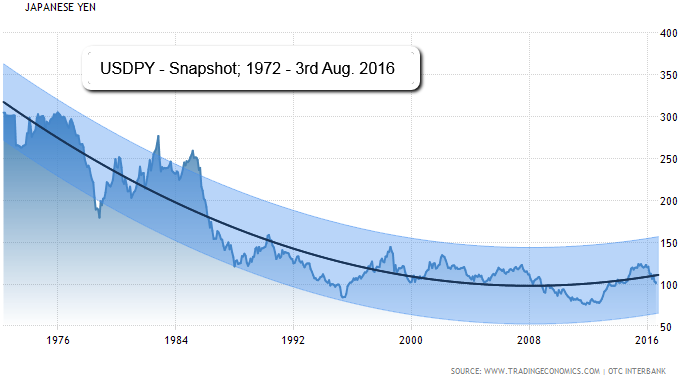
The relationship between ...
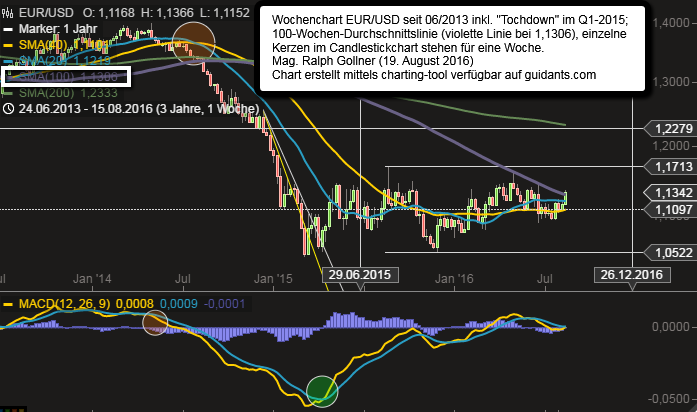
EUR/USD > 1,10 (Aug. 2016)
WTI-Öl (MACD-Signal im April 2016)
Monatschart
U.S. Dollar Index (DXY) above magic 100-level
The dollar rolled higher versus major rivals following upbeat data on durable goods orders and maintained gains after minutes of the Federal Reserve's November policy meeting...
...reinforced expectations for a December rate increase. The U.S. ...
10year US, 2year US (study on FX-impact)
Very theoretic, but good to think about it; most recent yield steepness observed (rising since several weeks already). For information purposes: Shaded areas indicate U.S. recessions in the last decades.
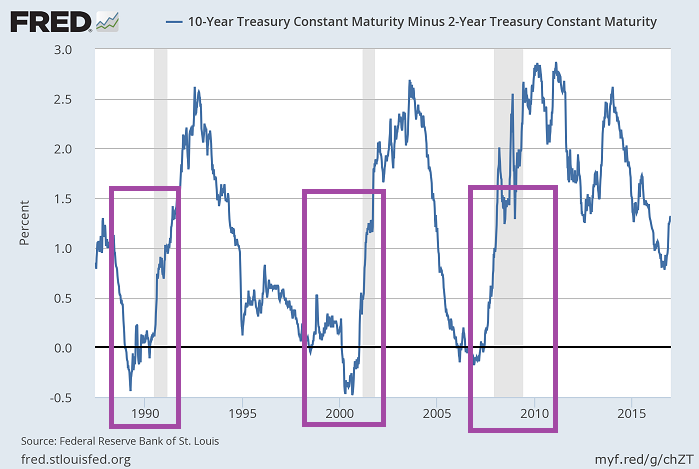
Important to know also, that from a rising ...
Cryptocurrencies (Bitcoin, etc.)
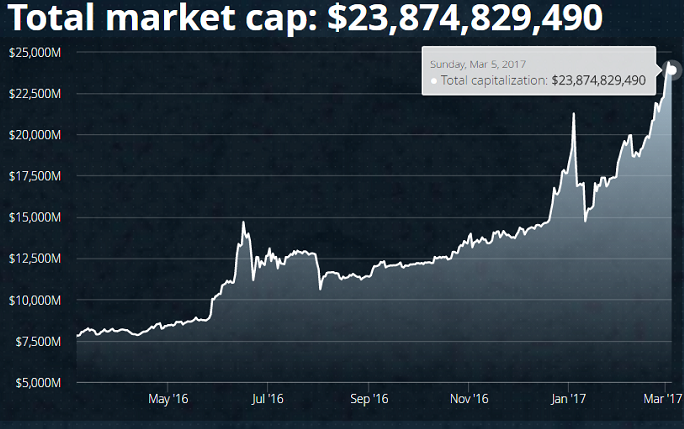
Just for Info; HIGH (!!) RISK; At approximately 10:20 a.m. Eastern time on Thursday (2nd March 2017), the price of Bitcoin climbed to USD 1,241.30 which was an all-time high for the digital currency. At the same time, the spot price of gold sat...
...
PPP (EUR/USD) - "fair" Value?
Die Frage stellt sich, ob und wie sich die aktuelle Inflationsdifferenz USA/Euroland auf den Kursverlauf des Euro/Dollar auswirken wird. Hier kommt die Realzinsdifferenz ins Spiel, die sowohl die Zins- als auch die Inflationsdifferenzberücksichtigt.
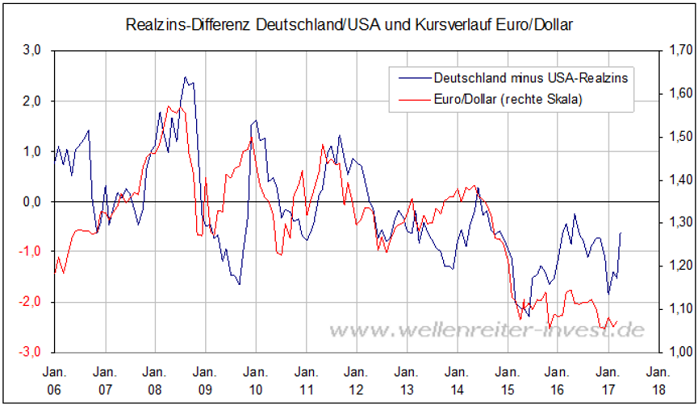
Gerechnet ...
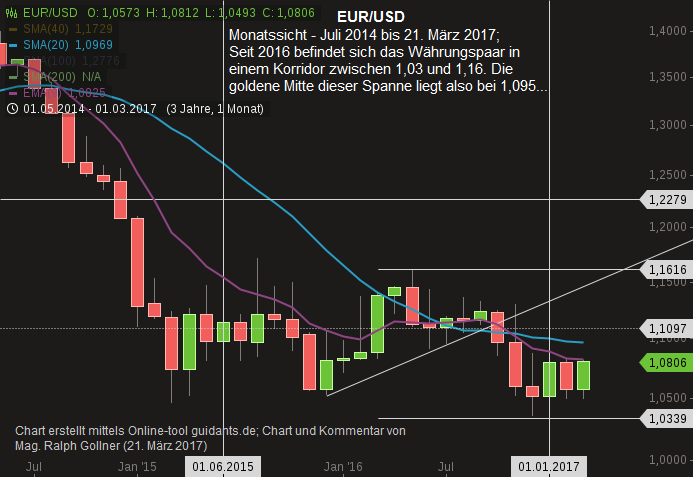
EUR/USD-Snapshot (März 2017)
Folgend einem Interviewduell zwischen den französischen Präsidentschaftskandidaten und den möglichen Gerüchten bzgl. eines möglichen (!) Auslaufens der expansiven EZB-Notenbankpolitik erstarkt der Euro wieder etwas...
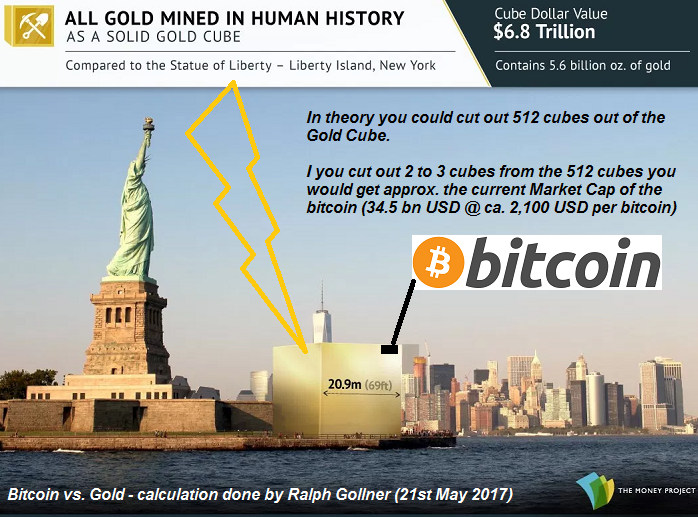
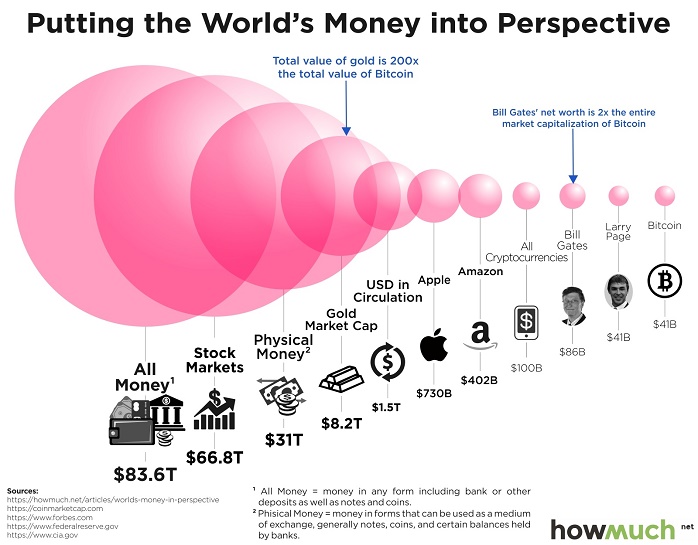
Bitcoin versus Gold ("Global Market Cap")
The last time I mentioned Bitcoin on my site (6th March 2017), the price of Bitcoin climbed to USD 1,241. Some hours ago, Bitcoin passed the USD 2,000 level. Just for Info; HIGH (!!) RISK !
Disclaimer/Disclosure: Ralph Gollner hereby declares, that ...
This chart should put the size of bitcoin in perspective
Intro: Bill Gates's net worth still beats bitcoin's entire market cap; HowMuch.net on 21st June 2017 put things into perspective and demonstrated that for all the buzz and excitement bitcoin has generated, it still has a long way to...
 ...
...
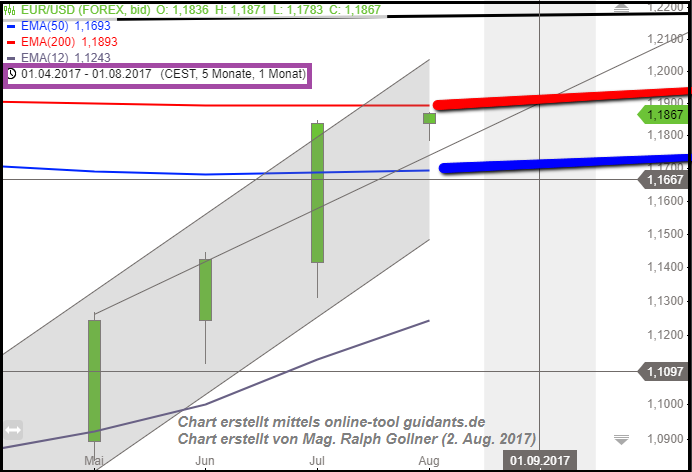
EUR/USD in der Nähe von 1,19
Folgend der sehr langfristigen Durchschnittslinie auf Monatsbasis (EMA 200) befindet sich nun der Euro versus USD in einer spannenden technischen Region ("extreme resistance" zw. 1,185 bis 1,215).
link:
It's all about the "Euro" ?
www.zerohedge.com/news/2017-08-02
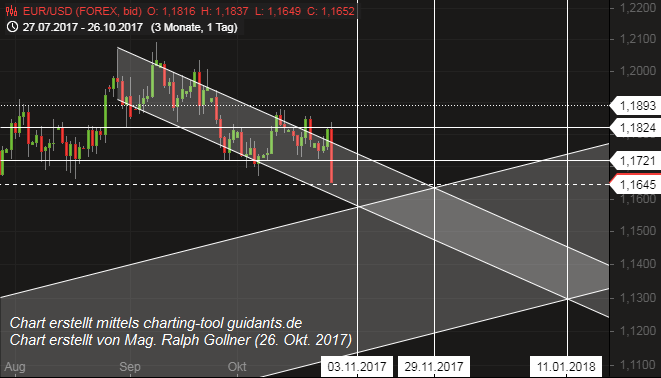
Bitcoin (BTC/USD) und wie es nun weitergeht (?)
Reine Charbeschau ohne zusätzliche fundamentalen Begründungen, Erklärungen oder sonstigen Kommentaren. Hier nur der Chart, in welchem ja eigentlich alle zukünftigen Information "per heute" enthalten sein sollten:
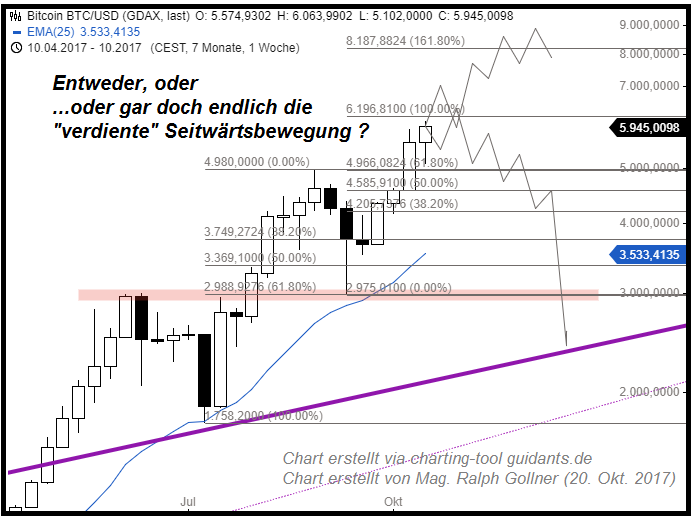
Ewas kryptische Sätze in ...
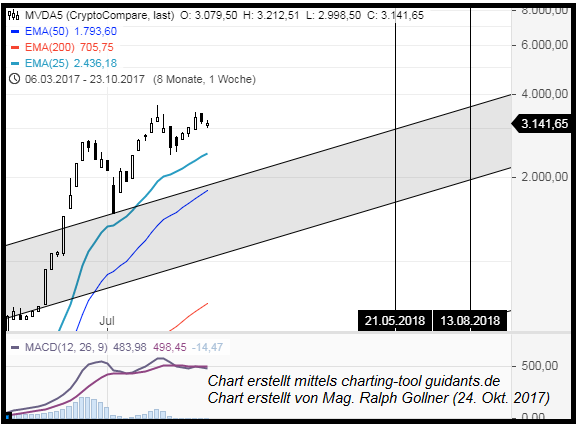
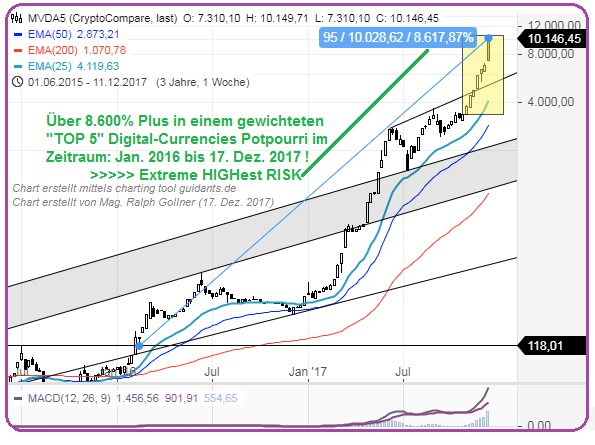
MVIS CryptoCompare Digital Assets 5 Index
The MVIS CryptoCompare Digital Assets 5 Index is a modified market cap-weighted index which tracks the performance of the 5 largest and most liquid digital assets. Most demanding size and liquidity screenings are applied to potential index...
...
EUR/USD
nach der Mario Draghi-Rede
Es tobt wohl ein "Fight" im EUR/USD zwischen der "fairen" Kaufkraftparität, welche (weit) über Kursen von 1,20 steht - einerseits und dem Druck auf den Euribor(s) andererseits. Aktuell herrscht wieder kurzfristig etwas...
...mehr Druck auf den Euro, nachdem ...
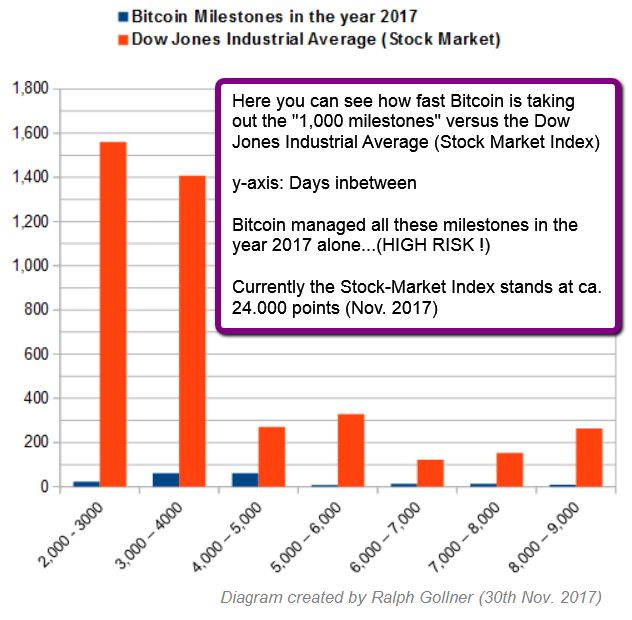
Milestones Bitcoin VERSUS Dow Jones Ind. Average
(Status: 30th Nov. 2017)
Here to wrap up, how many days it took the Dow Jones Industrial Average AND the Bitcoin (in the year 2017 alone) to reach another milestone (round numbers like 1k): The cryptocurrency was breaking through...
...
Bitcoin Market Value vs. some other sectors
Below the following table you will find the %-indications, what bitcoin would roughly equal as a percentage of the total value of the given sectors. The market sizes were taken from the "Money Project":
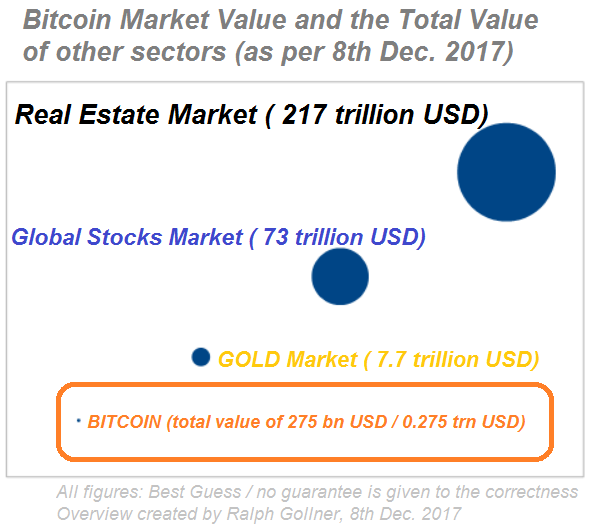
As mentioned here are the %-numbers:
♦ ...
MVIS CryptoCompare Digital Assets 5 Index
The MVIS CryptoCompare Digital Assets 5 Index is a modified market cap-weighted index which tracks the performance of the 5 largest and most liquid digital assets. Most demanding size and liquidity screenings are applied to potential index...
...
EUR/USD in the year 2017
The Bloomberg dollar index is on track for an annual decline of ca. 8.2%, though it has pared its drop from the more than 10% seen early in September. The dollar had surged to a 14-year high on 3rd January, including a 2017 low for EUR/USD at 1.0341. The Euro...
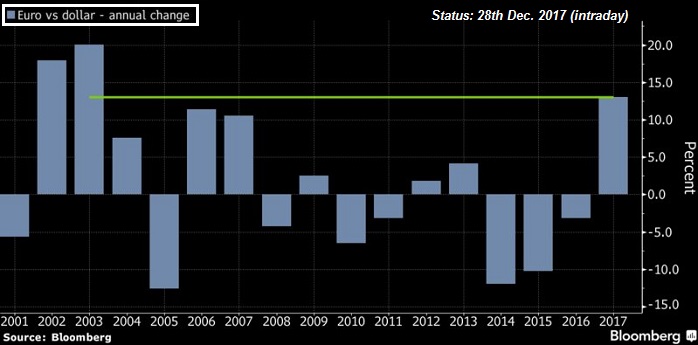
...
Bticoin (still > SMA200-daily)
"[Cryptocurrencies] are unlikely to disappear completely and could easily survive in varying forms and shapes among players who desire greater decentralization, peer-to-peer networks and anonymity, even as the latter is under threat," the report said, adding...
...
Bitcoin Mining Costs (potential floor?)
My calculations - derived from the sources given in the links below:
A Minimum Price for 1 Bitcoin (Intermediate time-frame) of ca. USD 7,500
(Status: 21st April 2018)
Searching for an intermediate floor for the Bitcoin-price may lead ones research to the ...
A study back-test for the cost of production proposed to >>>
value the digital currency bitcoin.
("Input costs")
Results from both conventional regression (and vector autoregression/VAR) models show that the marginal cost of production plays an important role in explaining bitcoin...
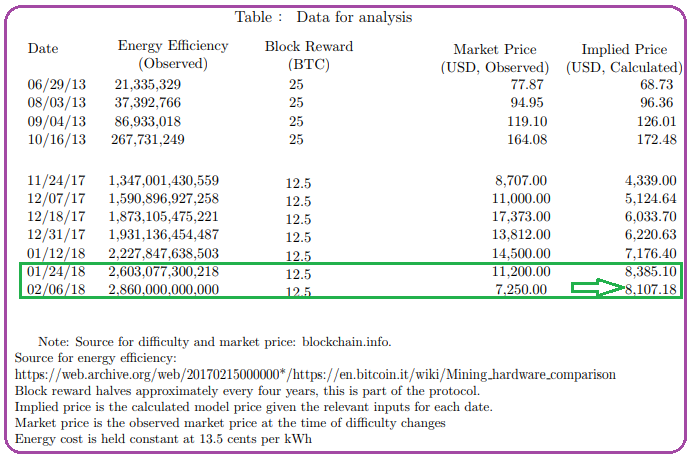
...


