Related Categories
Related Articles
Articles
Gold Ratios
There are two gold and silver miners indices frequently referred to: Philadelphia Gold and Silver miners index with ticker ^XAU (data since Dec 19, 1983) and the AMEX Unhedged Gold Bugs Index with ticker ^HUI (data since Jun 04, 1996).
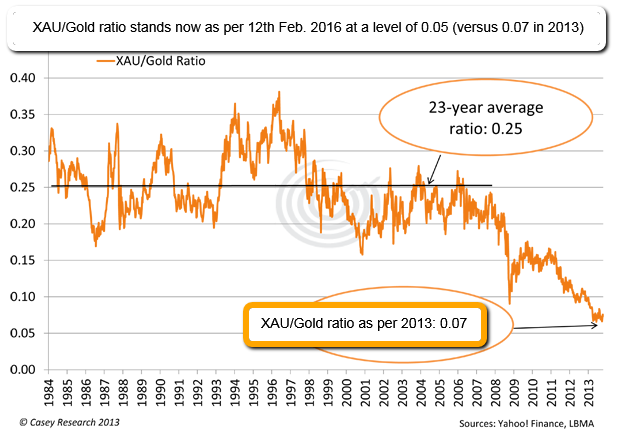 The Philadelphia Gold & Silver Index (XAU) is comprised of 30 international mining companies that began trading in December 1983. If you take the XAU and divide it by the price of gold, you get a relative value of miners to the price of gold. For example, at the quote in July 2015, gold was 1154 USD and the XAU was 59. >> Divide gold into the XAU, and get 0.051. In and of itself, that value carries no meaning. However, if you chart it over time, it becomes quite useful.
The higher the calculated number, the "more expensive" miners are relative to gold. The lower the number, the "cheaper" they are. Looking at the graph below (XAU Index over GOLD: long-term), you can see that during the current times (Q4-2015 up to Feb. 2016, "now"), miners are literally the cheapest they've ever been relative to gold since the index began trading 31 years ago.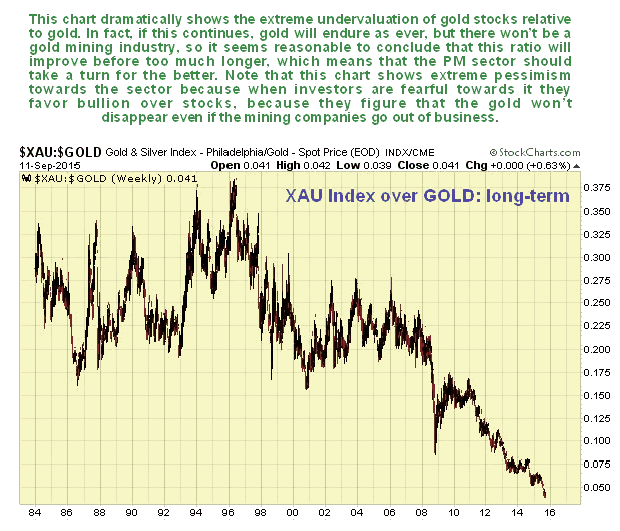
source: http://www.marketoracle.co.uk
please click for the daily updated chart on the XAU/Gold-ratio (stockcharts): http://stockcharts.com/h-sc/ui
one article-source: http://gwyde.blogspot.co.at


