Related Categories
Articles
GOLD
COT-Report (Large Speculators)
First, what is the COT report? The Commitment of Traders (COT) is a report published by the governing body of commodities trading in the United States, the Commodity Futures Trading...
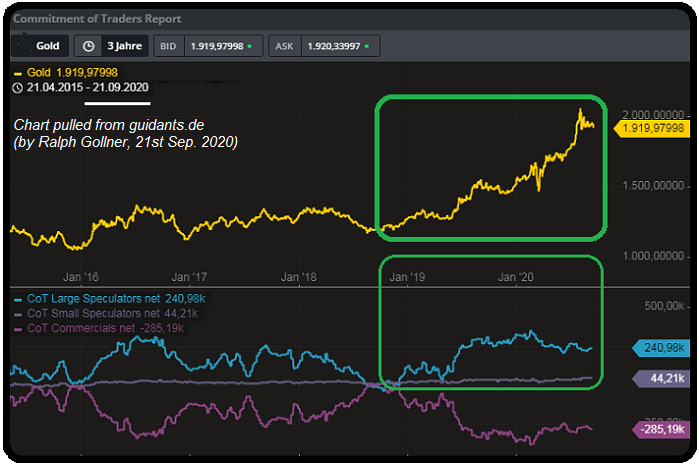
...Commission (CFTC). According to the CFTC's website, "The COT reports provide a breakdown of...open interest for futures and options on futures markets." But what does this mean in plain English?
The COT report shows which categories most (but not all) traders who engage in gold futures trading belong to. In the gold investment world, most discussions on COT focus ...
Historische DOW/GOLD-Ratio
Markante Hochpunkte hat es in folgenden Jahren gegeben: 1928, 1965 und 1999
Die DOW/GOLD-Ratio markierte in diesen Jahren folgende markante Hochpunkte: ca. 15, ca. 27, ca. 40
Aktuelle DOW/GOLD-Ratio im Q4-2017: ca. 18 (s. Chart)
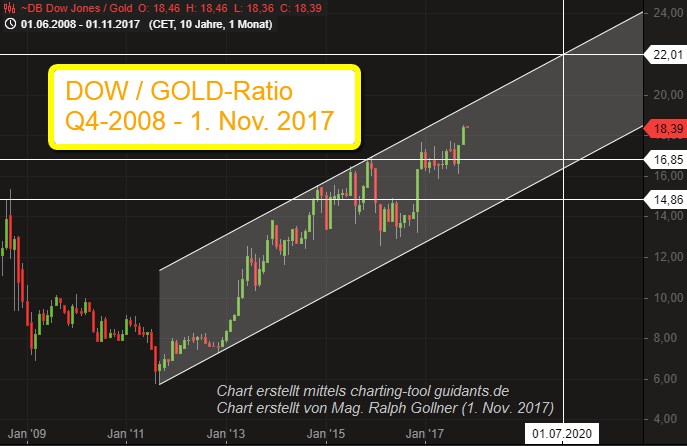
Platzen von Blasen / Gründe ( = Abrupte Umkehr des DOW/GOLD-Ratio Trendverlaufs aufgrund von):
♦ Überbewertung des Aktienmarktes
(bei gleichzeitigen Problemen/ z.B. Rezession im fundamentalen Unterbau: MAKRO- Umfeld inkl.)
♦ Übergewichtung von Aktien
siehe auch ein Kurzvideo unter folgendem youtube-link (Video bzgl. Historische ...
GOLD - Basiswissen (Sep. 2016)
Was hat den Gold-Kurs derart stark getrieben im bisherigen Jahresverlauf 2016? Inzwischen gibt es dafür eine simple Antwort: die Nachfrage. Nun mag das vielleicht banal klingen, weil doch fast immer Angebot und Nachfrage an der Börse den Preis bestimmen.
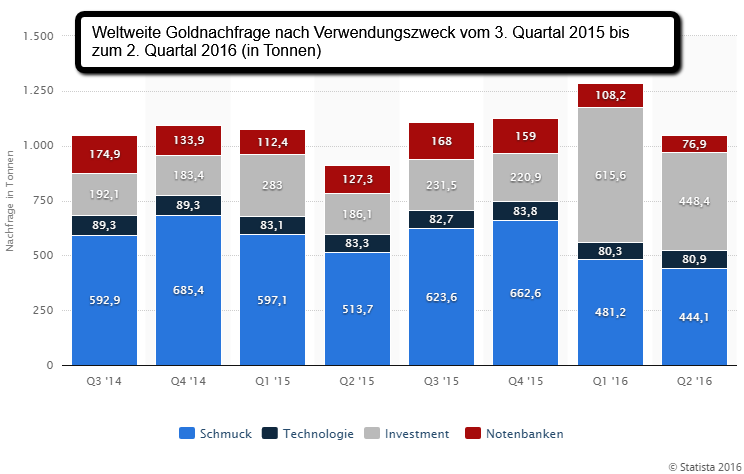
Doch (auch im obigen Schaubild) gibt es mittlerweile konkrete Zahlen dazu, die ich nicht vorenthalten will:
Nachfrage auf Rekordkurs
So wurden im Zeitraum von Januar bis März 2016 insgesamt ca. 1.290 Tonnen (t) des Edelmetalls nachgefragt und damit 21 Prozent mehr als im Vorjahreszeitraum (1.070,4 t) ...
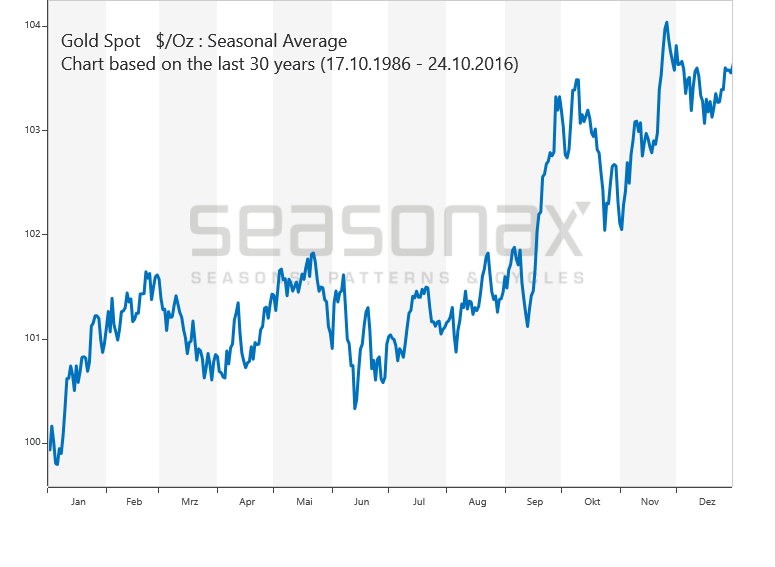
GOLD - Seasonality (30year-range)
From the 20 year-charts of Gold one may take following implicit/possible buy/sell-"rules" /Weakness and strength points. The 5-year to 30-year seasonal studies show following weakness points of gold: Mid March, Mid June and to lower extend Mid October.
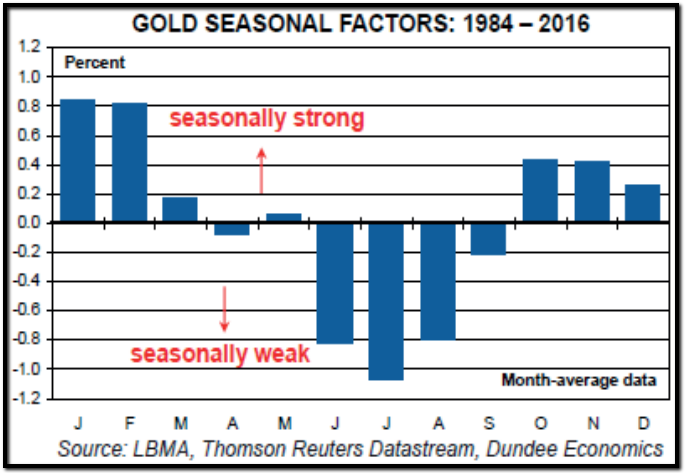
On the other hand, strength points might be ("are"): The "magic" 19th February, Early June, Mid September, Mid November as said: the best point in the year...
Speaking about a 20-year-chart of GOLD, one may take a closer look at following chart, covering the 20-year AND the 30-year-period in the ...
Gold-Turnaround im Q1-2016?
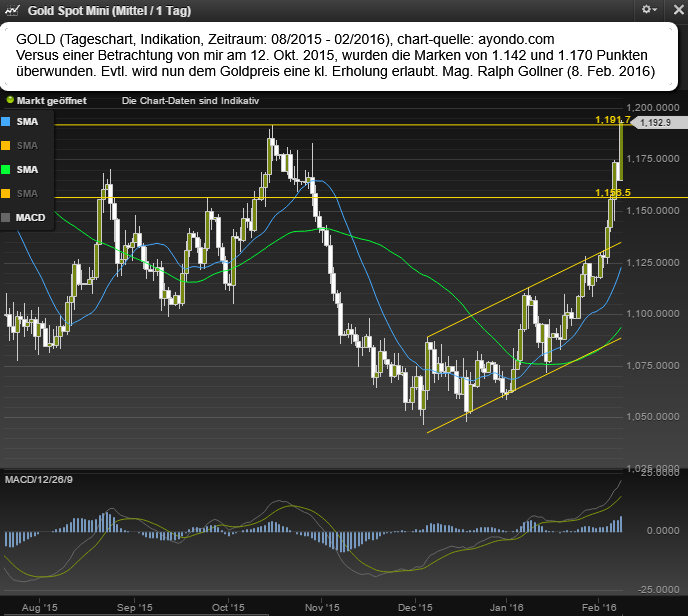
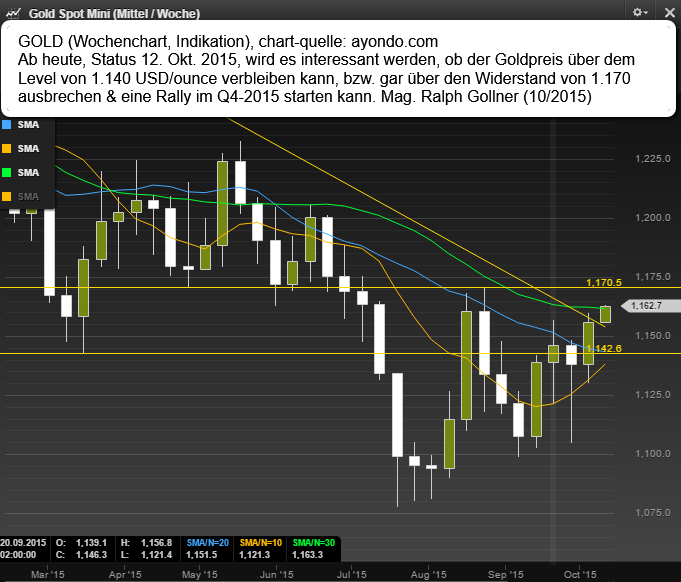
Gold-Stabilisierung oder gar Rally im Q4-2015?
Hedge Funds are holding First-Ever Gold Net-Short Position (July 2015)
After being net long all the way from USD 1900 to USD 1100, Bloomberg reports Hedge Funds Are Holding First-Ever Gold Net-Short Position.

Hedge funds are holding the first ever bet on a decline in gold prices since the U.S. government started collecting the data in 2006. (base-text by Mike Shedlock: / http://www.investing.com)
The funds and other speculators shifted to a net-short position of 11,345 contracts in New York futures and options in the week ended July 21, according to figures from the U.S. Commodity ...
Gold Seasonality (check out the 2nd half !)
source: seasonalcharts.com (30years history up to 2012)
As Dimitri Speck wrote in 2003 on the site http://www.gold-eagle.com there was no 'Gold: Second Half Increase' during the second half of the 1990s. Gold fell during those years. More, it is being manipulated by order of the central banks. Thus one cannot judge accurately, whether this seasonal pattern is valid at present.
NO NEED TO GET STRESSED ON GOLD !
Related Articles
Gold Ratios
There are two gold and silver miners indices frequently referred to: Philadelphia Gold and Silver miners index with ticker ^XAU (data since Dec 19, 1983) and the AMEX Unhedged Gold Bugs Index with ticker ^HUI (data since Jun 04, 1996).
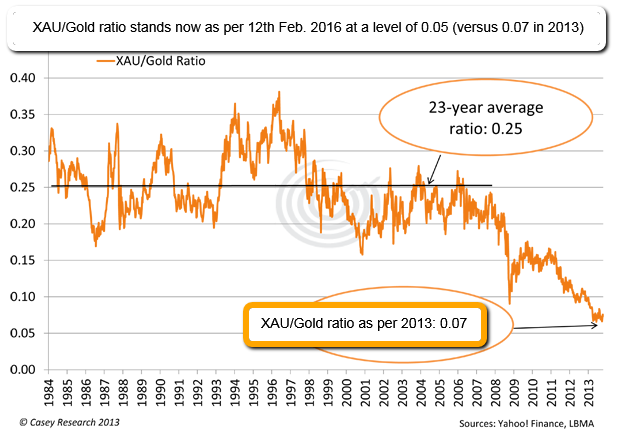 The Philadelphia Gold & Silver Index (XAU) is ...
Silber (2003 - April 2016)
Silber profitiert Marktbeobachtern zufolge von einer Wiederbelebung der Industrienachfrage insbesondere in China. Und mehr als die Hälfte der Nachfrage nach dem „Edelmetall des kleinen Mannes“ stammt aus diesem Bereich.
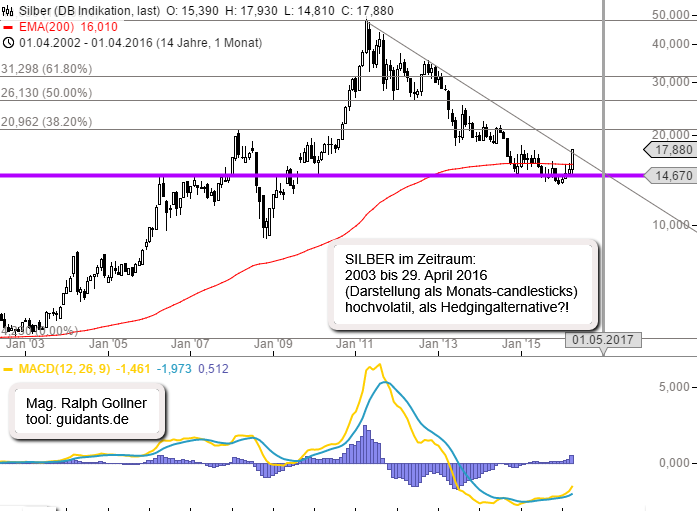
Silber wird beispielsweise in Legierungen, ...
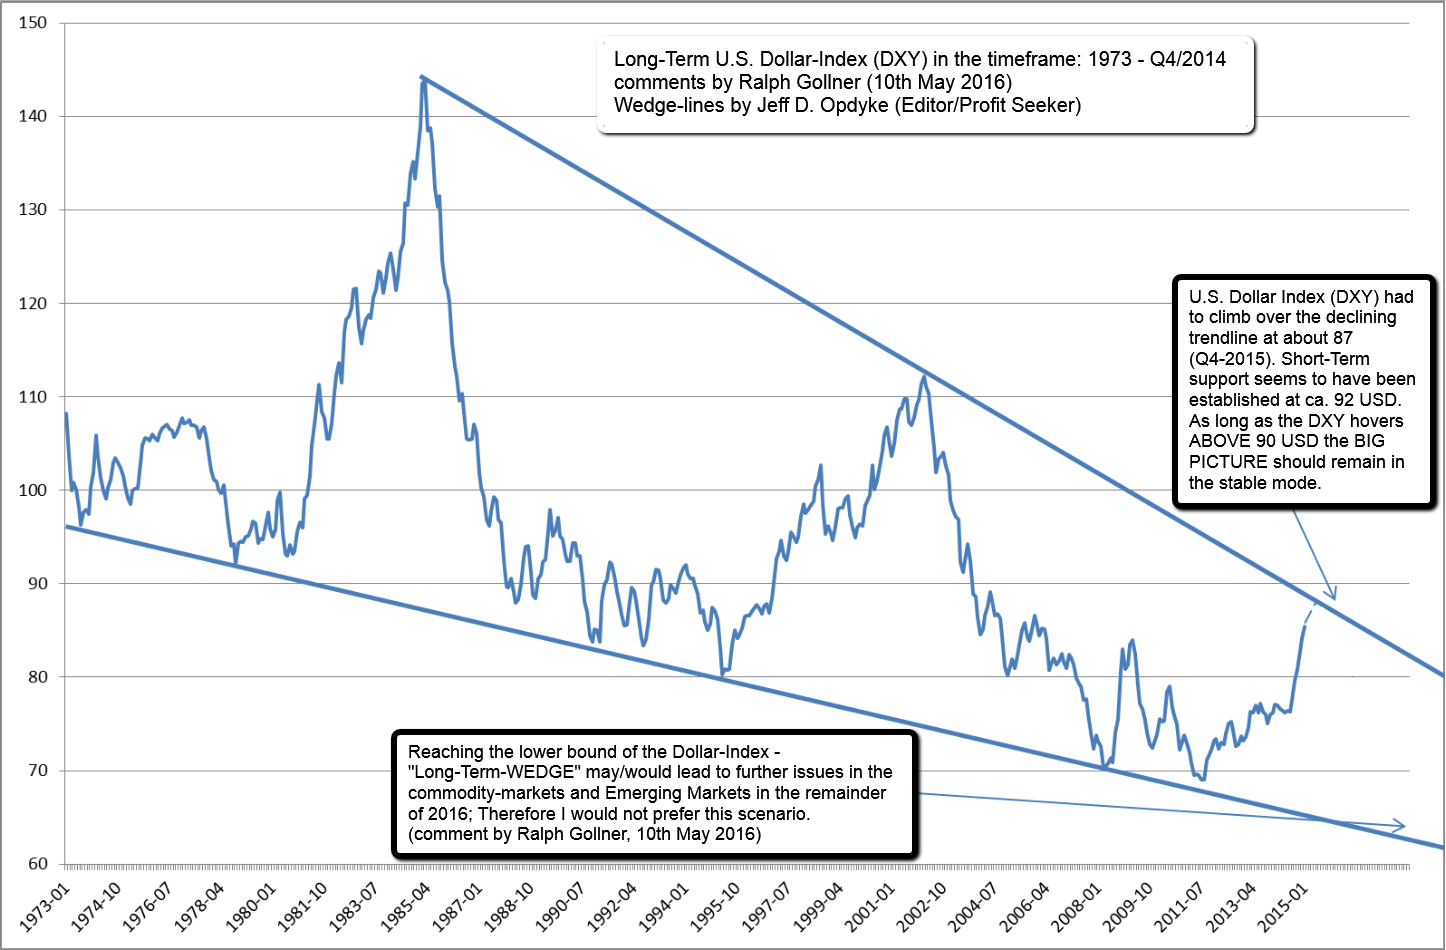
U.S. Dollar Index (DXY, 1973 - 2015)
To stock market technicians, the Long-Term Chart below is the mother of all "descending wedge" patterns. It's the U.S. Dollar Index, as measured and reported monthly by the Treasury Department, going back more than four decades.
 Please click for the BIG ...
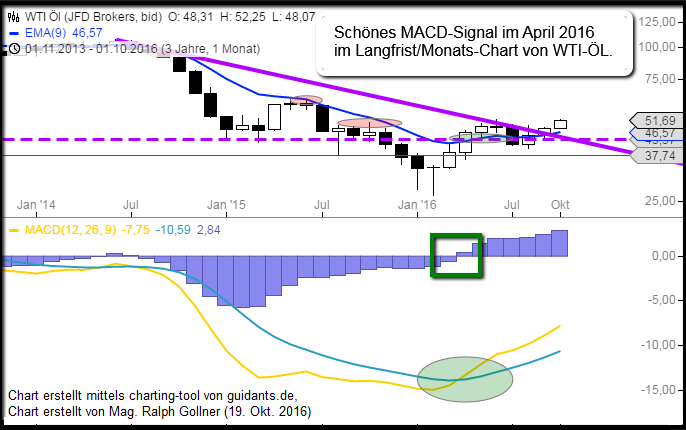
Oil (WTI)
Die durch den Fracking-Boom in den USA mitausgelösten Überkapazitäten bei der Ölproduktion belasteten seit Sommer 2014 massiv den Ölpreis. Zuletzt führten Förderkürzungen aber wieder zu einer Stabilisierung.
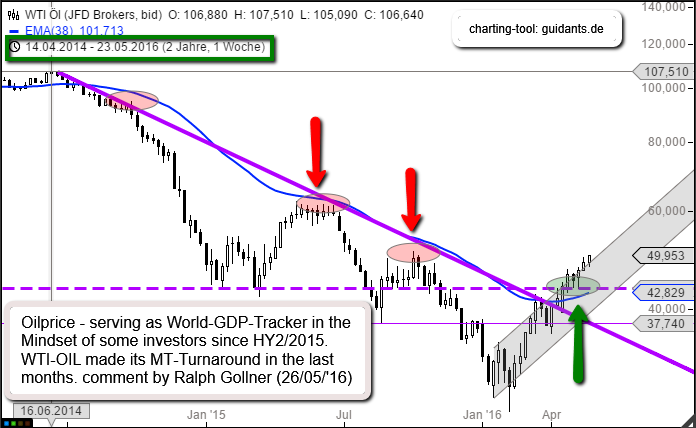
So sind die Rohöllagerbestände in den USA sind in der vergangenen Woche ...
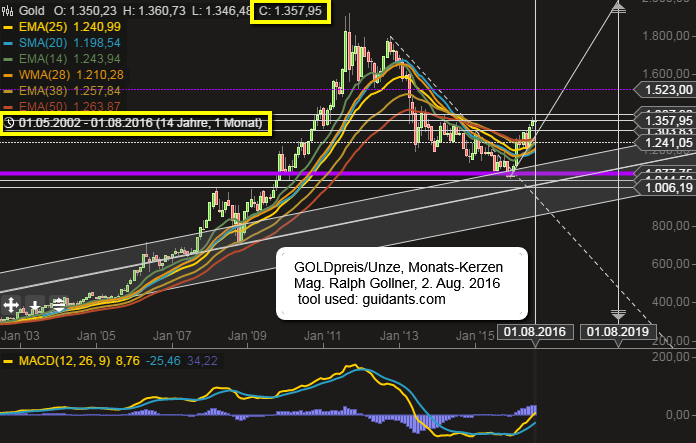
Gold (2003 - Aug. 2016)
Solange der Goldpreis über 1.300 USD, bzw. zumindest 1.241 USD notiert, bzw. gar weiter ansteigt, erscheint GOLD in Zeiten wie diesen (Unsicherheit durch Geopolitik, Notenbankpolitik) eine sinnvolle Ergänzung.
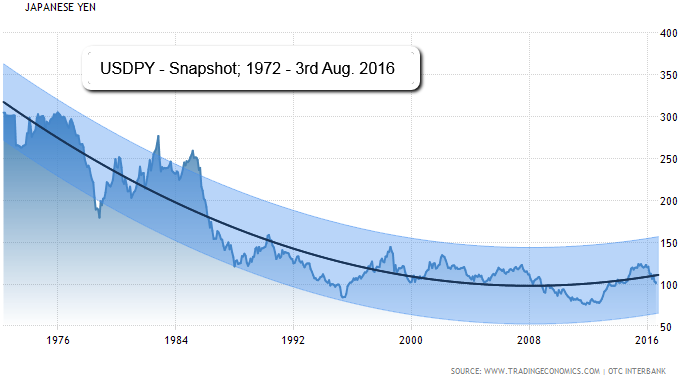
USDJPY (1972 - 3rd Aug. 2016)
For the most part, as goes the Yen over the past several years, so goes the carry trade - and risk-on assets. For example, the relationship between the Yen and equities has been very tight (on an inverse basis) over the recent years.
The relationship between ...
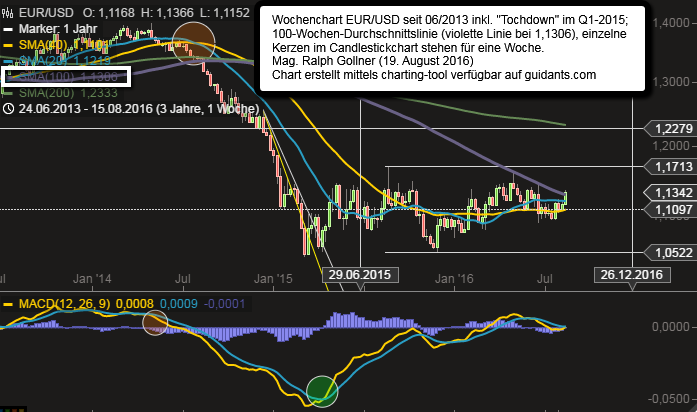
EUR/USD > 1,10 (Aug. 2016)
WTI-Öl (MACD-Signal im April 2016)
Monatschart
U.S. Dollar Index (DXY) above magic 100-level
The dollar rolled higher versus major rivals following upbeat data on durable goods orders and maintained gains after minutes of the Federal Reserve's November policy meeting...
...reinforced expectations for a December rate increase. The U.S. ...
10year US, 2year US (study on FX-impact)
Very theoretic, but good to think about it; most recent yield steepness observed (rising since several weeks already). For information purposes: Shaded areas indicate U.S. recessions in the last decades.
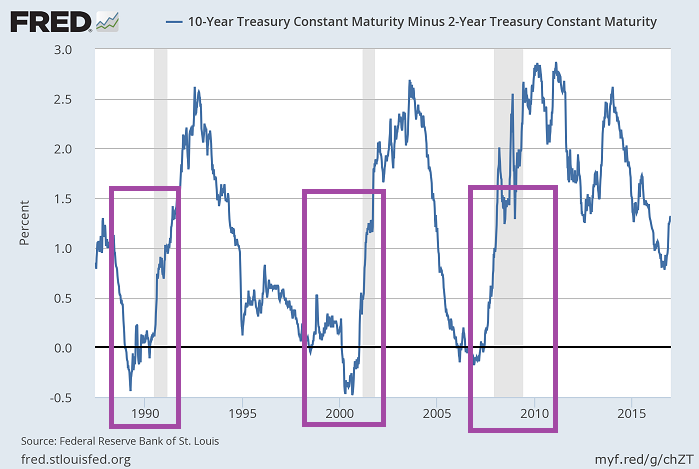
Important to know also, that from a rising ...
Cryptocurrencies (Bitcoin, etc.)
Just for Info; HIGH (!!) RISK; At approximately 10:20 a.m. Eastern time on Thursday (2nd March 2017), the price of Bitcoin climbed to USD 1,241.30 which was an all-time high for the digital currency. At the same time, the spot price of gold sat...
...
PPP (EUR/USD) - "fair" Value?
Die Frage stellt sich, ob und wie sich die aktuelle Inflationsdifferenz USA/Euroland auf den Kursverlauf des Euro/Dollar auswirken wird. Hier kommt die Realzinsdifferenz ins Spiel, die sowohl die Zins- als auch die Inflationsdifferenzberücksichtigt.
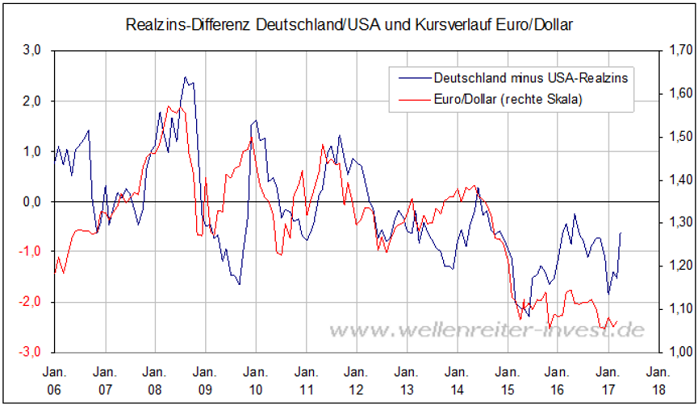
Gerechnet ...
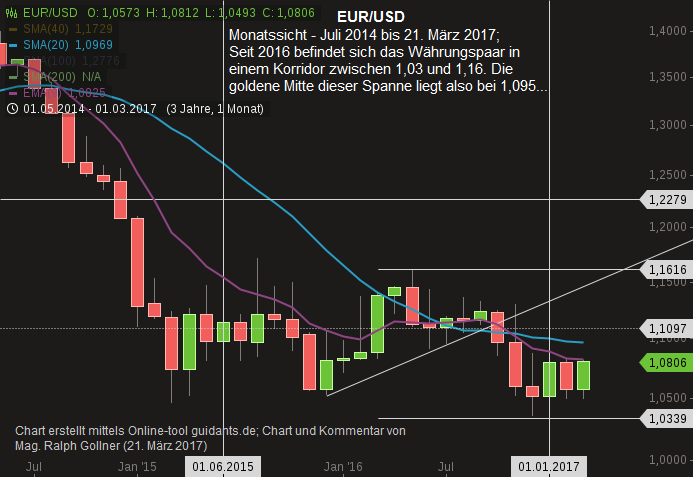
EUR/USD-Snapshot (März 2017)
Folgend einem Interviewduell zwischen den französischen Präsidentschaftskandidaten und den möglichen Gerüchten bzgl. eines möglichen (!) Auslaufens der expansiven EZB-Notenbankpolitik erstarkt der Euro wieder etwas...
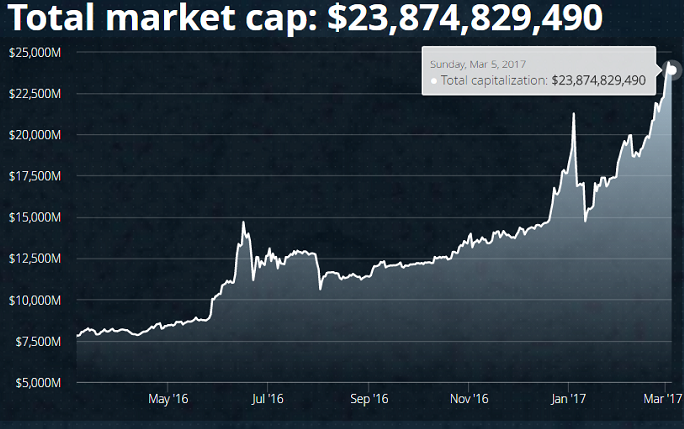
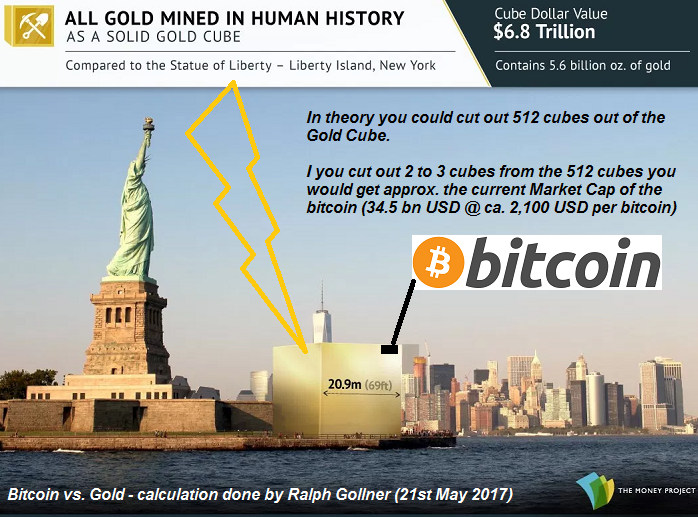
Bitcoin versus Gold ("Global Market Cap")
The last time I mentioned Bitcoin on my site (6th March 2017), the price of Bitcoin climbed to USD 1,241. Some hours ago, Bitcoin passed the USD 2,000 level. Just for Info; HIGH (!!) RISK !
Disclaimer/Disclosure: Ralph Gollner hereby declares, that ...
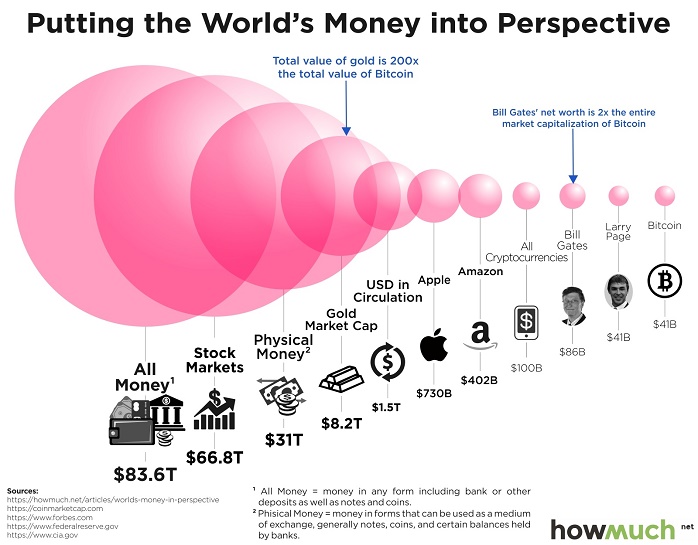
This chart should put the size of bitcoin in perspective
Intro: Bill Gates's net worth still beats bitcoin's entire market cap; HowMuch.net on 21st June 2017 put things into perspective and demonstrated that for all the buzz and excitement bitcoin has generated, it still has a long way to...
 ...
...
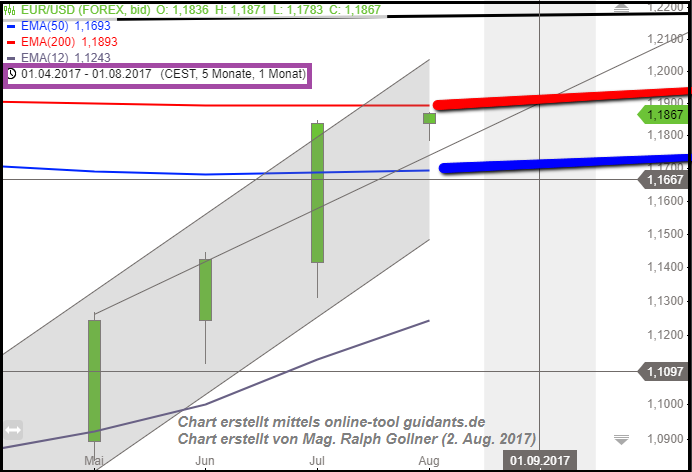
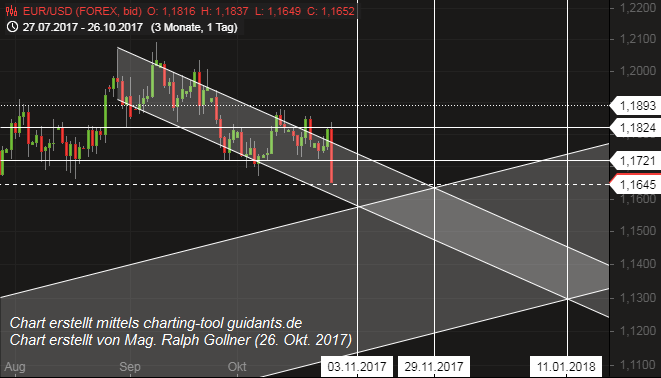
EUR/USD in der Nähe von 1,19
Folgend der sehr langfristigen Durchschnittslinie auf Monatsbasis (EMA 200) befindet sich nun der Euro versus USD in einer spannenden technischen Region ("extreme resistance" zw. 1,185 bis 1,215).
link:
It's all about the "Euro" ?
www.zerohedge.com/news/2017-08-02
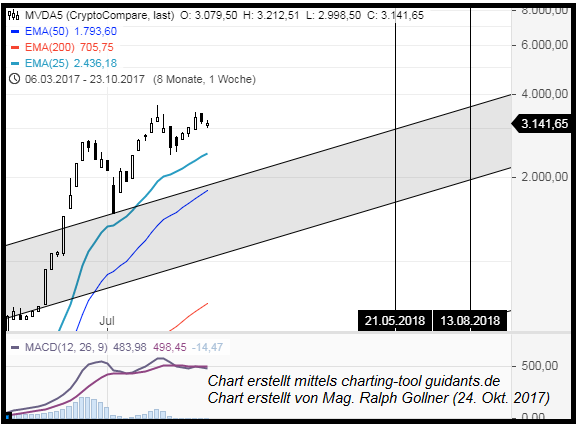
Bitcoin (BTC/USD) und wie es nun weitergeht (?)
Reine Charbeschau ohne zusätzliche fundamentalen Begründungen, Erklärungen oder sonstigen Kommentaren. Hier nur der Chart, in welchem ja eigentlich alle zukünftigen Information "per heute" enthalten sein sollten:
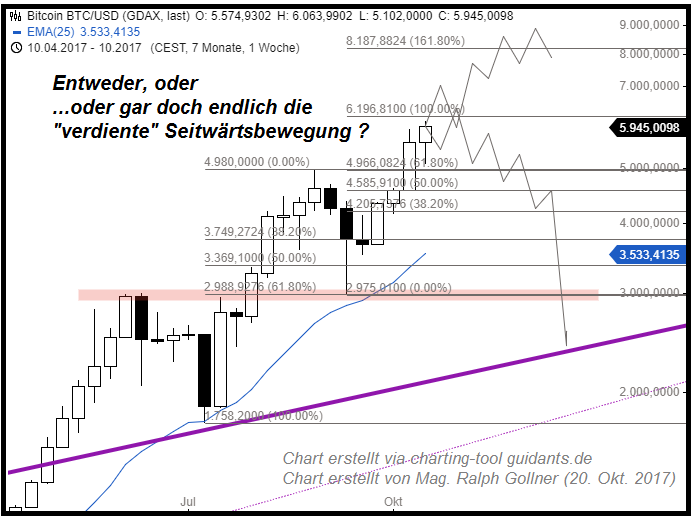
Ewas kryptische Sätze in ...
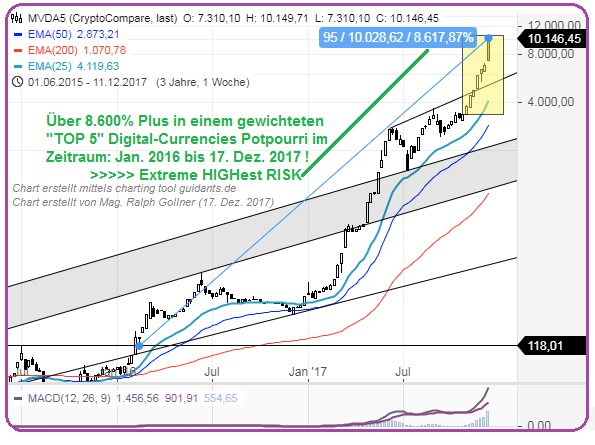
MVIS CryptoCompare Digital Assets 5 Index
The MVIS CryptoCompare Digital Assets 5 Index is a modified market cap-weighted index which tracks the performance of the 5 largest and most liquid digital assets. Most demanding size and liquidity screenings are applied to potential index...
...
EUR/USD
nach der Mario Draghi-Rede
Es tobt wohl ein "Fight" im EUR/USD zwischen der "fairen" Kaufkraftparität, welche (weit) über Kursen von 1,20 steht - einerseits und dem Druck auf den Euribor(s) andererseits. Aktuell herrscht wieder kurzfristig etwas...
...mehr Druck auf den Euro, nachdem ...
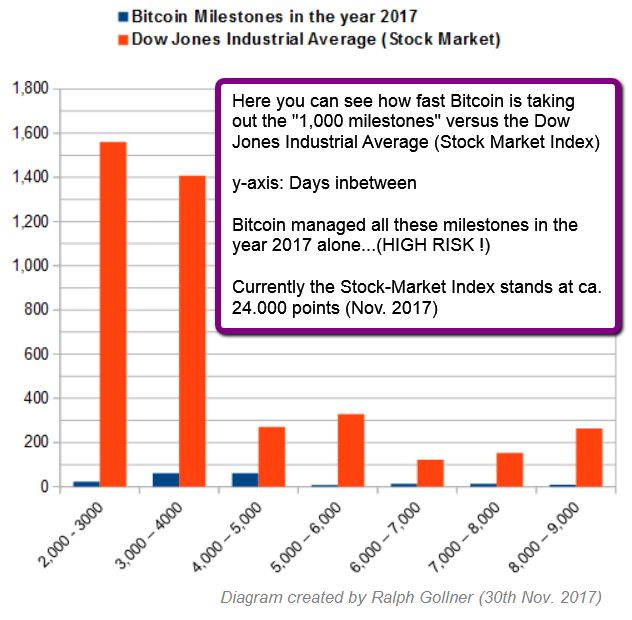
Milestones Bitcoin VERSUS Dow Jones Ind. Average
(Status: 30th Nov. 2017)
Here to wrap up, how many days it took the Dow Jones Industrial Average AND the Bitcoin (in the year 2017 alone) to reach another milestone (round numbers like 1k): The cryptocurrency was breaking through...
...
Bitcoin Market Value vs. some other sectors
Below the following table you will find the %-indications, what bitcoin would roughly equal as a percentage of the total value of the given sectors. The market sizes were taken from the "Money Project":
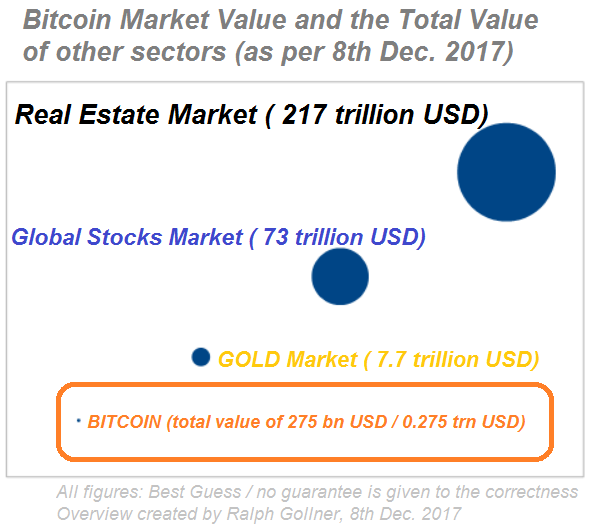
As mentioned here are the %-numbers:
♦ ...
MVIS CryptoCompare Digital Assets 5 Index
The MVIS CryptoCompare Digital Assets 5 Index is a modified market cap-weighted index which tracks the performance of the 5 largest and most liquid digital assets. Most demanding size and liquidity screenings are applied to potential index...
...
EUR/USD in the year 2017
The Bloomberg dollar index is on track for an annual decline of ca. 8.2%, though it has pared its drop from the more than 10% seen early in September. The dollar had surged to a 14-year high on 3rd January, including a 2017 low for EUR/USD at 1.0341. The Euro...
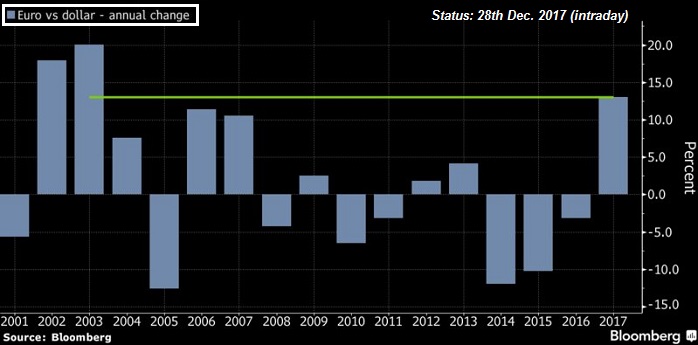
...
Bticoin (still > SMA200-daily)
"[Cryptocurrencies] are unlikely to disappear completely and could easily survive in varying forms and shapes among players who desire greater decentralization, peer-to-peer networks and anonymity, even as the latter is under threat," the report said, adding...
...
Bitcoin Mining Costs (potential floor?)
My calculations - derived from the sources given in the links below:
A Minimum Price for 1 Bitcoin (Intermediate time-frame) of ca. USD 7,500
(Status: 21st April 2018)
Searching for an intermediate floor for the Bitcoin-price may lead ones research to the ...
A study back-test for the cost of production proposed to >>>
value the digital currency bitcoin.
("Input costs")
Results from both conventional regression (and vector autoregression/VAR) models show that the marginal cost of production plays an important role in explaining bitcoin...
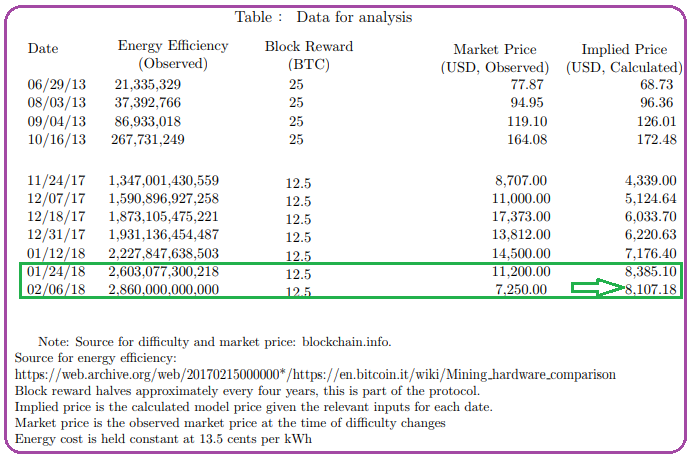
...


