Related Categories
Articles
Binance coin (BNB) > 350 BUSD (US-Dollar ;-)
I am a Binance-token (BNB) buyer since many quarters and I am holding BNBs for some years already ( = Disclosure). I want to give you a brief snapshot on the Status-Quo review of the current Chart-Situation:
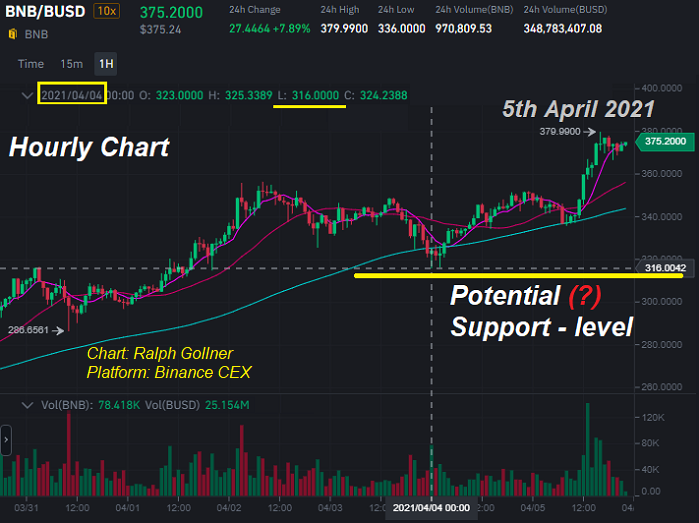
In these two charts the status of the BNB-price evolution is clearly supported by the hourly average (99periods). I am currently thinking about adding some more BNB to my position.
In the next chart one can clearly seen some more volume-driven action within the last days and hours. The BNB-token really took off again at the End of ...
SMALL CAPS on the run :-)
Die bekannteste Faktorprämie bei Aktien ist die "Small-Size-Prämie", oft auch nur "Size-Prämie" oder "Small-Cap-Prämie" genannt. Sie besagt, dass kleine börsennotierte Unternehmen (gemessen an ihrer Marktkapitalisierung) im Durchschnitt höhere Aktienrenditen...
... produzieren als große Unternehmen bzw. der Gesamtmarkt ("RUT" im obigen Chart steht für den US-Amerikanischen Small Cap-Index "Russel 2000").
Durch rein mechanisches, diszipliniertes Übergewichten von Faktorprämien in einem Portfolio ist es möglich, gegenüber dem Gesamtmarkt eine Zusatzrendite ...
years 1954, -58, -85, -89 (S&P 500 in 2020?)
US-Stock Market History
With an open mind and the current FED-Policy one even has to think about the "unthinkable". Let's take a look at similar historical "Advance/Decline Breadth"-Trends on a monthly basis and the year after - the...
year 1989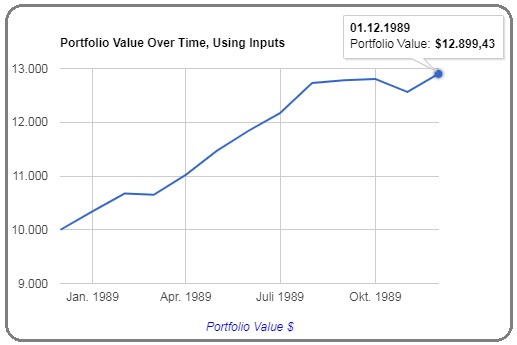
In the year 1989 an investment of USD 10k would have gone up to USD 12,899
...same occurence like we were just experiencing now in Q4-2019.
year 1985

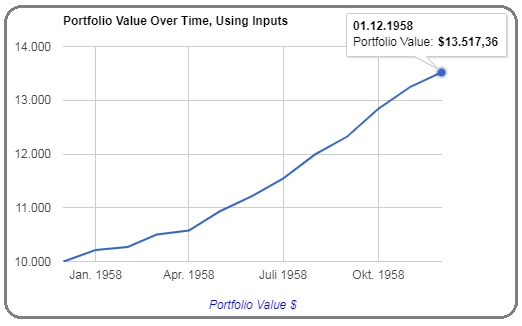
year 1958
...and last but not least, one of the first "easy" years of Mr. Buffet, 1954:
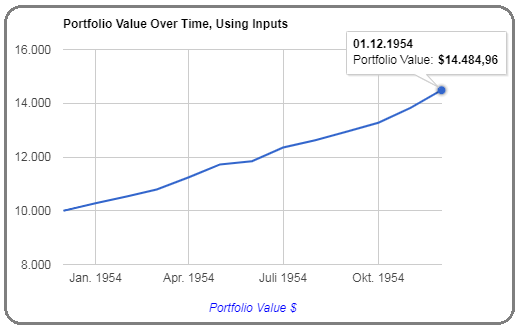
Charts created by Ralph Gollner via ...
Profitabilitäts-Kennzahlen (USA vs. Rest)
Aus dem aktuellen "JP Morgan-2020 Bericht" lassen sich interessante Einsichten gewinnen. Hier eine starke Aussage, unterlegt mit Zahlen. USA-Unternehmen sind einfach extrem profitabel, versus Europa beispielsweise.
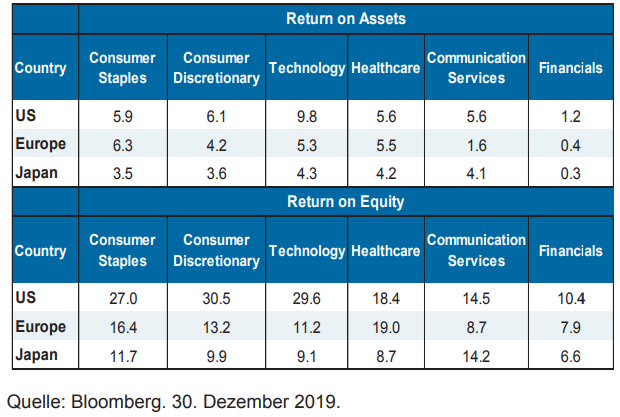
Es wird spannend werden, ob der US-amerikansche Aktienmarkt im Licht solch starker "profitability metrics" gegenüber anderen Aktienmärkten wie Europa allgemein oder Japan drastisch in's Hintertreffen kommen kann.
link zum JP Morgan-Bericht:
https://privatebank.jpmorgan.com/gl/de/insights
Chongqing
Haben Sie zum Beispiel schon einmal von Chongqing gehört (fragt die österr. Tageszeitung "KURIER"?) Die zentralchinesische Metropole ist mit mittlerweile mehr als 33 Millionen Menschen die einwohnermäßig größte Stadt der Welt. Die Metropole...
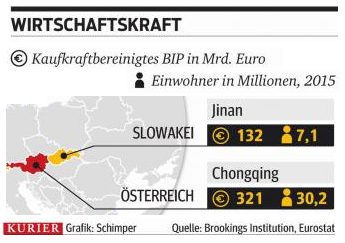
...liegt am Zusammenfluss von Jangtse und Jialing.
Bisher richtete sich das Augenmerk doch bisher auf Hongkong, Shanghai und Peking. Aber den Namen Chongqing sollte man sich merken. Das Verwaltungsgebiet von Chongqing entspricht in etwa der Fläche Österreichs - und auch die Wirtschaftsleistung ist mit jener der Alpenrepublik ...
Künstliche Intelligenz und Bilderkennung
Die Irrtumswahrscheinlichkeit bei der ("automatischen") Bilderkennung sinkt dramatisch in den letzten Jahren (siehe fallende Fehlerkurve -in Prozent- im Chart anbei):
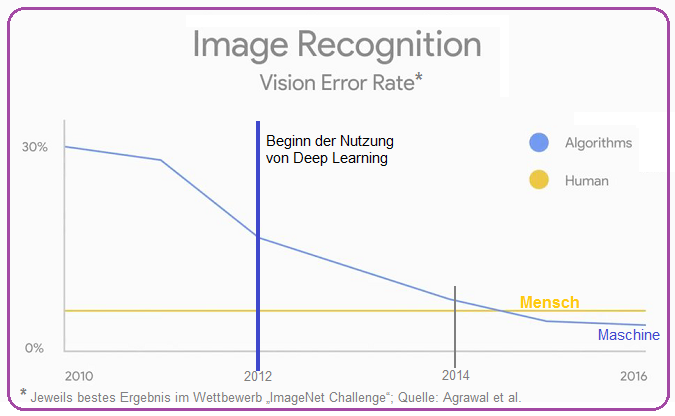
Some words on Machine learning (Figure above; Original text in English)
Machine learning represents a fundamental change from the first wave of computerisation. Historically, most computer programs were created by meticulously codifying human knowledge, mapping inputs to outputs as prescribed by the programmers. In contrast, machine-learning systems use categories of general ...
Asset management in China
(years 2018 - 2030)
Asset management in China is a young industry and, as a consequence, Chinese investors, intermediaries and asset managers are not constrained by legacy infrastructure, regulatory frameworks and...
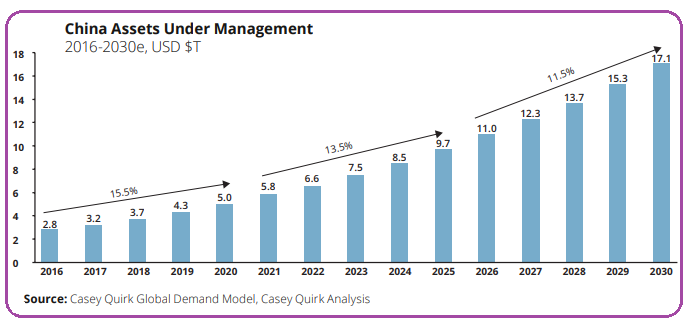
...investment approaches. New thinking can be seen in the proliferation of investment strategies, products and distribution approaches.
China is the only large, multi-trillion dollar market that has seen net new flows in excess of 30% per year. One can expect Chinese growth rates to average 15% per year through 2025, moderating to 12% per year ...
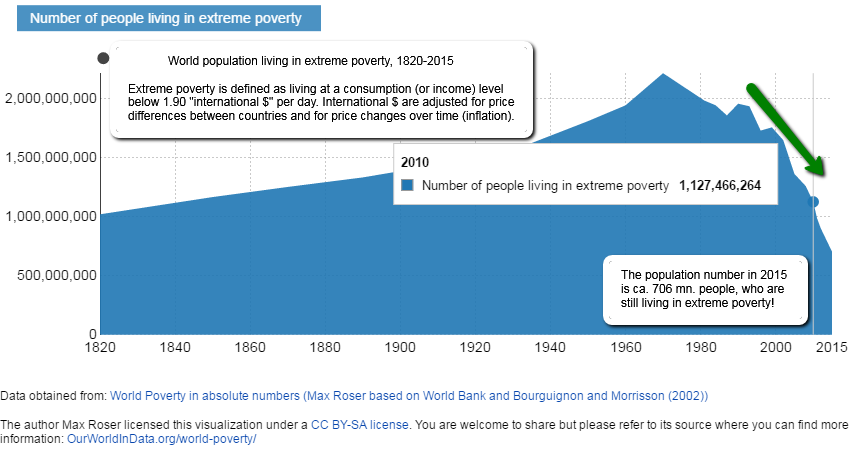
Affordable living for the majority
(on the right path?)
Please recheck the evolution over the last decades:
I guess globally (!) we are taking steps in the right direction, time will tell how fast we can push these developments forward!!
Measuring poverty
Measuring poverty is difficult because it requires making a sharp distinction between those who are and aren't considered poor. So when we see that global extreme poverty is going down, it is natural to ask ourselves: Are these reductions produced by a definition of "extreme" poverty which is too low?
Well, fact is: The global ...
Immo-Kaufpreis
versus
Immo-Finanzierung
Bei den meisten Entscheidungen zu Finanzthemen, welche -insbesondere- die ungewisse Zukunft betreffen ist eine umfassende Prüfung verschiedener Einflussfaktoren eine sehr gute Idee...so auch unbedingt bei der "Immobilienfrage". In dieser folgenden...

...Grafik sieht man -vereinfacht gesagt- die, für den ImmoKäufer wohl relevante, Zinsentwicklung in den letzten Dekaden, und zwar jeweils der Stand zum Jahresende (außer 2017). Betrachtet man die letzten knapp 20 Jahre seit 1996, so betrug der Durchschnittszins bei zehnjähriger Zinsbindung etwa 4,7 ...
Steigendes Dreieck - Interessantes Chartmuster
Im Aktienhandel ist die Charttechnik manchmal eine gute Hilfe. Weil der Kurs oft den gleichen Gesetzmäßigkeiten am Markt folgt, kann man anhand verschiedener Formationen erkennen, wie es...

...weitergehen könnte und wann der beste Zeitpunkt für Käufe oder Verkäufe sein könnte.
Dreiecke sind wohl am einfachsten zu erkennen. Ein aufsteigendes Dreieck ist in der Charttechnik die Bestätigung für einen Trend. Die mögliche Strategie: "Zuschlagen", sobald sich die Kursbremse löst. Ein aufsteigendes Dreieck entsteht, wenn der Kurs über einen ...
Austria (Exports in the period: 1900 - 1933)
"Unemployment"
The number of tourists visiting Austria rose by 82 % from 1923 to 1929/1930. Of course, the onset of the world economic crisis stopped this favourable development. Tourism proved highly sensitive to the effects of recession. The...
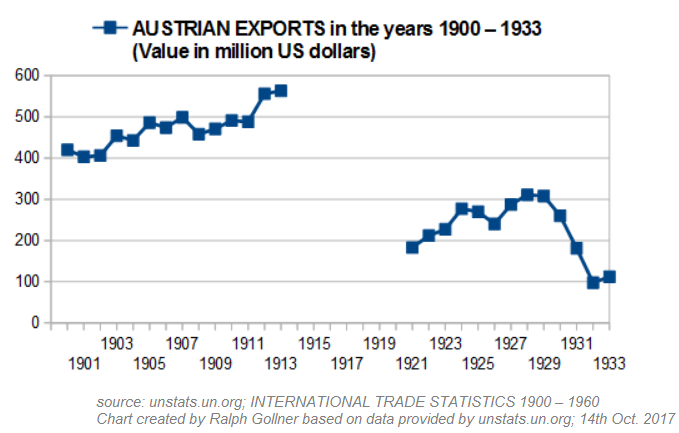
...following development in the First Republic-History of Austria clearly demonstrates the important connections between economic decline and political destabilisation, on the one hand, and the loss of national independence, on the other. The review of circumstances leading to disastrous outcomes ...
Inflation und Dein Geburtsjahr
Wir nehmen Inflation meistens dadurch wahr, dass alles teurer wird. Aber eigentlich beschreibt der Begriff nicht die Preise, sondern den Wert unseres Geldes. Und das verdeutlicht sich am besten an einer langen Zeitleiste:
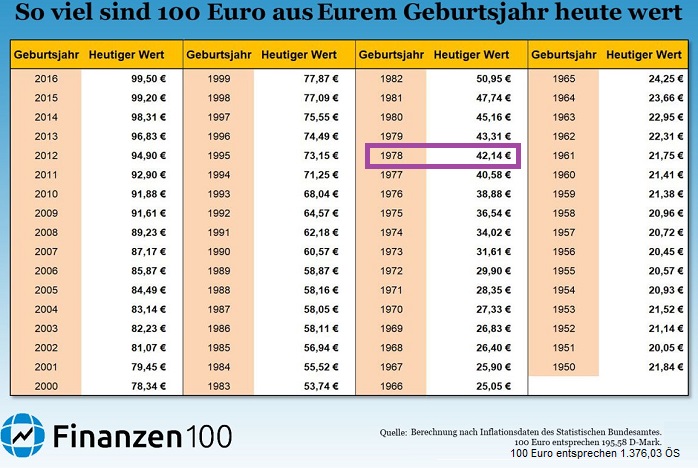
Deutschland-Fokus: Folgend den Inflationsdaten in Deutschland besitzen (dort) 100 Euro aus dem Jahr der Euro-Einführung 2002 heute nur noch einen Wert von 81,07 Euro. Insgesamt liegt die durchschnittliche jährliche Inflation in Deutschland seit 1950 bei 2,4 Prozent pro Jahr.
In Deutschland war die schlimmste Inflations-Phase seit dem ...
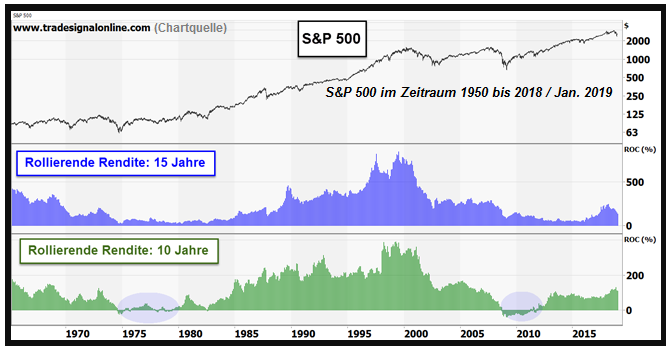
Deconstructing 30 Year Stock Market Returns
& "Gimmick"
One of the most impressive long-term stock market statistics has to be the historical 30 year returns on the S&P 500: this graph shows the rolling annual 30 year returns from the corresponding start dates. The worst 30 year...
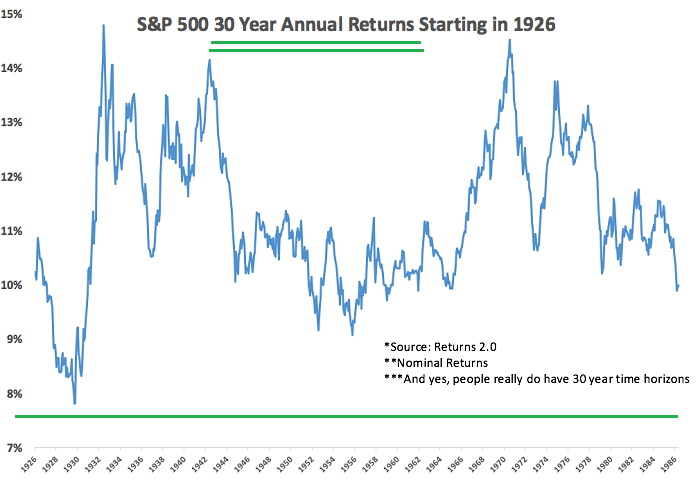
...return - using rolling monthly performance - occurred at the height of the market just before the Great Depression and stocks still returned almost 8% per year (!) over the ensuing three decades.
If you break things down into non-overlapping periods there have really only been three separate 30 year ...
EM Fund Inflows
(Status: 9th Feb. 2017)
According to the latest fund flow report from BofA's Michael Hartnett, "it's risk-on in Bonds, it's inflation-on in Stocks, and EM is now playing role of cyclical catch-up trade." First in bonds, there has been renewed interest in EM debt...
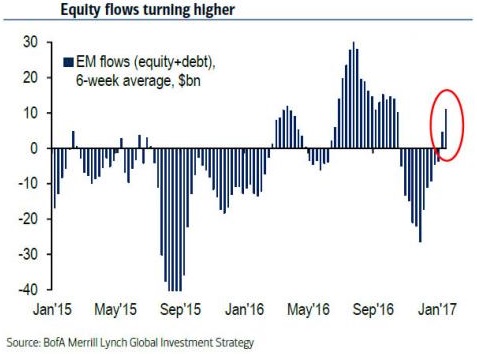
...(inflows 5 of past 6 weeks), and 9th consecutive week of inflows to TIPS ($1bn…biggest week for TIPS since Trump election). Then, in stocks there has been inflows to equity funds investing in value, Europe, Japan (like TIPS, largest week of inflows for Japan since election), materials, and financials.
...
Bitcoin @ USD 1,000
As 2017 kicked off, and with the bulk of other financial markets closed, Bitcoin took the stage, hitting a fresh milestone atop USD 1,000.
A single Bitcoin was trading at USD 1,025 Monday morning (2nd Jan. 2017), according to pricing data from Coin Market Cap. Other big exchanges such as Bitfinex, Kraken and Coinbsae showed the cryptocurrency topped USD 1,000 late Sunday (31st Dec. 2016), according to a report from Bitcoin.com.
The cryptocurrency looked set to reach USD 1,000 in the waning days of 2016, after taking out a key level above USD 800 in early December. ...
Live-Seminar, Teilnahme möglich am
22. Nov. 2016 (Operngasse 17-21, 1040 Wien, WKO-Gebäude)
ODER
24. Nov. 2016 in Wien (Operngasse 17-21, 1040 Wien)

Vortagender/Seminarleitung: Mag. Ralph Gollner
Tagesablauf/1. Teil (Längere Einleitung/interessante Details)
2. Teil (Die wichtigsten Infos/AUCH für die dann später Hinzukommenden/Berufstätigen)
Seminarkosten: 79,- Euro (inkl. UST)
(inkl. Verpflegung, Mittagessen = "a real/nominal Spot-Price", Spott-Preis)
WLAN inkl. (=> somit LIVE-Crosscheck des Vorgetragenden, bzw. interaktives "Mitmachen" möglich, ansonsten Gruppenspiele, Diskussionen, ...
GDP-Growth for Everyone (Poverty)
The world has an astonishing chance to take a billion people out of extreme poverty by 2030. In 1990, 43% of the population of developing countries lived in extreme poverty (then defined as subsisting on $1 a day); the absolute number was 1.9 billion people.
 Here a statistics on $ 1.9 as reference-point: https://ourworldindata.org/world-poverty
By 2000 the proportion of people in developing countries living in extreme poverty was down to a third. By 2010 it was 21% (or less than 1.2 billion; the poverty line was then $1.25, the average of the 15 ...
US Media Ad Spending (2014-2020)
Next year (2017) will mark a major milestone for ad spending, as total digital surpasses TV for the first time. In 2017, TV ad spending will total USD 72 billion, or 35.8% of total media ad spending in the US.
 source: eMarketer’s newest quarterly ad spending forecast (Q1/2016)
Meanwhile, total digital ad spending in 2017 will equal $77.37 billion, or 38.4% of total ad spending. In the long term, TV ad spending will continue to grow by about 2% a year. But by 2020, TV ad spending’s share will drop below one-third of total media ad spending for the first ...
Banking Stocks (US)
Banks are the backbone of every economy. It is very important that banks remain healthy financially, otherwise a financial crisis can hit a country leading to a recession like the US in 2008.
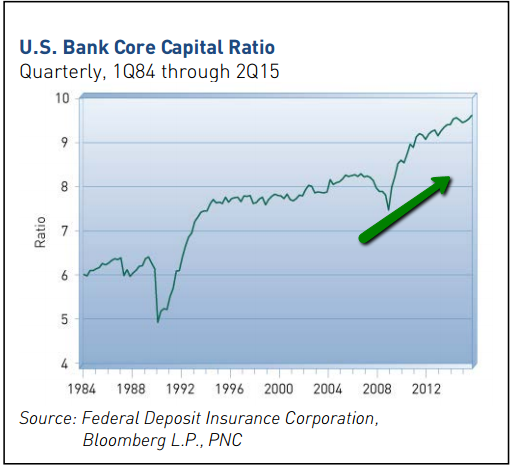
"The banks are the lifeline of the economy and play a catalytic role in activating and sustaining economic growth"! (original remark by the deputy governor of the Reserve Bank of India, S Mundra)
Snapshot as per Q4-2015: Credit quality has improved for the US-banking industry, but increased growth and profitability remain challenging in a low interest rate environment. The ...
Default Rates US-Consumer
(2010 - 2016)
Some years ago S&P Indices launched an index series designed to provide an insightful gauge into the financial health of the American consumer. In the following chart I gathered the two-month interval data showing the improvement since Q4-2010:
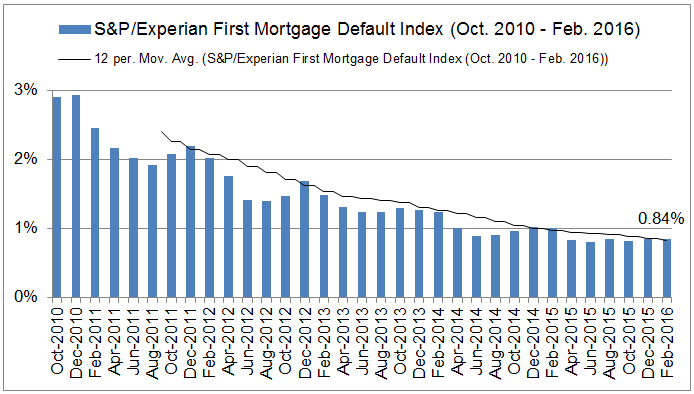
Co-developed with Experian®, the S&P/Experian Consumer Credit Default Index Series seeks to measure several critical credit components of consumer balance sheets and track their rolling default behavior.
The S&P/Experian Consumer Credit Default Indices are designed to measure default behavior across a ...
Monopoly - lessons
Charles Darrow of Philadelphia developed the game in 1933 and sold it to Parker Brothers on 19th March 19 1935.
Following its 81st birthday here are some lessons monopoly teaches us about Finance and Investing.
Monopoly has been a classic board game for decades. It's a real estate trading game that nearly everyone plays for fun and a chance to be a pretend real estate tycoon. But if you've played Monopoly long enough, you quickly realize that the game offers a lot of financial wisdom and lessons that can be applied to the real world of finance and investing. Below are ...
PMIs GLOBAL (Jan. 2016)
Global PMI-Status; Out of 42 countries/regions 29 countries carry a PMI reading > 50 (pos. reading), 29/42 = 69%**. Be aware, that also the Euro Area is also counted as a country/region, emphasising the importance of the European region as a whole!
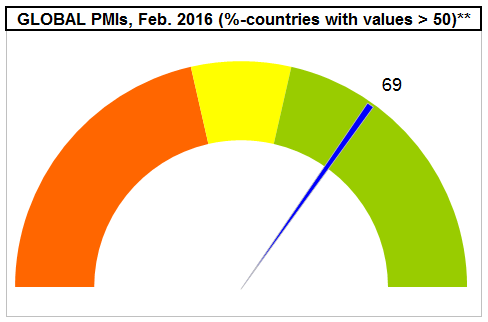
Definition of 'Purchasing Managers' Index - PMI': An indicator of the economic health of the manufacturing sector. The PMI index is based on five major indicators: new orders, inventory levels, production, supplier deliveries and the employment environment.
Breaking Down 'Purchasing Managers' Index - PMI': A PMI of ...
Industry Trend (Online Sales)
Following chart says that you've probably shifted a lot of your retail shopping to the web, whether you're in the U.S., China, or the U.K...(If you are an investor, you may also want to focus on LONGTERM-INDUSTRY-TRENDS!)
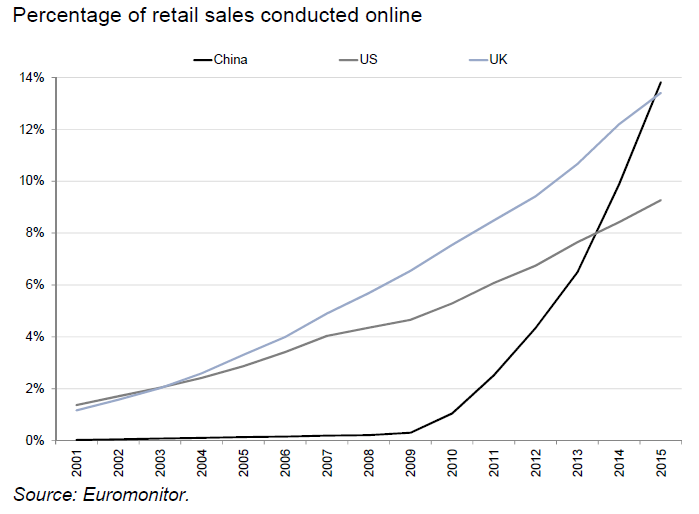
source: http://www.bloomberg.com
Since the start of the US-recovery in 2009, quarterly increases in e-commerce sales have averaged 3.7 percent versus 1.1 percent for total sales. Along the way, the share of e-commerce in the US as a percent of total retail sales rose to 7 percent from 0.6 percent in 1999: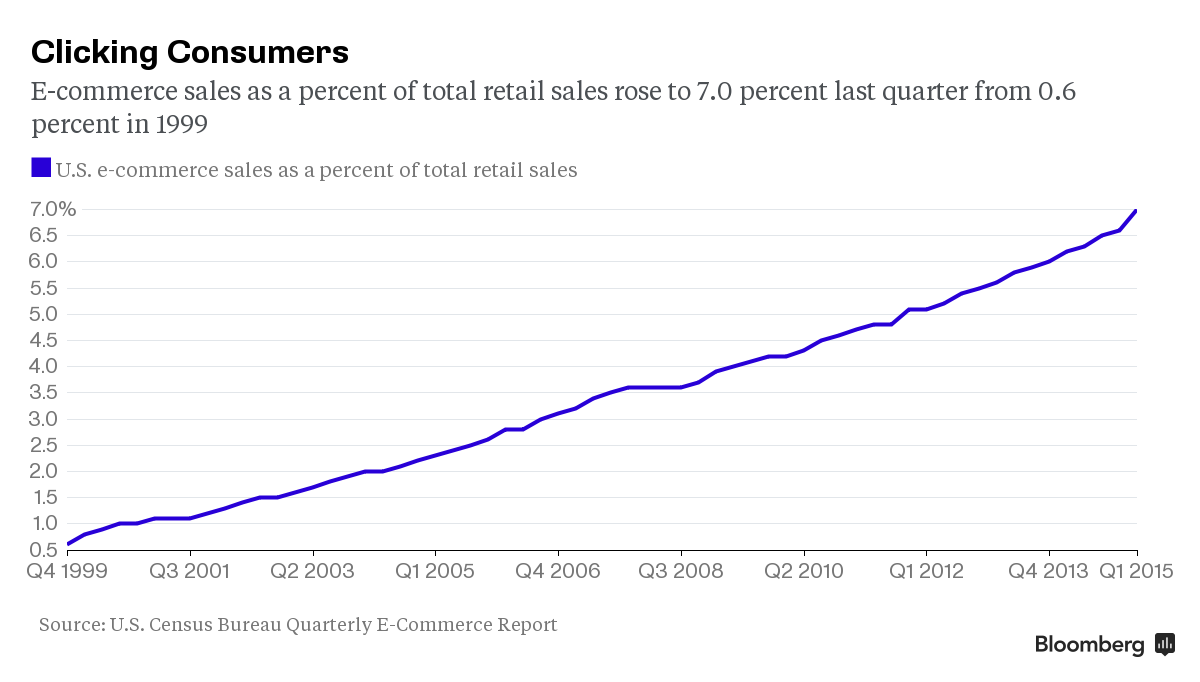
source: ...
China Purchasing Manager Index (PMI, 31st Aug. 2015)
China manufacturing sector is losing steam; Activity in China's manufacturing sector slowed markedly in August 2015, the latest sign that the world's second largest economy is fast losing momentum.
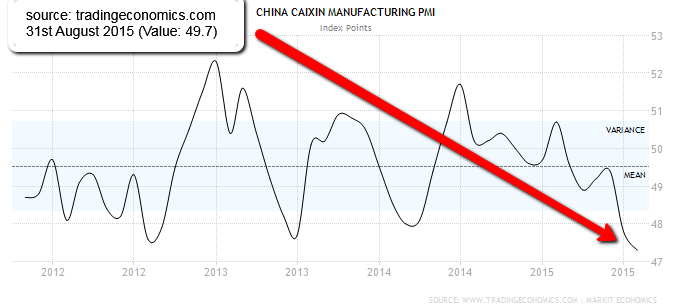
source: http://www.tradingeconomics.com
The final Caixin/Markit manufacturing purchasing managers' index (PMI) slipped to 47.3 in August 2015, the lowest reading since March 2009 and down from 47.8 in July 2015. The reading, however, was a touch better than the flash reading of 47.1.
A print above 50 indicates an expansion in activity ...
S&P 500 up ca. 59% since the last GOLDEN CROSS (x-over SMA50/SMA200), Status as per ME July 2015
But what comes up to mind is then the question about what defines a so called "Golden Cross"? Let's recap history for that matter:
In January 2012 (more than 3 years ago ;-) Birinyi Associates has sent out bullish notes, one of them about the Golden Cross:-) [...] they note that the S&P 500′s 50-day moving average is about to cross above its 200-day moving average, a blessed event known as the Golden Cross, which is the polar opposite of the (occasionally) nightmarish event known as the ...
NASDAQ-100 July (2015)
If one leaves aside the Efficient Market Hypothesis and knows about seasonal patterns, July may be an interesting month for NASDAQ (-100) – Investors.

According to the statistics from equityclock.com over the last 20 years (up to Dec. 2014) following historic averages can be retrieved for that month:
Monthly Averages over past 20 years (up to Dec. 2014):
% Return in July: +1.4%
Gain Frequency: 60%
Max Return: +14.8% (in the year 1997)
Min Return: -7,8% (in the year 2004)
The Chance-VS.-Risk-relation looking at the historic average-returns looks favorable ...
Definition of "Dow Jones Transporation Index - DJTA"
A price-weighted average of 20 transportation stocks traded in the United States. The Dow Jones Transportation Average (DJTA) is the oldest U.S. stock index, compiled in 1884 by Charles Dow, co-founder of Dow Jones & Company.
The index initially consisted of nine railroad companies - a testament to their dominance of the U.S. transportation sector in the late 19th and early 20th centuries - and two non-railroad companies. In addition to railroads, the index now includes airlines, trucking, marine transportation, delivery services and ...
Related Articles
Worldwide Rig Count 2010- 5/2015 (OIL / business barometer)
Baker Hughes has issued the rotary rig counts as a service to the petroleum industry since 1944, when Hughes Tool Company began weekly counts of U.S. and Canadian drilling activity. Hughes initiated the monthly international rig count ...
Please check out Scrapbook of Reviews on Benoit Mandelbrot
http://users.math.yale.edu/mandelbrot/
[...]
"Nach dem konventionellen mathematischen Modell dürfte es zwischen 1916 und 2003 nur 58-mal passiert sein, dass der Dow-Jones-Index an einem Tag mehr als 3,4 % steigt oder fällt. In Wahrheit ...
Long-Term-Investing
Time horizons: The longer, the better
Based on several well-known studies, the length of time that individual investors hold stocks, mutual funds and exchange-traded funds (ETFs) has shrunk precipitously over the past 50 years. Back then it was common for investors to have ...
Anlagezeitraum für Aktien (10 Jahre sollte die Meisten belohnen (?)
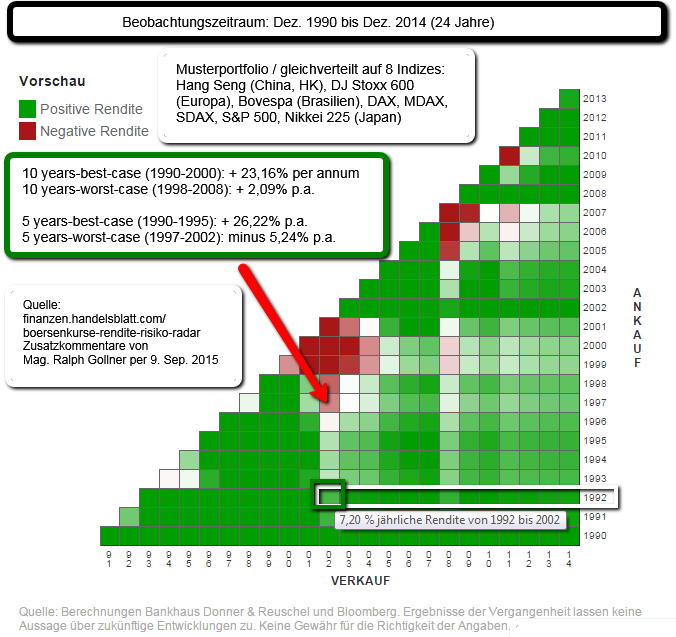
link zum Selber-nachrechnen: http://finanzen.handelsblatt.com
MSCI Indizes (Aktien p.a. 1989 bis 2014)
Die USA und Europa haben das weltweite Börsengeschehen in den vergangenen Jahrzehnten geprägt. Die Serie "Bewährte Märkte" von Fidelity International beleuchtet die Fakten dieser Märkte im Detail (Kommentare von mir leicht geändert):

Die USA und ...
Gesundheitsausgaben (in % vom BIP), Langzeithistorie

Den mit Abstand höchsten Anteil der Gesundheitsausgaben am BIP verzeichneten die USA (16,9 Prozent), gefolgt von den Niederlanden (11,8), Frankreich (11,6) und der Schweiz (11,4 Prozent). Österreich liegt mit 11,1 Prozent knapp zwei ...
S&P 500 yearly returns 1980 - 2014
US-Stock-Market-Returns (S&P 500) were positive in 27 out of the last 35 years (timespan: 1980 - 2014)! Out of these 27 years a positive return of at least 20% has been achieved in 12 years. Status of annual return overview: 25th Aug. 2015.
please check out ...

History recap of the 1st trading-week of the year 2016
For the 1st week in 2016, the S&P 500 fell 6 %, the Dow Jones Industrial Average shed 6.2 % and the Nasdaq Composite tumbled even 7.3 % (in only 5 days).

It was the worst start to a year for the S&P 500 on record. S&P 500 components, a ...
China Exports (New Year-effect, Feb. 2016)
The export crash is misleading in this case because the Jan. & Feb.-months host China’s biggest holiday, the Chinese New Year, when factories rush to meet orders before business shuts down (see yellow boxes in the last years):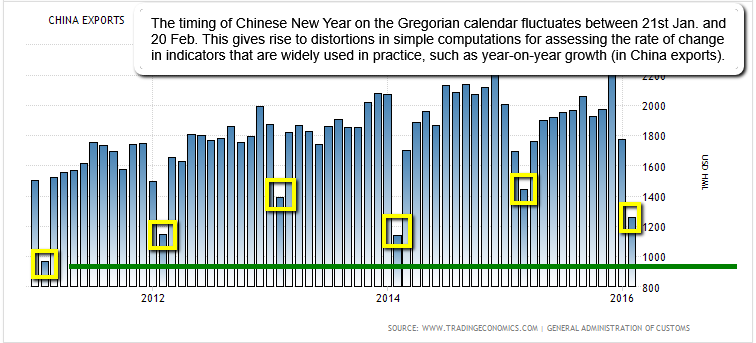
Disclaimer "upfront": ...
St. Patrick's Day (17th March 2016)
St. Patrick’s Day has a bullish history itself. DJIA, NASDAQ and Russell 2000 also exhibit solid track records of gains over the past 21 years on the thirteenth trading day of March (see StockTradersAlmanac.com).

Average gains range from 0.26% for DJIA ...
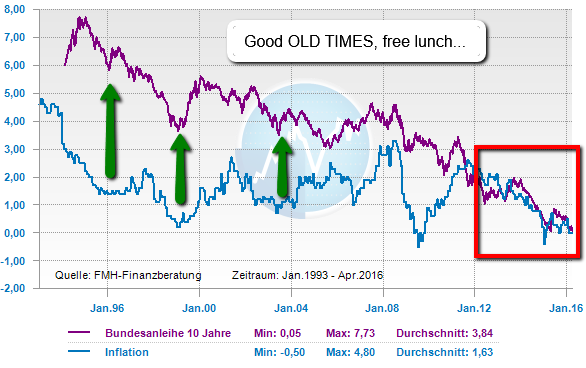
Umlaufrendite/Staatslanleihen (Historie)
1993 - 04/2016
Die Umlaufrendite deutscher Bundesanleihen ist am Montag (11. April 2016) erstmals auf 0 % gefallen. Damit erhalten Anleger, die in deutsche Anleihen investieren, im Schnitt erstmals keine Zinsen mehr. Vorab die deutsche Bundesanleihe:
...
Momentum (last 3 months)
Momentum picking up! Check out each sector-development in the big stocks-universe (> 4,900 stocks). All sectors (!!) in the green over the given period (status: 16th April 2016):
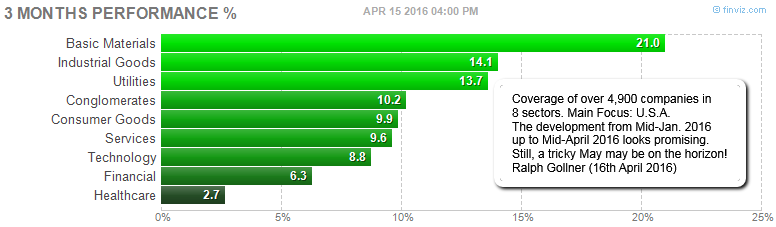
The wide US-Stock Market (S&P 500/SPX) is also gaining momentum (again), as can be seen ...
Baltic Dry Index (All-Time-Low Feb. 2016)
Der Baltic Dry ist im Feb. 2016 so tief gesunken wie noch nie zuvor (per April jedoch wieder kräftigst erholt!). Der Index bildet die Frachtkosten wichtiger Rohstoffe wie Eisenerz, Kohle und Kupfer ab.
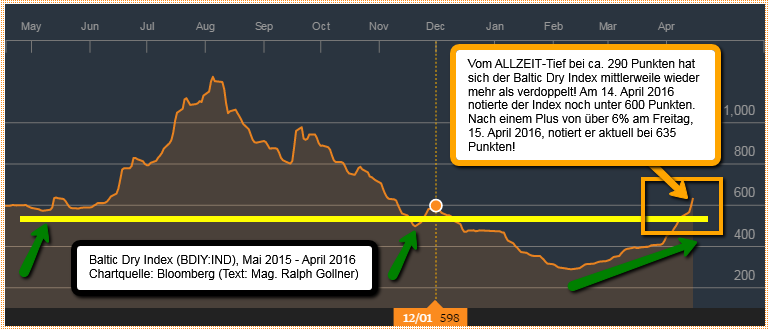
In der Regel ist die Container-Schifffahrt ...
Absolute Return vs. Warren Buffet, Ray Dalio
(Q4/2013 - Dez. 2015)
Es gibt zum abgelaufenen Jahr 2015 und dem Finanzmarkt mehrere Meinungen. Einige meinen sogar, für kleine Aktienwerte, Nebenwerte und Mid-Caps war 2015 garnicht so anstrend und schwierig, wie die Mehrheit meint.
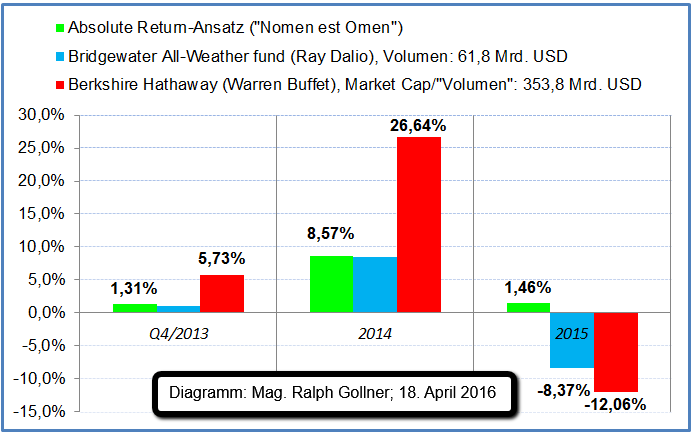 Performance ...
Dividend-ETF (vs. S&P 500), period: 2006 - 2015
The average investor may be searching for "low-expense-fee"-ETFs in order to build his Long-Term-Portfolio. Following ETF achieved an annual performance of 13.46% in the last 5 years (10-year perf. yoy: 8.63%):
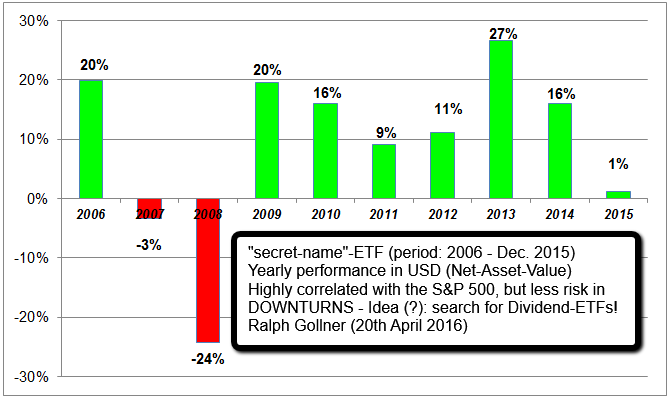
In an ETF the stock selection ...
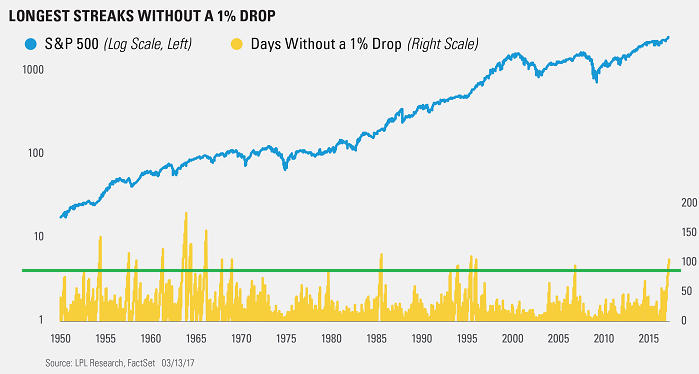
S&P 500 Streaks without a 1%-drop
Is A Lack Of Volatility A Sign Of Complacency?
The S&P 500 Index has gone 104 days in a row without a 1% close lower! In fact, the S&P 500 hasn't moved in a daily range of more than 1% for 59 days in a row, the longest such streak going back 50 years and...
...
Selected Hedge-Fund performance (year 2015)
In the following overview you can find last years' performance of selected Hedge-Fund Managers, ATTENTION: Last years' return-calculation is based on the weighted portfolio performance:
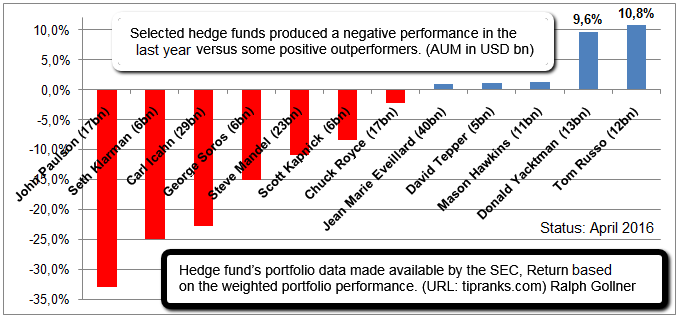
The more than a dozen (pretty well known) mentioned ...
Mittelschicht-anstieg 2016 bis 2030!
Zwischen 1990 und 2010 hat sich der weltweite Anteil der Menschen, die unterhalb der absoluten Armutsgrenze von 1,25 US-Dollar leben müssen, mehr als halbiert, von 47 auf 22 Prozent. Das entspricht einer Verminderung um 700 Millionen Menschen.
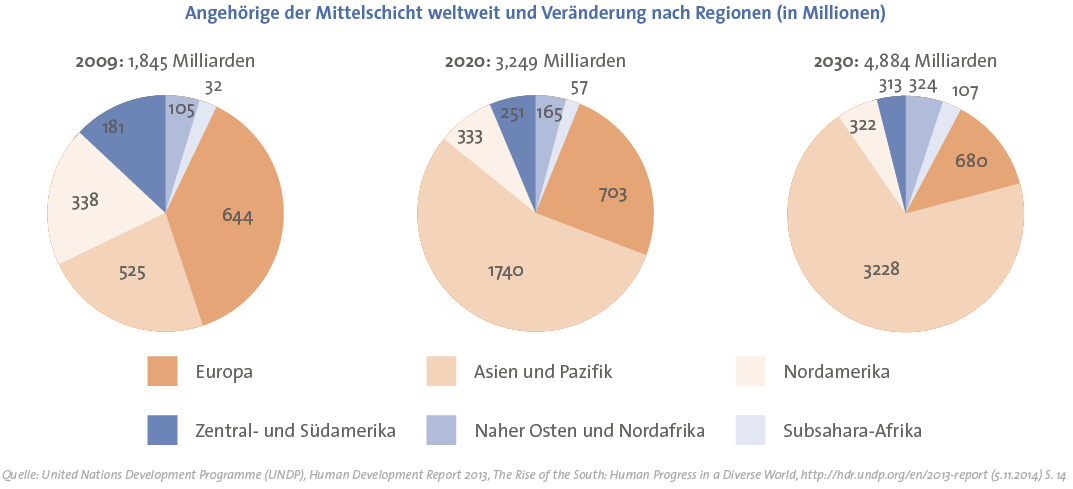
Die ...
S&P 500 "Forecast" 2016 - 2022
Do Past 10-Year Returns Forecast Future 10-Year Returns? Vanguard expands its previous research in using U.S. stock returns since 1926 to assess the predictive power of more than a dozen metrics that investors know ahead of time:
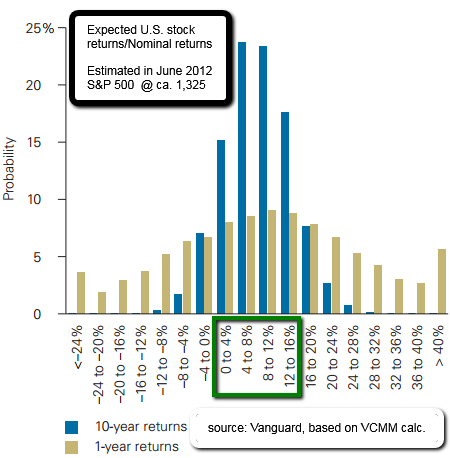
Projections are based on ...
Die fünf Vorsorgetypen in Österreich
Wie die ÖsterreicherInnen mit dem Thema „Private Pensionsvorsorge“ umgehen, wie sie sich entscheiden oder auch nicht, zeigt eine Studie der BAWAG P.S.K. (Nov. 2014).
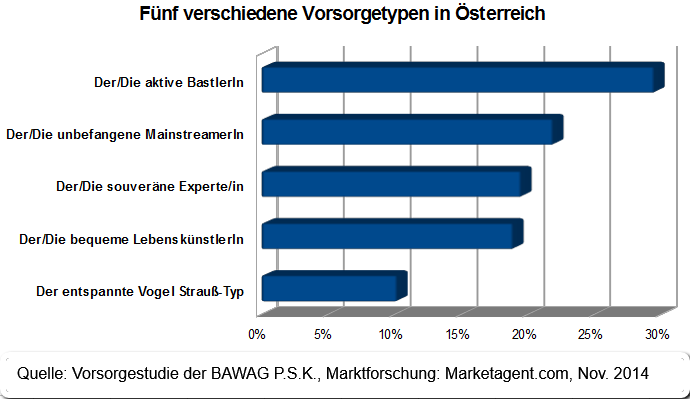
Die Befragten sind sich darüber im Klaren, dass das Thema „Private Pensionsvorsorge“ ...
Carl C. Icahn (Investor)
C. Icahn has, unequivocally, shown superior skill as an investor. Consider this: Icahn has returned 31% annualized between 1968 and 06/2015. BUT since 2014 everything got a little bit more difficult...
Still: Based on the weighted portfolio performance he achieved ...
US-population 1950-2016
The US-population is growing ever since. GDP-Growth is achieved via productivity growth, but also due to more people producing a higher output (GDP). In the U.S.A. the population more than doubled from the year 1950 until now.
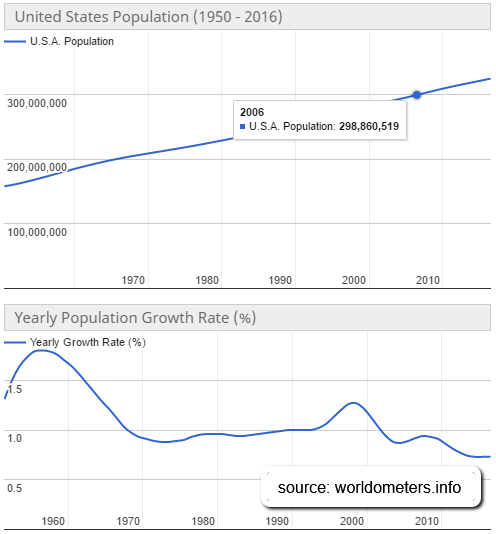 current US-population figures: ...
US-New Home Sales
New Home Sales in the United States averaged 652.45 Thousand from 1963 until 2016, reaching an all time high of 1,389 Thousand in July of 2005 and a record low of 270 Thousand in February of 2011.
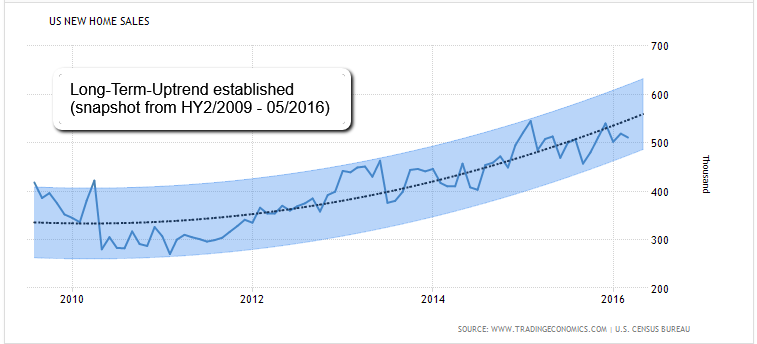
Definition: A sale of the new house occurs with the signing of a sales ...
Snapchat versus Facebook
(Status: HY1/2016)
Snapchat is coming up! Tumblr, Vine, Twitter, Pinterest, Instagram, Linkedin – Nearly no one can reach the time spent by US-users on its platform. Only Facebook-users spend more time per month on its platform: ca. 1,000 minutes.

Photo-Sharing is ...
Aktien versus DE-Umlaufrendite
Die Niedrigzinspolitik der EZB zeigt immer fatalere Auswirkungen: Die Umlaufrendite ist im April erstmals auf 0 Prozent gesunken. Das heißt: Wer dem deutschen Staat Geld leiht, bekommt im Schnitt keine Zinsen mehr. Ein Novum!
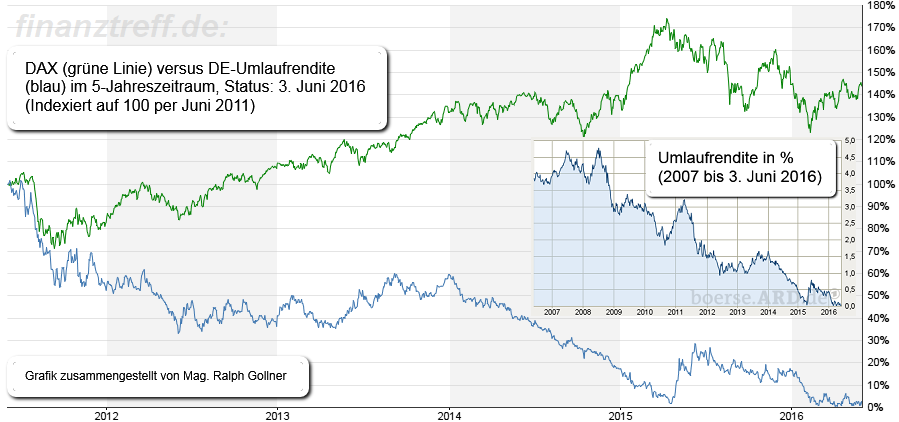
Was den deutschen ...
Top Brandz (2016)
The world’s 100 biggest brands still command a significant premium over others and that value increased by 3% to USD 3.4tn this year, according to the latest BrandZ rankings compiled by MillwardBrown, the research agency:
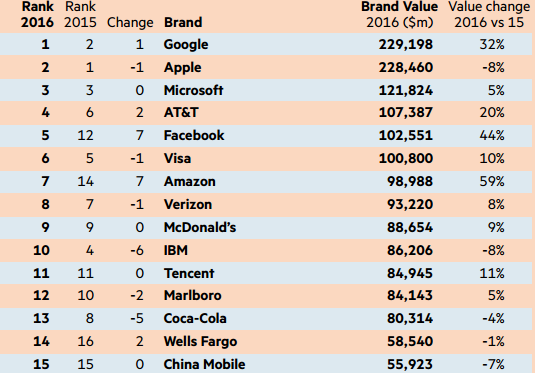 complete list/please click here: ...
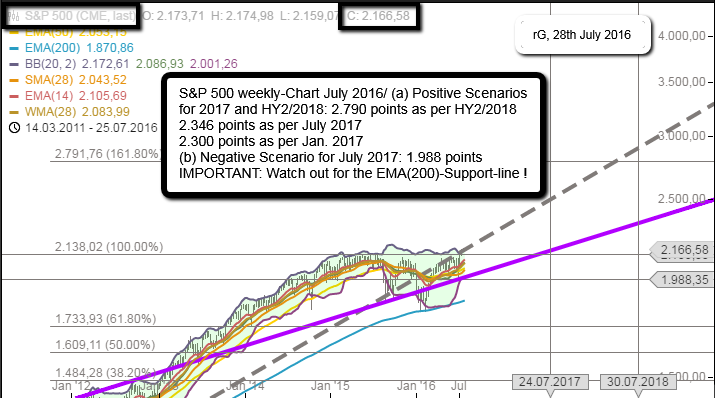
Rolling Returns 12 months & S&P 500
(July 2016 - 07/2017 - July 2018)
Writing about one-year-targets (implied returns), one should keep in mind, that the average ROLLING-RETURN for a 1 year period is 7.02%, the median for a 1 year-rolling-period in the Dow Jones Industrial average is 6.62%.
...
Indien & China (Mittelschicht-Anstieg)
China: In den kommenden (vier bis) fünf Jahren steigt der Konsum im Reich der Mitte um 50 Prozent, behauptet eine Studie. Vor allem die jungen wohlhabenden Chinesen geben demnach viel mehr Geld aus als ihre Eltern.
Folgend der eingangs erwähnten Studie ...
For the first time, America is no longer No. 1 for super-rich
The wealth of high net worth individuals (HNWI) in the Asia-Pacific grew by 10% or almost five times North America's 2% growth for "HNWI" last year, according to a Report released by Capgemini, a global consulting service.
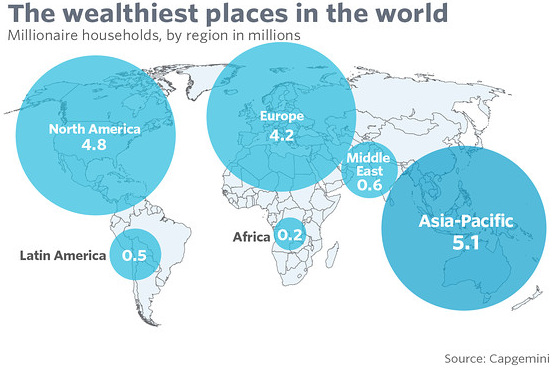
There ...
Betriebliche & überbetriebliche Pensionskassen Österreichs
Die Performance betrug in 2015 +2,36%. Der Fokus liegt (jedoch) auf langfristiger Veranlagung. Der durchschnittliche Veranlagungserfolg der österr. Pensionskassen liegt mit Ende des 3. Quartals 2016 bei +3,3%.
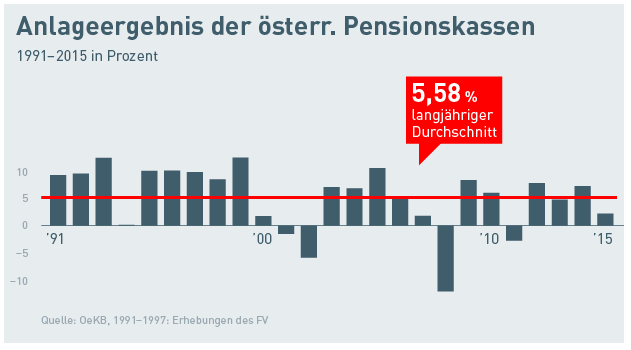
Der 1992 gegründete ...
Banking in the US / Net Interest Margin & 10YR-US-Treasuries
Net interest margin is a measure of the difference between the interest income generated by banks or other financial institutions and the amount of interest paid out to their lenders (for example, deposits), relative...
.gif)
...to the ...
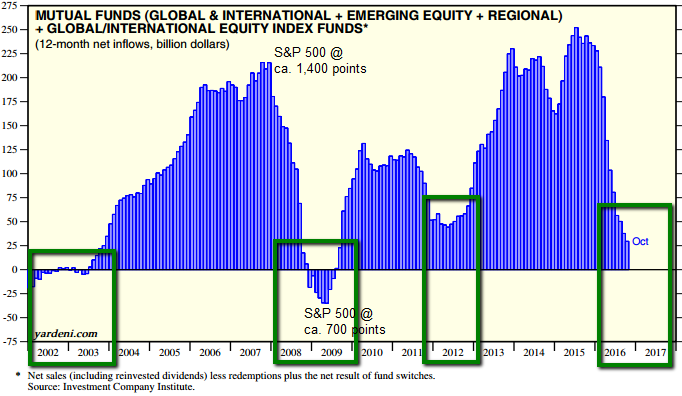
Fund Flows (Tailwind for stocks ?!)
Nov./Dec. 2016
Investors plowed money back into ETFs at a breakneck pace during the first week of December 2016. After adding USD 48 billion to U.S.-listed ETFs in November, they added USD 14.6 billion to the space in the week ending Thursday, 8th December.
 ...
...
The Majority of the World’s Population Lives in This Circle
China and India, or "Chindia" - is home to about 40 percent of the world's population. Furthermore there are now at least 3.8 billion people living inside the highlighted circle (that circle holds 22 of the world's 37 megacities):

...
Die wertvollsten Unternehmen der Welt
Die Top-Plätze im Ranking der 100 teuersten Konzerne sind weiterhin für amerikanische Firmen reserviert. Der deutsche Spitzenreiter ist SAP auf Platz 60.
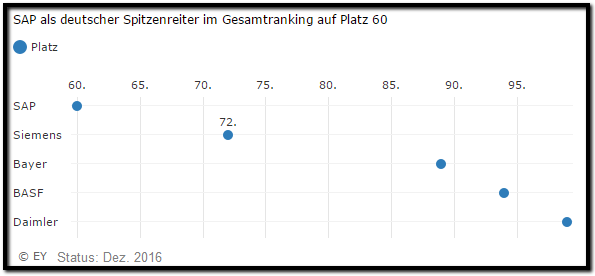
Die zehn wertvollsten Unternehmen der Welt kommen auch in diesem Jahr aus den Vereinigten Staaten. ...
The Pareto Principle
...is an economic term invented by an Italian economist Vilfredo Pareto in the 20th century. It is also called the 80-20 principle, meaning that 80% of effects come from 20% of the causes. In the book "The Tao of Warren Buffet" written...

...by Mary Buffett, one can ...
Remember the Big Bull Markets (50s, 90s)
I guess, the times to achieve great returns via Value-Investing are now much harder than in the last century...maybe, BUT: there always has to be an Equity Premium OVER Bond-yields! (my best guess)
For the purposes of this illustration, a bull ...
Wenn Du (als Junge/r) Zeit/GEDULD hast...
Beim Vorsorgen gilt: Besser früh und wenig als spät und viel. Wer zeitig mit dem Sparen anfängt, muss sich weniger stark einschränken als Spätberufene:
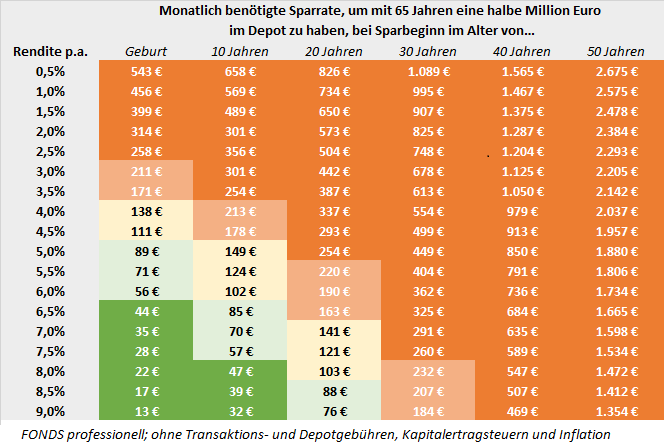
Ein plakatives Beispiel (siehe Schaubild oben):
Jemand setzt sich ein Sparziel von 500.000 Euro, ...
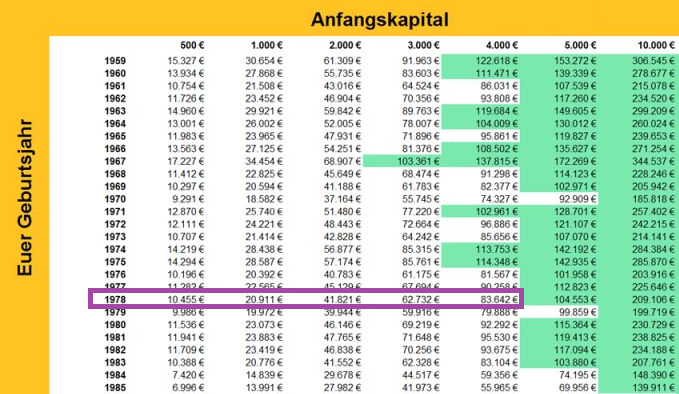
DAX-MATRIX
(Geburtsjahr bis Feb. 2017)
So viel Geld hättet ihr heute, wenn Eure Eltern bei Eurer Geburt in den DAX investiert hätten. Es ist ein Brauch, zur Geburt des Kindes gleich ein Sparbuch anzulegen, das ihm mit Zinsen zum 18. Geburtstag ausgezahlt wird. Noch schlauer wären...
...
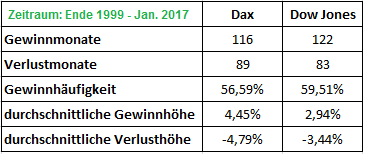
DAX vs. Dow Jones Ind. Average
(Jan. 2000-Jan. 2017)
Von den 205 Monaten seit Ende 1999 wurden beim Dow Jones 122 mit Gewinn abgeschlossen. Dies entspricht einer Gewinnhäufigkeit von 59,51%. Der Dax (89 Monate im Plus) weist hingegen eine "reduzierte" Gewinnhäufigkeit von 56,6% auf.
Hinzu ...
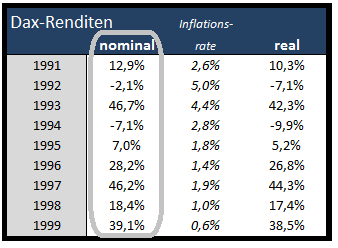
DAX-Jahresrenditen (1991 - 2012)
2013-2016 bitte selber nachschlagen ;-)
Seit 1950 hat die langfristige reale Rendite des deutschen Aktienmarktes relativ konstant zwischen 5% und 9,5% p.a. betragen. Insofern sind 6% p.a. real bzw. 8% p.a. nominal gute Erwartungswerte für eine...
...
72er-Regel (Verdoppelung)
144er-Regel (Vervierfachung)
Kleines Quiz: Wie lange müssen Sie Ihr Geld in Aktien anlegen, bis es sich bei einem durchschnittlichen Zinssatz (bei einer Rendite) von sechs Prozent pro Jahr verdoppeln wird? Die richtige Antwort liegt bei 11,9 Jahren. Eine...

...
40 Jahre sparen
(nur 50 Euro pro Monat)
Zinseszinsen sind der größte Freund eines jeden Sparers und Anlegers. Über 40 Jahre kommen dabei erquickliche Summen zu Stande - selbst wenn man nur wenig Geld zurücklegen kann. Bei den genannten Endsummen ist schon berücksichtigt, dass die...
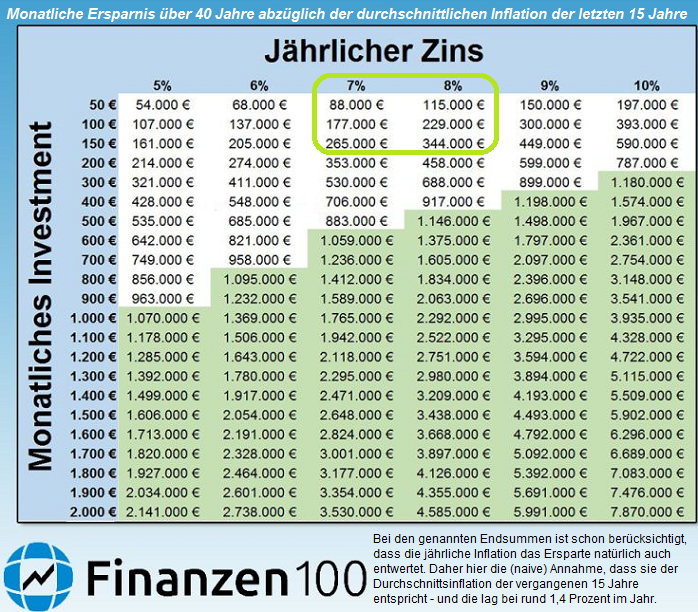
... ...
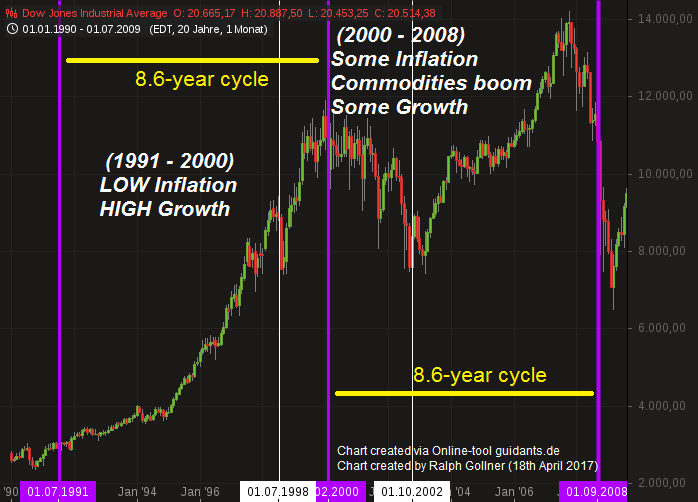
Economic Confidence Model
Martin A. Armstrong, a former chairman of Princeton Economics International Ltd, developed The Economic Confidence Model. He proposes that that economic waves occur every 8.6 years, or 3,141 days, which is Pi X 1,000. At the end of each cycle is a crisis...
...
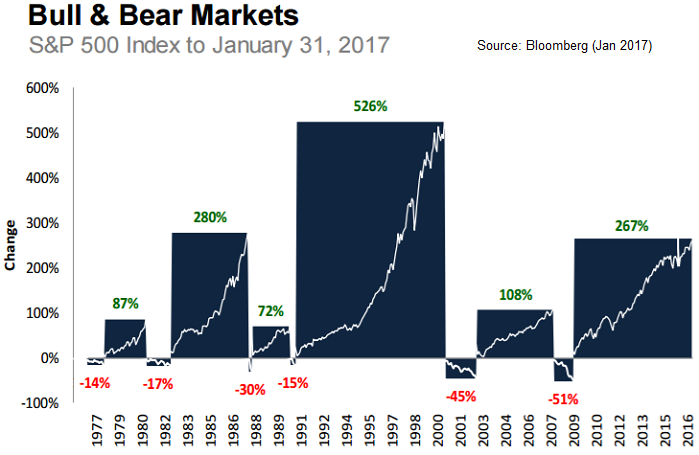
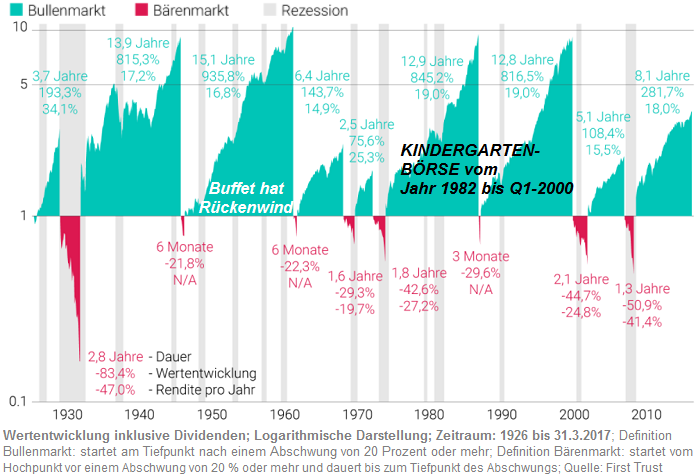
Bullenmärkte seit 1926 (inkl. "Bärenmärkte")
"kurz und schmerzvoll"
Wie lange kann ein Bullenmarkt "laufen"? Sehen wir uns eine Analyse des US-Vermögensverwalters First Trust an. Sie untersucht die Auf- und Abschwungphasen - im Börsendeutsch: Bullen- und Bärenmärkte - an der Wall Street...
...
US Stockowners fearful (not greedy)
?
In the year 2016, according to a poll of over 1,000 American adults, even with the Dow Jones industrial average near its record high, only slightly more than half of Americans (52%) say they currently have money in the stock market,...
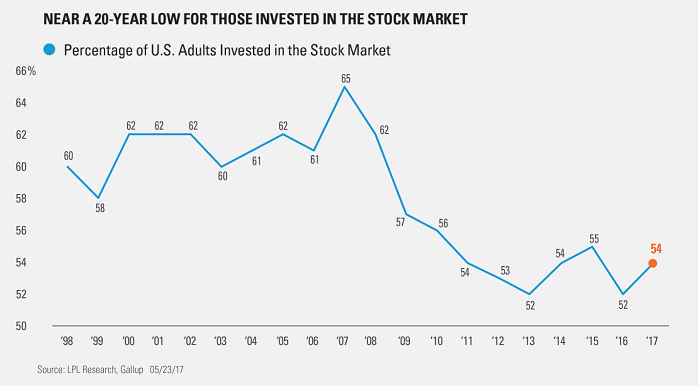
...matching the ...
US stock market returns don't look that extreme relative to history
Stock market returns are not as extreme as some might suggest. Following chart contrasts the current five-year return of the S&P 500 with the historical distribution of five-year returns.
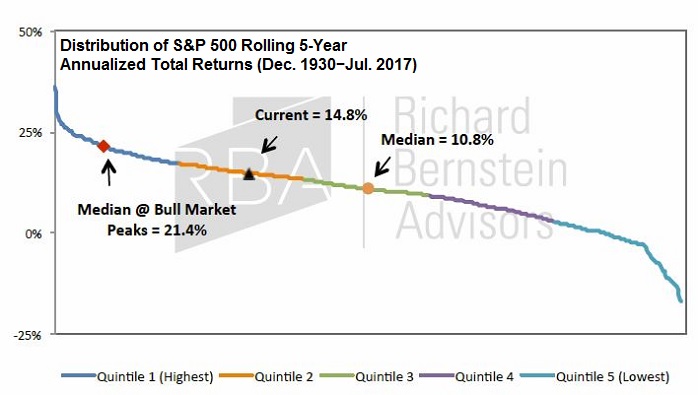
Of course, the recent experience ...
Tagesgeld und Inflation
Status: 15.07.2017
In den letzten 20 Jahren war über diese ganze Zeit noch nie der Abstand von Inflation zu Tagesgeldzins so hoch wie in den letzten Monaten. Weiteres Ansteigen der Inflation ist nicht ausgeschlossen,...
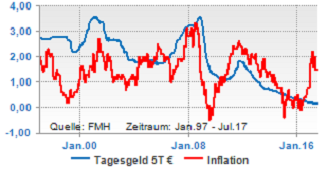
...aber ein baldiges Anziehen der ...
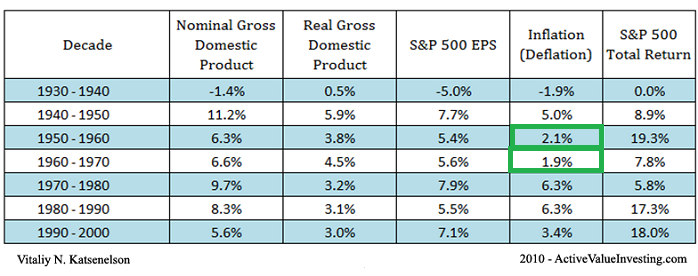
Stock Market Returns (Decades)
Although it is hard to observe in the everyday noise of the stock market, in the long run stock prices are driven by two factors: earnings growth (or decline) and/or price-to-earnings expansion (or contraction). ANNUAL StockMarket-Returns from 1930 until 2000:
 ...
...
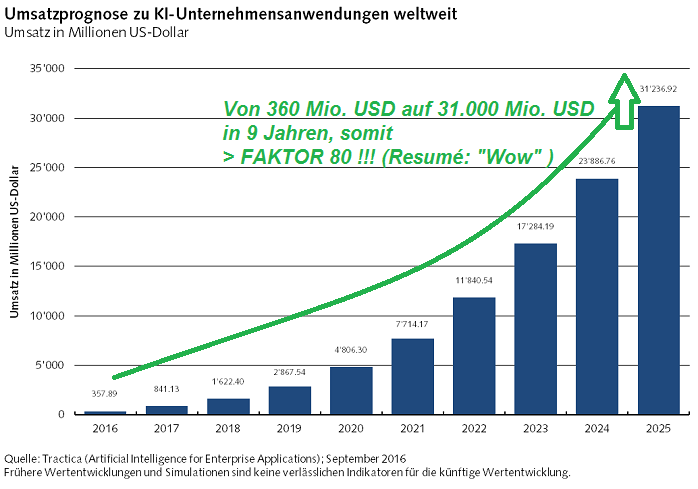
Künstliche Intelligenz
(Mögliches Potenzial 2017 bis 2025)
Hinter dem Begriff Künstliche Intelligenz (KI) verbirgt sich die Fähigkeit von Computern, menschliche Tätigkeiten zu übernehmen, meist jedoch schneller, präziser oder auch günstiger als ihre Vorbilder. Die technologischen...
...
Network effects
It's one of the most important concepts for business in general and especially for tech businesses, as it’s the key dynamic behind many successful software-based companies. Understanding network effects not only helps build better products, but...
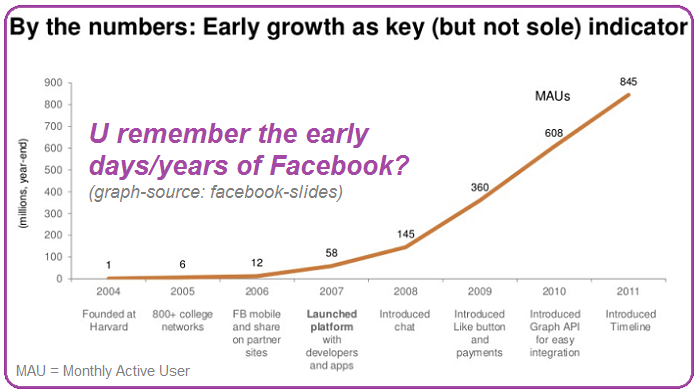
...it helps build moats and ...
The World's Wealthiest Cities
Following Snapshot gives you a selection of the "Top 15 Cities", the "15", which in total globally hold USD 24 trillion in Wealth. >> That's about 11% of the world's total private wealth. Why the focus on Asia here? Well, let's recheck the future...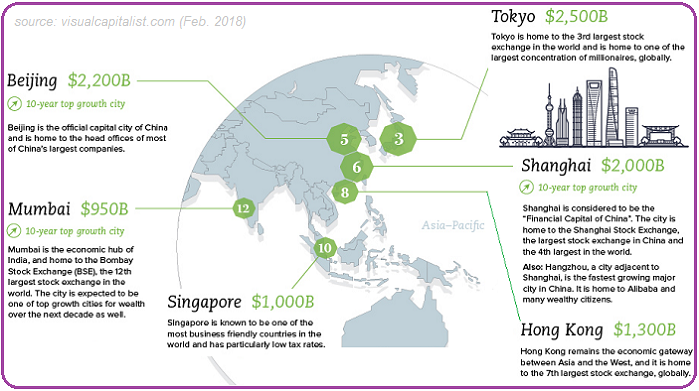
This extract ...
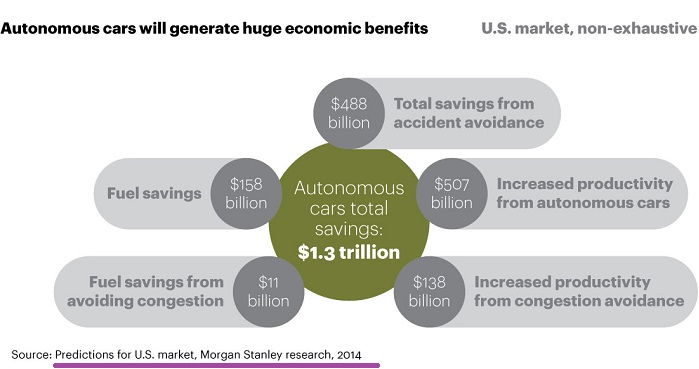
Autonomous Driving
(Status: year 2017)
The societal benefits of autonomous driving; Imagine a world with fewer accidents, fewer traffic deaths, greater energy efficiency, and lower insurance premiums. This is the world of autonomous driving. It brings mobility to people who lack easy...
...
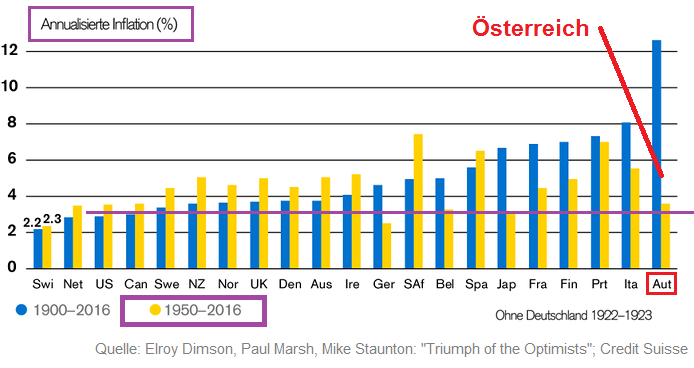
Inflationszahlen Österreich
(1900 bis Dez. 2016)
Österreich und (s)ein verstörendes 1. halbes Jahrhundert (1900 bis 1950); (Nicht nur) aus Finanzmarktsicht schaut der Zeitraum 1900 bis 1950 in Österreich verherrend aus...Was dies mit dem Vertrauen der Bevökerung und von Investoren...
...
Investieren über Sparpläne (?)
Selbst mit kleinen finanziellen Schritten kann ein grösserer Betrag angespart werden. Das geht theoretisch/zum Beispiel mit Sparplänen. Außerdem spielt man hier den Zinseszinseffekt für sich aus. Schauen wir uns folgende Beispiele an: Aus monatlichen...
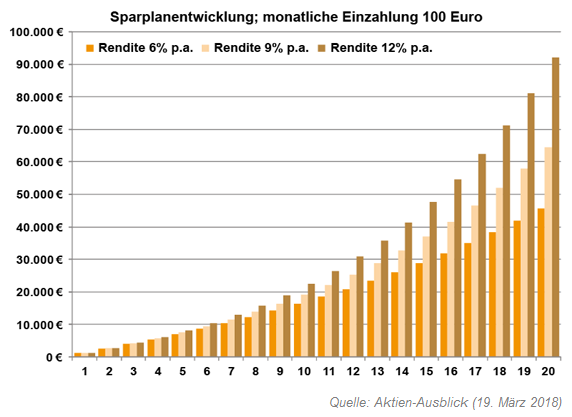
...
Die 72er-Regel
(Der Zinseszinseffekt)
Die 72er-Regel ist eine Faustformel aus der Zinsrechnung. Die Regel gibt näherungsweise an, nach wie vielen Jahren sich eine verzinsliche Kapitalanlage im Nennwert verdoppelt (siehe folgende Grafik). Dazu teilt man 72 durch die Prozentzahl des...
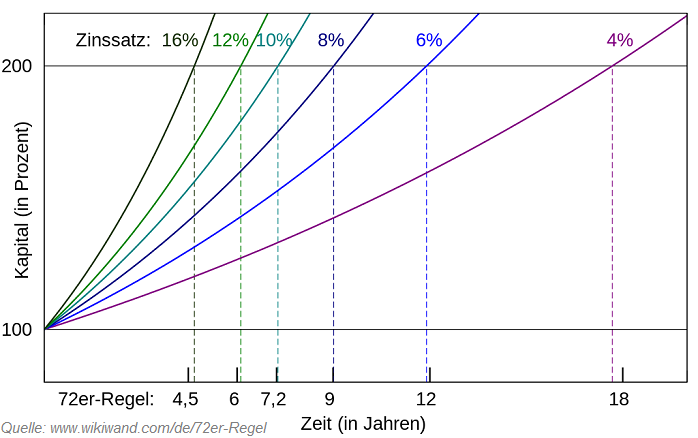
...
Understand the exponential function!
University of Colorado Professor Albert Bartlett was widely viewed as a pioneer on explaining the arithmetic involved in the world's population, energy, and sustainability issues.

Fundamentally, linear functions are just addition. Unfortunately, this is ...
Zinseszins
(Wake-Up Call)
Eine klare Botschaft: Je länger wir sparen und dabei regelmässig Zinsen erhalten, umso stärker wächst das Vermögen an. Und je höher die Verzinsung ausfällt, desto kräftiger fallen die Vermögenszuwächse pro Jahr aus. Nimmt man an, dass...
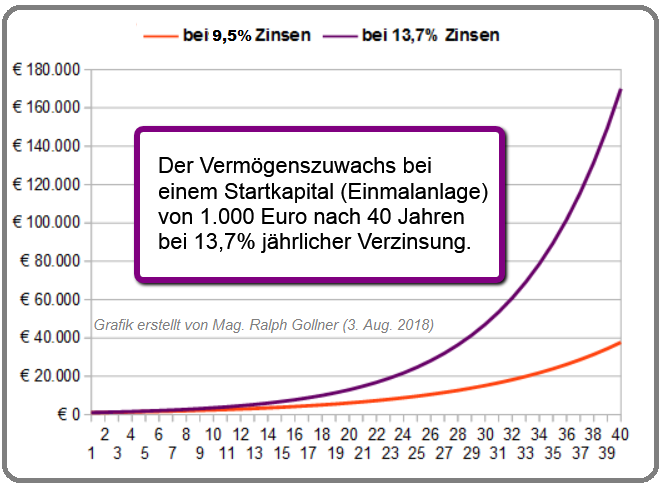
...man 1.000 Euro 40 Jahre ...
Very scary months for the "new investor"
According to history, the dangerous zone from a time-perspective might me the period starting from July until October; Please recheck for yourself: 15 out of the 20 (75%) biggest one-day Crashes occured during that period:
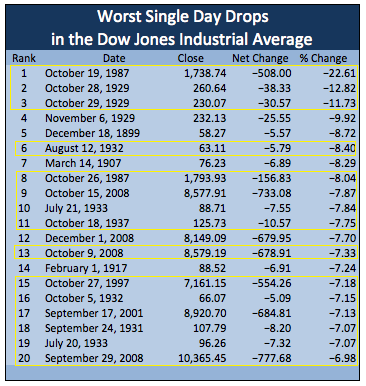
Let us rethink this ...
Globale Mittelschicht
(Status im Jahr: 2017)
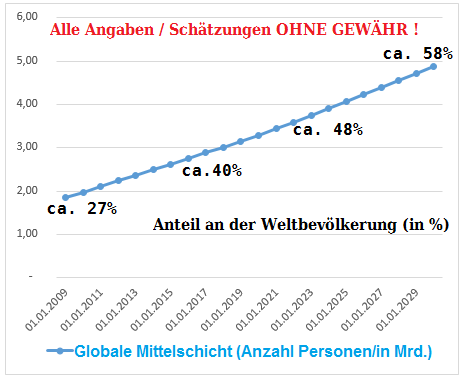
Eine atemberaubende Entwicklung ist im Gange. Ungefähr 140 Millionen Personen stossen jedes Jahr zur globalen Mittelschicht hinzu. Dieser Anstieg könnte sich in den nächsten 5 Jahren sogar noch erhöhen: auf 170 Millionen Menschen jährlich. ...
"Singles Day"
(Nov. 2018)
Alibaba. Was für Amazon der Black Friday ist, ist für den nicht weniger findigen chinesischen Rivalen der "Singles Day". Der Event fand - wie immer - am 11. November statt und entpuppte sich für Alibaba auch dieses Jahr wieder als...
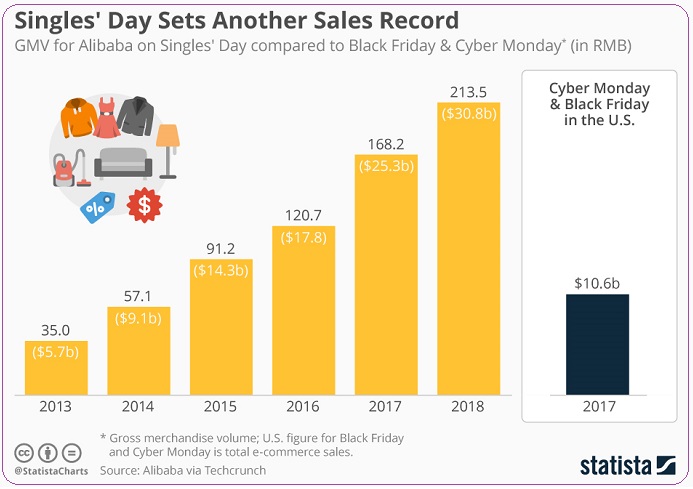
...Gelddruckmaschine. Wie das ...
(Nicht nur) Für den Durchschnittsanleger gilt:
ein langer Anlagehorizont ist -wohl- entscheidend
Für einen langfristig erfolgreichen und nachhaltigen Vermögensaufbau führt wohl an einer Investition in die Aktienmärkte kaum...
...ein Weg vorbei. Immerhin können Anleger auf lange Sicht mit ...
Kindergartenbörse 1982 bis 1999 (vs. post-2k)
Ziel einer jeden aktiven Aktienstrategie sollte es sein, im Vergleich zu konventionellen Aktienindizes ein deutlich höheres
Rendite-Risiko-Verhältnis anzustreben; Denn: Der Preis für die Rendite ist das Risiko
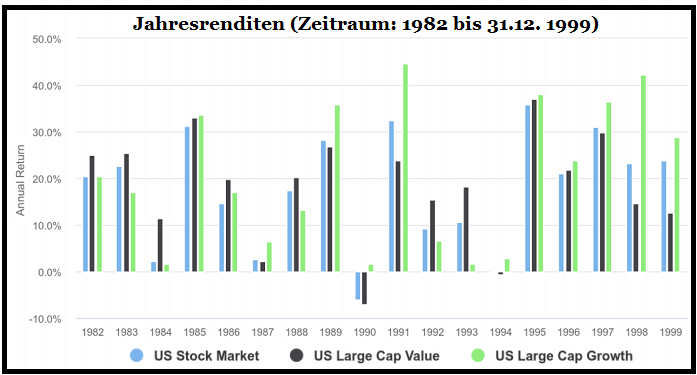
Jeder Rendite steht ein Risiko ...
Fibonacci & Warren Buffet (age 14 - 83)
Below the Fibo-Formula the normal wealth effect is displayed through the lifetime of Warren Buffet (started with the age of 14 until the "current" age of 83) if applied via consistent Fibonacci-series. Mr. Buffet was one of the few who managed to...

...
Life of PHI
Fibonacci everywhere.
Goldener Schnitt der Schönheit
Bei der Frage nach der Attraktivität greift die moderne Wissenschaft zum Maßband. Laut dem Schönheitschirurgen Stephen Marquardt lassen sich (auch) die Proportionen eines gut aussehenden...

...Gesichts nach dem Maß des ...
RECHECKING
"Quantitative Momentum: A Practitioner's Guide to Building a Momentum-Based..."
(Authors: Wesley R. Gray, Jack R. Vogel)
Quarter-ending months generally have the highest returns when comparing low and high momentum portfolios. Once momentum-profits are...
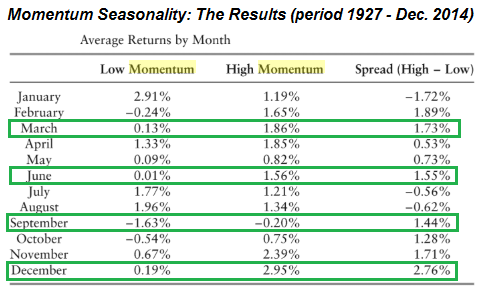
...the largest in ...
1928 - Nov. 2019 (nearly +10% p.a.)
Interesting insight into the annual returns/decades from the year 1928 onwards:
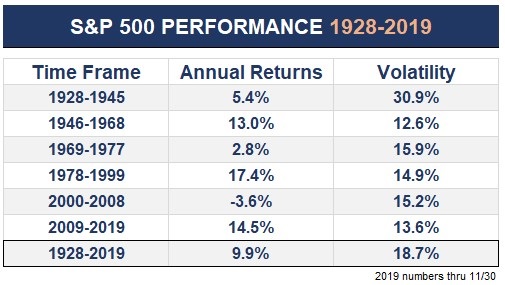
>> fascinating. Please take a look at the easy period 1978 (my birthyear) until 1999!
The Power of Compounding
The Magic of starting early and INVESTING LESS!
At the beginning of the 21st century most young people are told that social security won't be there for them when they retire from the work force. Thus, in order to be able to completely retire from the...
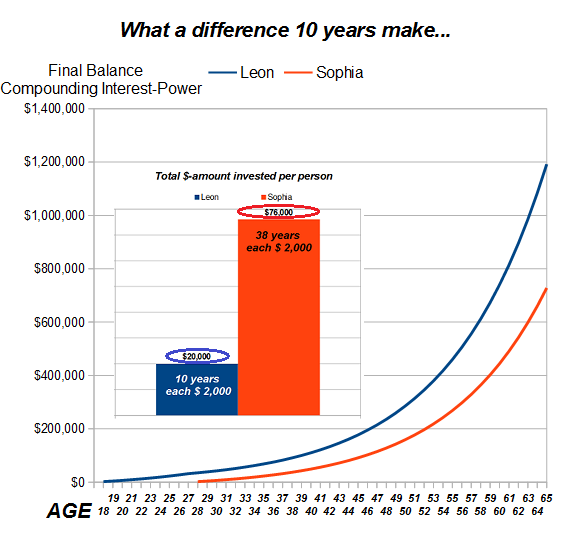
...workforce, ...


