Related Categories
Related Articles
Articles
S&P 500 "Forecast" 2016 - 2022
Do Past 10-Year Returns Forecast Future 10-Year Returns? Vanguard expands its previous research in using U.S. stock returns since 1926 to assess the predictive power of more than a dozen metrics that investors know ahead of time:
Projections are based on simulations by the Vanguard Capital Markets Model.
See the Appendix for a description of the model’s methodology and the benchmarks used under following link(.pdf):
https://personal.vanguard.com/pdf/s338.pdf
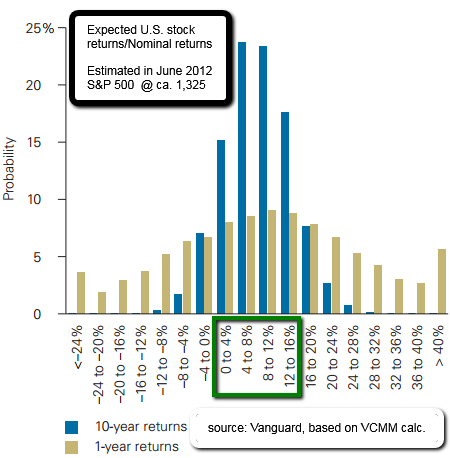
The figure above shows the probability distribution of expected U.S. stock returns based on VCMM simulations using market caluations through June 2012. Centered in the 4%–12% nominal return range, the long-term median nominal return for the U.S. equity market is modestly below the historical average as a result of current market valuations and the probability of various inflation scenarios. Turning to real returns, Vanguard estimates a slightly greater than 50% likelihood that over the 2012–2022 period, the broad U.S. stock market will earn at least a 5% average annualized real return. As such, Vanguard feels its expectation for the forward real return is quite in line with the historical average of 6.8% that has been observed since 1926, and does not represent a drastic change in the risk–reward characteristics of the equity market.
Readers will also note that the projected distribution of annualized 10-year U.S. stock returns in eth figure displaying wide and fat tails. A key reason is that nearly 60% of the variation in long-run stock returns is unexplained by valuations. As a result, the VCMM simulations in the Figure above reveal that, although there is roughly a 35% probability of U.S. stocks achieving an average annual real return between 3% and 9% over the next 10 years, even greater odds favor average returns outside of this central tendency. The odds of another “lost decade” of negative average real U.S. stock returns are approximately 20% by the calculations from Vaguard.
Calculation from Blackrock-extract/info:
Invest 5 Years After Long-TermLow (9/1/1944 • 10/1/1979) 1st year-return: +26.8% • +21.1%
10years after: +15.3% • +17.3% p.a. (!)
would mean from 3/1/09 + 4yrs after LOW 3/1/2014
10years leading to: @ 1,859 + 15%^10
for illustrations on the figures above please check following chart (.pdf): https://www.blackrock.com
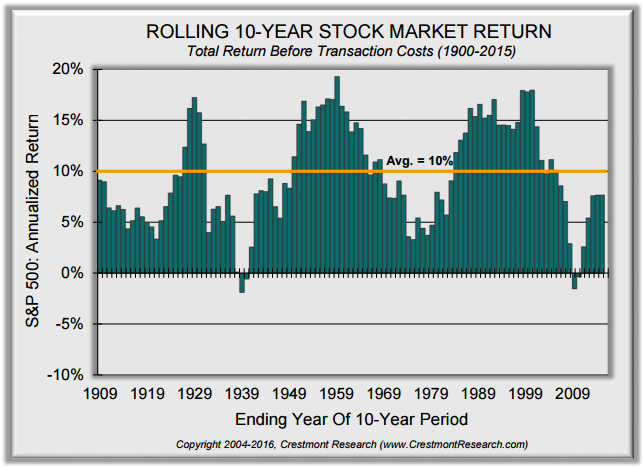
The graph below shows the 10-year rolling total return of stocks since 1929
Looking at the graph, it is clear that 10-year returns for the market have varied a great deal, creating long "secular" periods of above-average and below-average returns. There are just few periods where 10-year trailing returns fell to very low levels – after the stock market crash of the early 1930's, in the early 1940's, and again during the late 1970's and the early 1980's (on an inflation-adjusted basis, the 10-year returns during these last two periods were also negative).
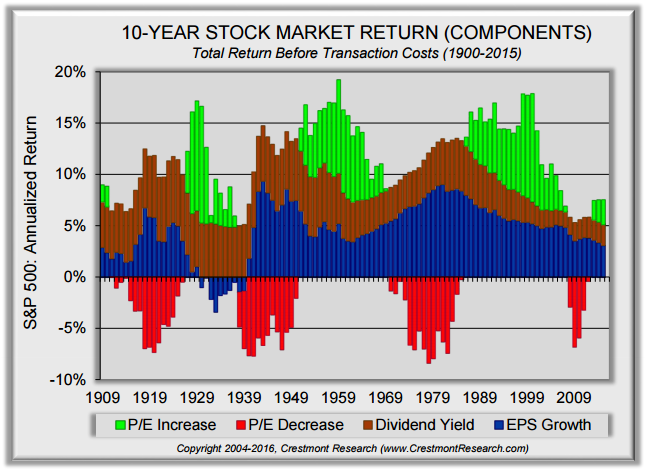
The Drivers of Returns
Once the observation is made that long periods of negative trailing returns have been followed by strong subsequent returns, it's logical to ask whether there are other characteristics that those strong decades shared. To that end, it makes sense to begin with the fundamental underpinnings of stock prices: growth and valuations.
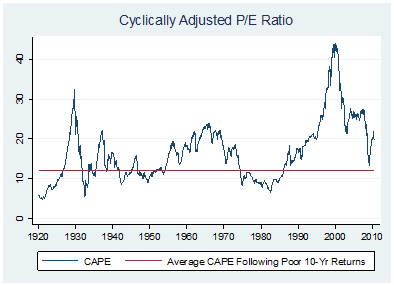
The valuation argument is relatively straight forward. On a cyclically adjusted earnings basis (where profits are averaged over the prior decade), the average cyclically adjusted P/E ratio following periods of poor long-term returns was 12. That compares with the long-term average of 16 using the entire historical period, or 14 if you exclude the Bubble Years surrounding the year 2000. Either way, not surprisingly, valuations tended to be quite low and below average following decades of poor stock performance. The cyclically adjusted P/E ratio is graphed below, with the red line showing the long-term average following poor long-term returns.
 source/great insights: http://www.hussmanfunds.com
At the low in 2009, the CAPE was close to the average level of prior periods that followed poor 10-year returns. But the current argument being made by analysts is not about investing at last year's low. It is about investing at current levels of valuation. And here, the graph shows that since 2010 CAPE is hovering near/or over 21 and sits far above the levels that typically lead to strong long-term returns.
Important to remember: To drive earnings over the long-term, economic growth matters too.
Therefore attention re. GDP-Growth:
Another reason for this downshift is that according to Commerce Department data, demographics and other factors have caused the growth rate of "potential GDP" to slow persistently in recent decades. Regardless of the cause, the graph does show that in order to attain high rates of nominal GDP growth from current trends, very high levels of inflation would likely be needed. And historically, abrupt shifts from low levels of inflation to high levels of inflation have delivered investors poor returns.
Cautious remark:
It is worth remembering that investors in the Japanese stock market have had rolling negative 10-year returns since 1997. Still, following outcomes could be possible - S&P 500-reading after 10 years from 2012 onwards, in the year 2022:
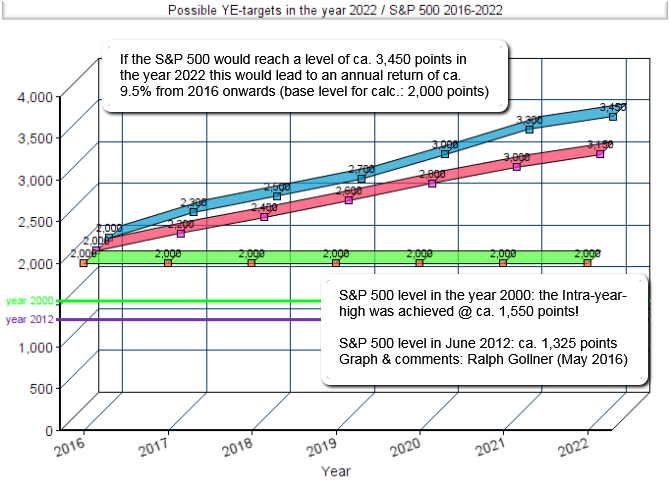 Remark: Own calcualtions/Ralph Gollner - possible outcomes - "everything is possible" - but history may help!
link/source for 10yr-rolling-returns Charts (.pdf): http://www.crestmontresearch.com


