Related Categories
Related Articles
Articles
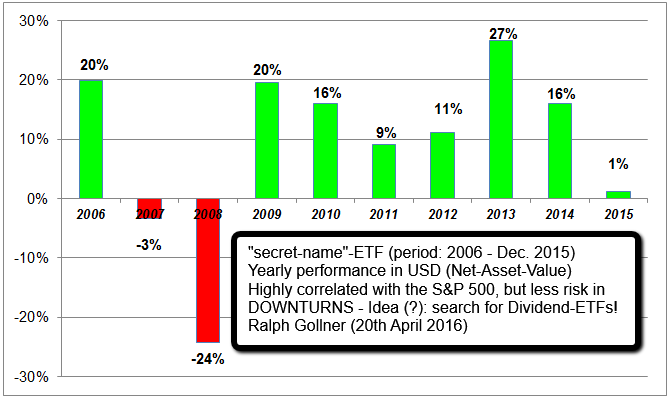
Dividend-ETF (vs. S&P 500), period: 2006 - 2015
The average investor may be searching for "low-expense-fee"-ETFs in order to build his Long-Term-Portfolio. Following ETF achieved an annual performance of 13.46% in the last 5 years (10-year perf. yoy: 8.63%):
In an ETF the stock selection method (presumably) does not change. In this way, you can determine what style of dividend ETF has historically outperformed - and what style has the highest likelihood of continuing to do so.
Still: Past performance is no guarantee of future success, but it sure doesn’t hurt. I’d much rather have my money with a manager who has a historical record of outperformance (like Warren Buffett) than someone who as a historical record of losing money hand-over-fist.
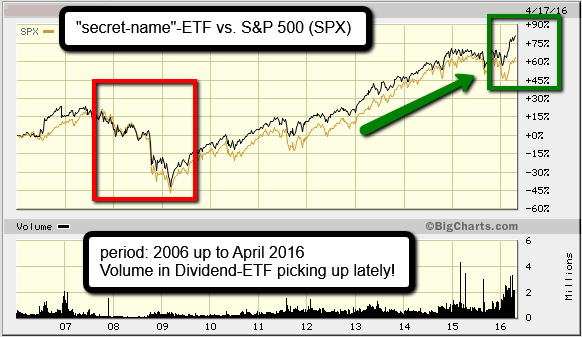
The Dividend ETF mentioned above has more than USD 1 billion in assets under management (status: April 2016). Furthermore, the ETF is having a lower price standard deviation (Volatility) than the S&P 500. As a result the dividend-ETF has a superior Sharpe ratio than the S&P 500 (risk-adjusted return).


