Related Categories
Related Articles
Articles
Stock Market Returns (Decades)
Although it is hard to observe in the everyday noise of the stock market, in the long run stock prices are driven by two factors: earnings growth (or decline) and/or price-to-earnings expansion (or contraction). ANNUAL StockMarket-Returns from 1930 until 2000:
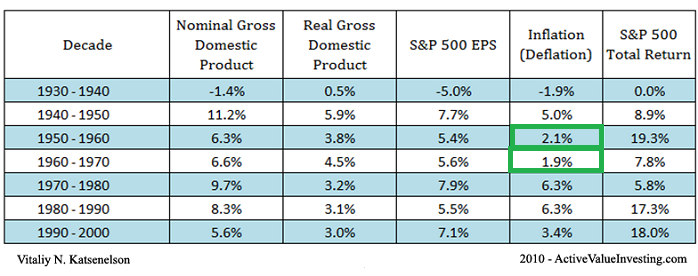
As is apparent from the Exhibit above, either by a decade at a time or a market cycle at a time, it is exremely difficult to find a short-term link between stock performance and the economy (e.g., GDP, corporate earnings growth, or inflation). The connection does exist, but periods of disconnect appear to last for decades at a time.
From 1930 - 2000 (a timespan of 70 years) the annual return of the S&P-500 Stock market (S&P 500 Total Return-column - Performance incl. dividends) was ca. 10.77% ! During theses times the earnings in the S&P 500 were growing at a pace of ca. 5.2% p.a. while the average inflation numbers were showing ca. 3.3%.
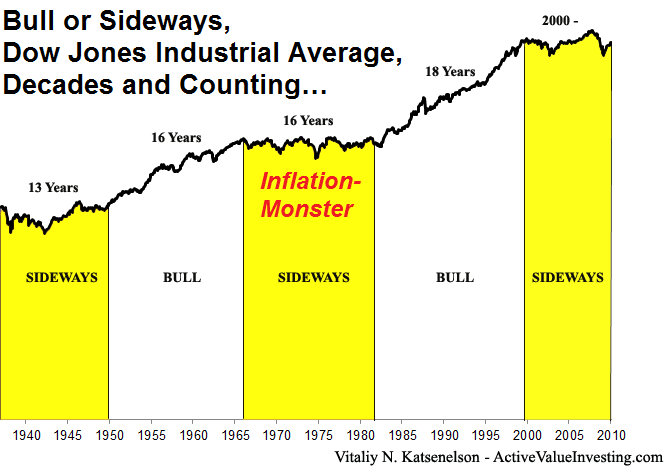
In the following chart one can only see long-lasting Bull Markets or medium- to longterm lasting Sideways-markets. To make it clear >> As Long As:
♦ Inflation Remained Reasonable,
♦ Deflation Was Absent,
♦ GDP And Earnings Growth Remained Positive
>> The Stock-Market Was Either - Bull - Or - Sideways !
links:
www.marketoracle.co.uk/Article


