Related Categories
Related Articles
Articles
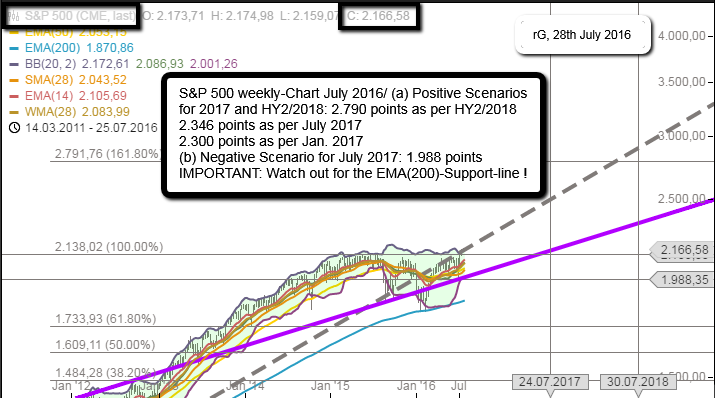
Rolling Returns 12 months & S&P 500
(July 2016 - 07/2017 - July 2018)
Writing about one-year-targets (implied returns), one should keep in mind, that the average ROLLING-RETURN for a 1 year period is 7.02%, the median for a 1 year-rolling-period in the Dow Jones Industrial average is 6.62%.
Keep in mind! This statistics for the rolling-period returns of one year covers a long history (including two World Wars) back to 17th February 1885, and up to March 2015. Furthermore in the 19th century, there has been no Central Bank established!
Reasoning for using the Dow Industrials for the calculation of Rolling 1 year-returns:
Seems the world is focused on the S&P 500, but Greg Morris, a technical Market Analyst was using the Dow Industrials for that calculation. Why? Simply because he had 42 more years of data - he explained. It is a special approach, since most research papers only use data after the depression or after WWII, but those arguments are often tied to a specific message - he goes on explaining. His message should be simple and easy to understand: How did markets (in general/in the long run) have behaved in the past.
link for rolling-returns-statistics:
https://stockcharts.com/articles/dancing


