Related Categories
Articles
S&P 500 Fair Value in the year 2022 and 2023
The foundational paper on valuation that professors Merton Miller and Franco Modigliani (M&M) wrote in 1961. In it, they addressed a fundamental question: "What does the market ‘really’ capitalize?" They did not crown a winner...
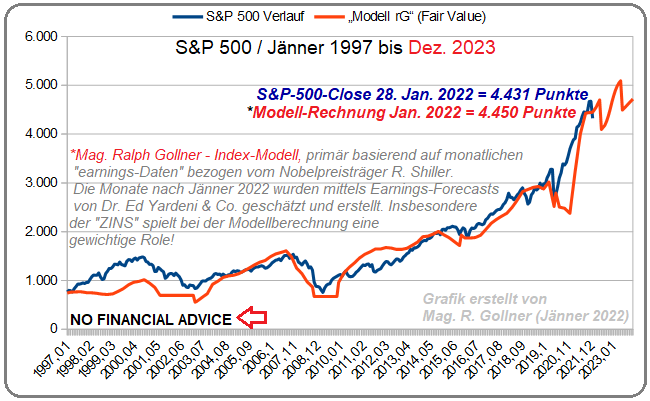
...among approaches that rely on earnings, dividends, or cash flows. Rather, they showed that all of these methods yield the same result if you address the problem correctly.
In the section that demonstrates this theoretical equivalence, M&M offer a formula that is very helpful for investors. They say that you can ...
DAX-Potenzial im Jahr 2022
(Status: 28. Dez. 2021)
Der DAX könnte seinen Aufwärtstrend 2022 fortsetzen und auf > 17.200 Indexpunkte steigen, SOFERN die DAX-Gewinnerwartungen von ca. 1.200 auch erreicht werden...
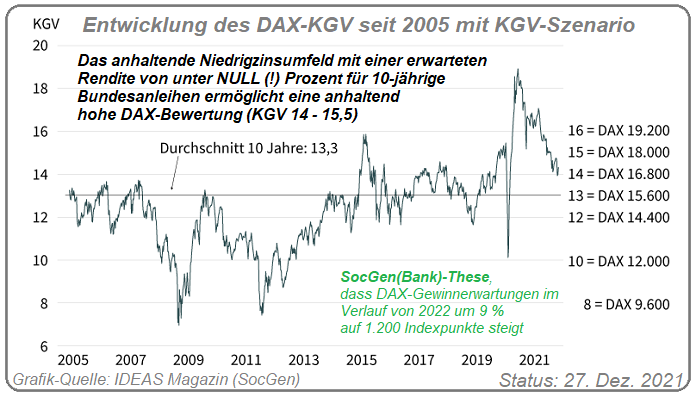
Die Prognose der Societe Generale-Bank, dass der Trend der DAX-Gewinnerwartungen im Verlauf von 2022 um 9% auf 1.200 Indexpunkte steigt, ergibt in Kombination mit einem KGV von 14,3 ein theoretisches Kursziel von 17.200 Indexpunkten; So lautet die Annahme der SocGen-Bank.
Bekannte Risikofaktoren im Markt sind die Omikron-Unsicherheit, der Kurswechsel der US-Notenbank und die ...
US-Stock-Markets are not that expensive
...correct?
Nobel laureate Robert Shiller, who created the CAPE ratio, co-authored a Barclays report with Laurence Black of The Index Standard and Farouk Jivraj of Barclays. They cited low interest rates as pushing up valuations. They further...
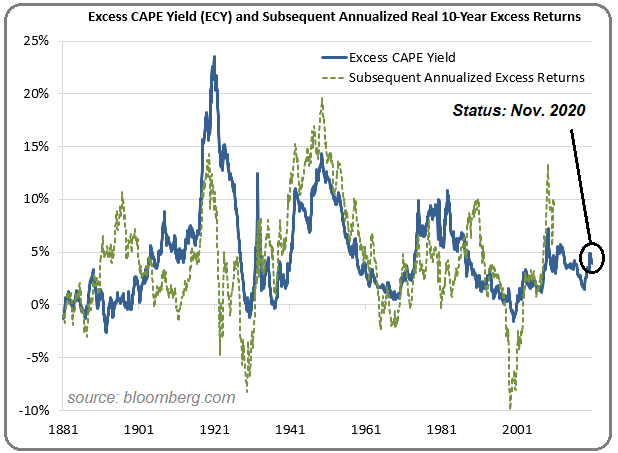
...described equities as appearing "highly attractive" relative to bonds.
The CAPE ratio is a long-term, inflation-adjusted price-earnings (P/E) ratio. For the U.S. markets, it measures the S&P 500 index against inflation-adjusted earnings for the past 10 years. Since 1880, it has ranged between 4.8 and ...
FREE CASH FLOW
(years 2015 bis 2025e)
A long-standing question about valuation-metrics...
Which is better: earnings or free cash flow?
Well, why not track both numbers to make the smartest moves? Earnings information provides a nice summary of a company's day-to-day operations and...
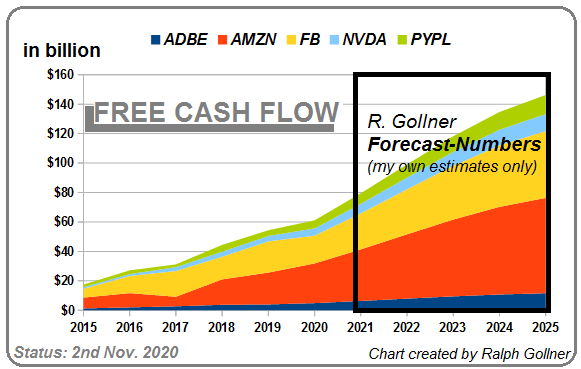
...long-term sustainability, and the calculation uses a more gradual reduction of capital expenditures using depreciation of assets. Free cash flow, on the other hand, represents the hard money brought in from operations minus the purchase of assets and dividends paid out.
Free cash flow can alert you to ...
Fed Balance sheet potentially propping up the US-Stock Market (?)
IF and only if the Federal Reserve will pull up its Balance sheet up to over 10 billion USD, my guess is that this could also have "some" material impact on the US-Stock Market (S&P 500-Index). The "FED" may hold interest...
![]()
...rates near zero for three or more years, and its balance sheet will soar above USD 10 trillion as policymakers seek to revive the U.S. economy from recession, economists said in a Bloomberg survey.
Just over half the 31 respondents to an April 20-23, 2020 poll predicted the target range for the ...
Valuation US-Stock-Market
March2020
During much of the late 1950s and throughout the 1960s, the S&P 500 was highly priced relative to book value. The U.S. stock market achieved healthy rates of return as (relatively) low interest rates made equities relatively more...
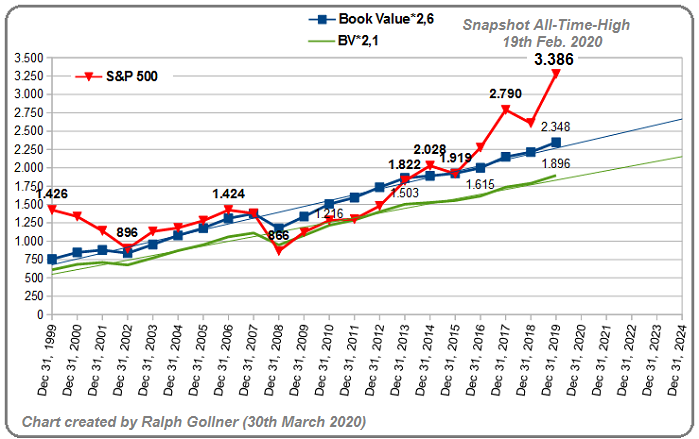
...attractive. Interestingly enough, for some quarters now (since July 2019) the Risk-Free Rate (US-10year-treasuries) has fallen below 2%, indicating that an investment in these US-Bonds would lead to negative real returns. That perception implicitely assumes, that the inflation rate is currently hovering around +2%. ...
DAX-Stand von unter 10.000 (13. März 2020)
In den letzten 140 Jahren folgten auf CAPE- und KBV-Bewertungen, wie wir sie heute im DAX sehen, sehr ansehenliche Renditen. Allgemein wurden in der Mehrzahl der historischen Beobachtungsperioden reale Wertzuwächse von 4-9% erzielt.
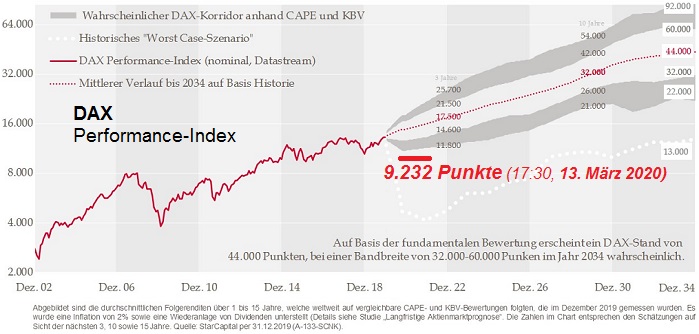
Berücksichtigt man die Inflation, erscheint damit ein DAX von 30.000-60.000 Punkten in 15 Jahren laut starcapital Research möglich.
Interessant erscheint auch die Worst-Case-Betrachtung. Diese stellt die schlechtmöglichste Wertentwicklung dar, die auf eine mit heute vergleichbare Bewertung seit 1871 folgte, also ...
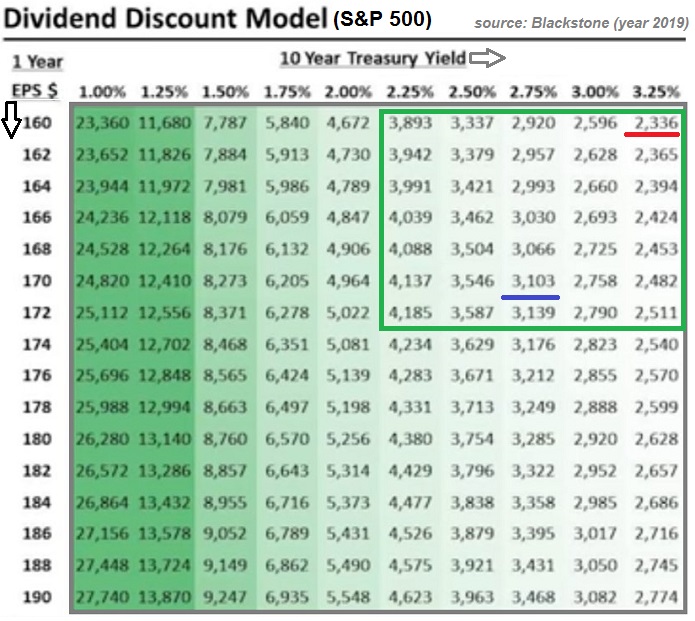
Dividend Discount Model S&P 500
(potential fair valuation / UPDATE)
In Oct. and November 2018 the U.S. 10Year-Treasuries reached a yield of ca. 3.25%. Reminder: Around Christmas Eve in 2018 the S&P 500 reached then its intermediary LOW at around a level of ca. 2,336 points...(I did not...
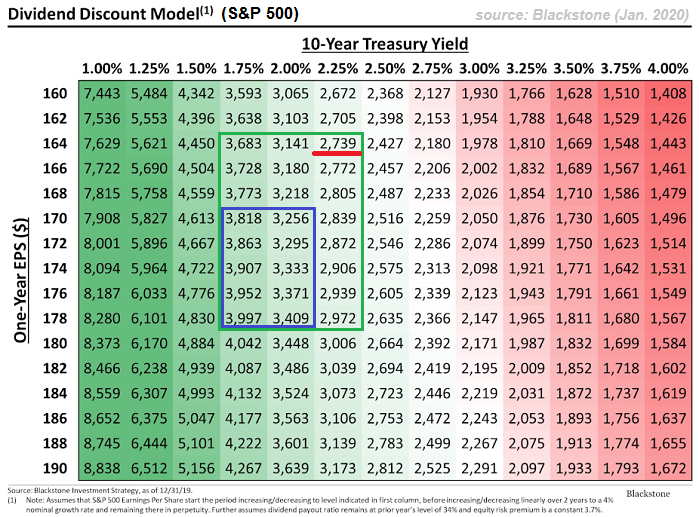
Legend:
"DDM = Dividend Discount Model"
"SPX = S&P 500 / U.S. Stock-Market Index" (see following chart)
...look up the exact level).
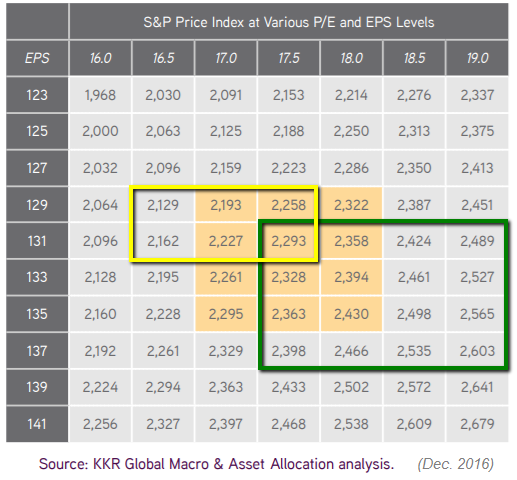
Now (Jan. 2020) that we are sitting at a 10YR-Treas.-level of ca. 1.81% and a possible S&P 500 earnings-"guess" of ca. 172 USD in the S&P 500 (see Matrix above and ...
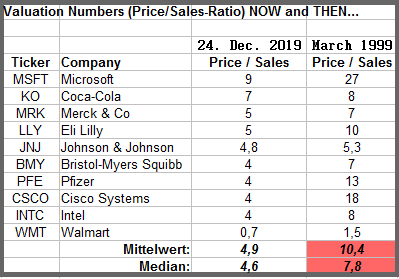
Valuation matters
Price/Sales Ratios year 2019 versus 1999
Here below some selected stocks
(check this out ;-)
Wirtschaftswachstum & KGV im S&P 500
Der Anfang des Wirtschaftswachstums als Dauerzustand moderner Wirtschaften steht in engem Zusammenhang mit dem Beginn der industriellen Revolution anfangs des 19. Jahrhunderts. Zuvor lebten die Menschen hauptsächlich...
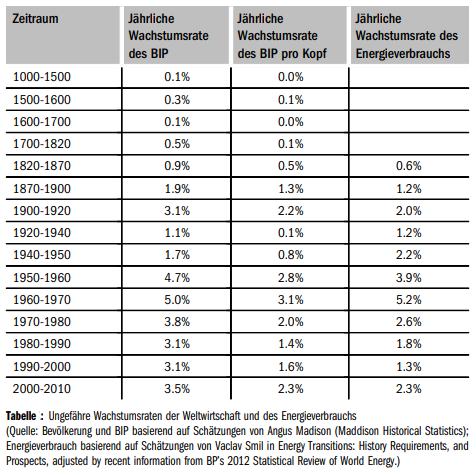
...in Agrarwirtschaften, in denen die landwirtschaftliche Produktion die dominierende wirtschaftliche Tätigkeit war. In einer solchen Wirtschaft war neben Arbeit "Boden" der wichtigste Produktionsfaktor.
Die industrielle Revolution führte zu einer radikalen Veränderung des Produktionsprozesses. Jetzt wurde Kapital, das heißt ...
Dividend Discount Model S&P 500
(potential fair valuation)
update to the posting #1239
In Oct. and November 2018 the U.S. 10Year-Treasuries reached a yield of ca. 3.25%. Around Christmas Eve the S&P 500 reached its intermediary LOW at around a level of ca. 2,336 points...
...(but I did not look up the exact level). Just by coincident, that level would be confirmed by the DDM-matrix cross-section of 3,25% (10YR-Treas.) and an EPS-level of ca. 160 USD per S&P 500.
"DDM = Dividend Discount Model"
"SPX = S&P 500 / U.S. Stock-Market Index" (see following chart)
If the S&P 500-earnings for ...
Dividend Discount Model S&P 500
(potential fair valuation)
In Oct. and November 2018 the U.S. 10Year-Treasuries reached a yield of ca. 3.25%. Around Christmas Eve the S&P 500 reached then its intermediary LOW at around a level of ca. 2,336 points...(I did not look up the exact level).
Just by coincident, that level would be confirmed by the DDM-matrix cross-section of 3,25% (10YR-Treas.) and an EPS-level of ca. 160 USD per S&P 500.
"DDM = Dividend Discount Model"
"SPX = S&P 500 / U.S. Stock-Market Index" (see following chart)
Now that we are sitting at a 10YR-Treas.-level of ca. ...
Austrian Stock Market
(Valuation / PE-Ratio)
The Austrian Stock Market has a tradition to carry a low PE-multiple (PE = Price-Earnings). Currently the Average-PE in the Market is in the single-digits (8.7 only as per Nov. 2018):
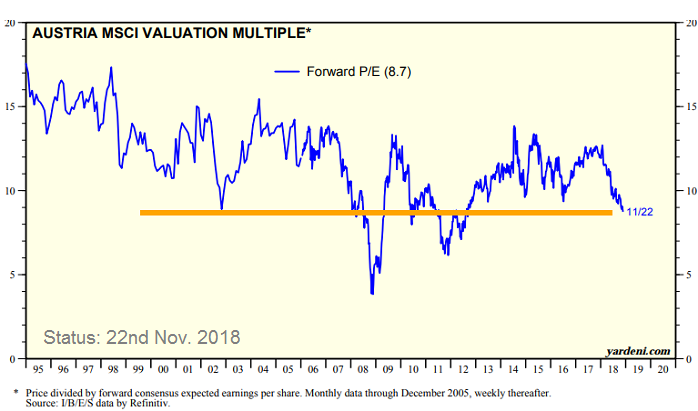
Pretty dirt-cheap Austrian stocks - according to the orange line above...
Price-Earnings Ratio S&P 500 (PE-Ratio S&P 500)
One measure of stock valuation suggests equities haven't gotten overstretched. According to J.P. Morgan Asset Management, the forward price-to-earnings ratio for the S&P 500 stands at 16.8 (Status as per 31st Aug. 2018). That's just slightly...
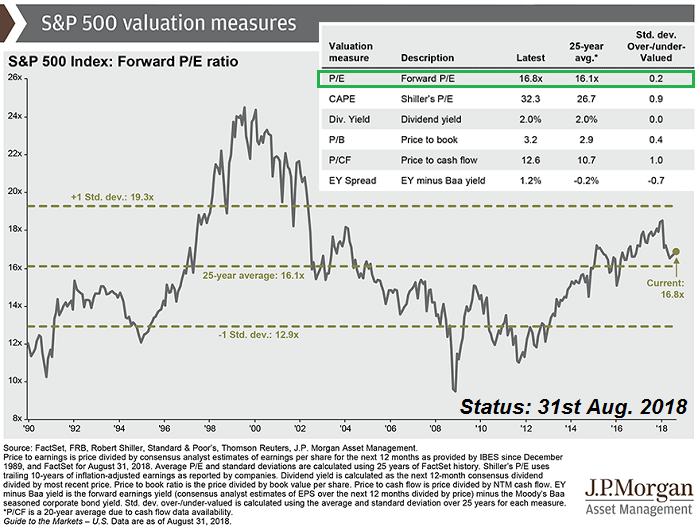
...above its 25-year average of 16.1.
Link:
S&P 500 Fair Value (Based on Fwd-Earnings)
When interest rates were between 4% and 6% in the timeframe 1955 until the year 2014, the stock market traded at an average P/E of 20.4x (P/E = Price-Earnings Ratio). If you put standard deviation bands around the cluster, the range would...
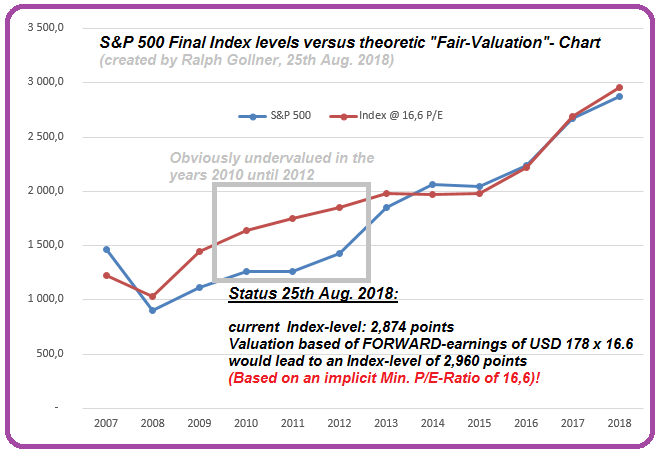
...be 16.6x - 26.6x for one standard deviation.
Valuation (PE-Ratio)
Nasdaq-100
Despite the Index's solid gains in recent years, this has been often matched by growth in forward earnings - such that the forward PE ratio up until the year 2016 had barely changed. In 2017, however, price gains have exceeded...
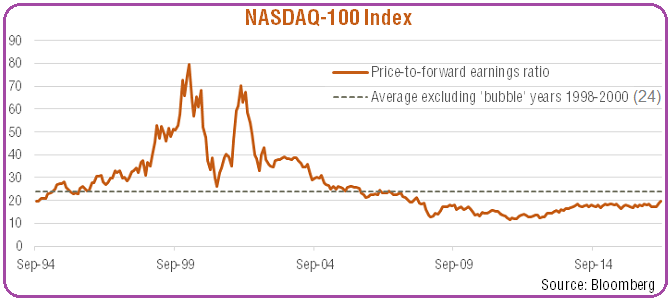
...gains in earnings - such that the forward PE (Price-Earnings) ratio has increased from around 18 in the year before 2017 to ca. 21 by now, July 2018. But it is important to mention that this remains below the market's long-run average (since the mid-1990s) of 27.4. Even stripping out the "bubble" years of inflated PE ...
S&P 500 - Index-earnings (April 2018)
One of the key financial market driver should be the Healthy US profit growth (according to UBS-Bank). Adding it all up, UBS estimates S&P 500 EPS ("index-earnings") will rise 16% to USD 154 in 2018, up from 12% growth in 2017. Earnings growth...
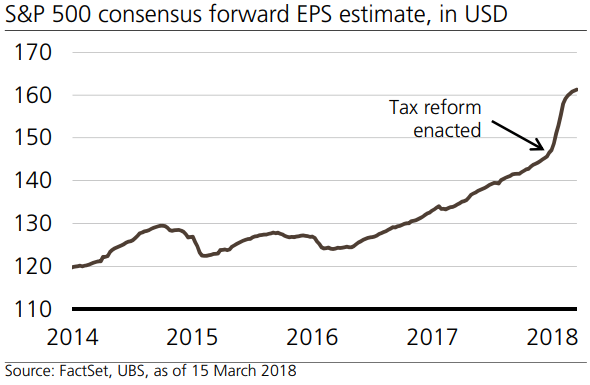
...should slow to a trend rate in 2019 as the one-time boost from a lower tax rate goes away. We forecast 5% growth to USD 162 in 2019 (As a back-of-the-envelope calculation: If you multiply USD 162-earnings times 17 you will arrive at an Index-level of ca. 2,750 points).
According to UBS: Fears that ...
DAX Renditen (März 2018 bis 2026 / 2031)
Natürlich gelten solche Aussagen nur mit einer gehörigen Portion "Augenzwinkern". Nichts ist so unsicher wie die Zukunft, dennoch... Mithilfe von Infos von starcapital-research und meinen eigenen Erfahrungen aus Studium & Co. - voilà:
♦) Aktuelles DAX Preis-Buchwert Verhältnis (KBV): ca. 1,44 (12.100 DAX nach Market-Close / 8.400 Buchwert in Indexpunkten*); Folglich >> mögliche Renditen in den nächsten 10 - 15 Jahren: + 9% per anno (bis + 10.2% p.a.)
♦) Aktuelles Kurs-Gewinn Verhältnis (KGV): ca. 11,62 (12.100 DAX nach Market-Close / 1.040 ...
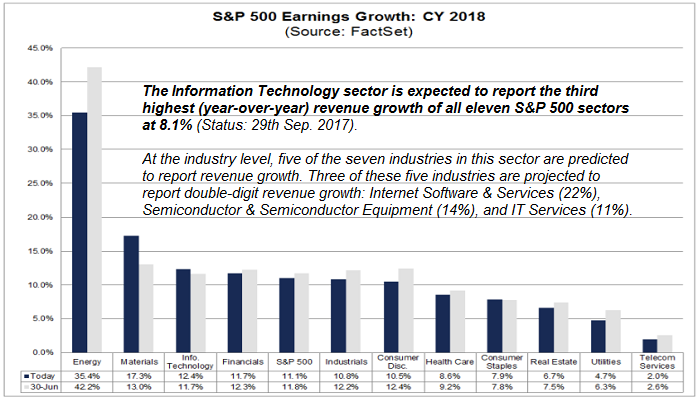
S&P 500 Forward PE
(Status: 8th Feb. 2018)
Info upfront: The IT-Sector now "already" accounts for more than 25% of the S&P 500 Stock Index. But Then might come another question: Why do IT-stocks often perform nicely and -even also- for the majority...
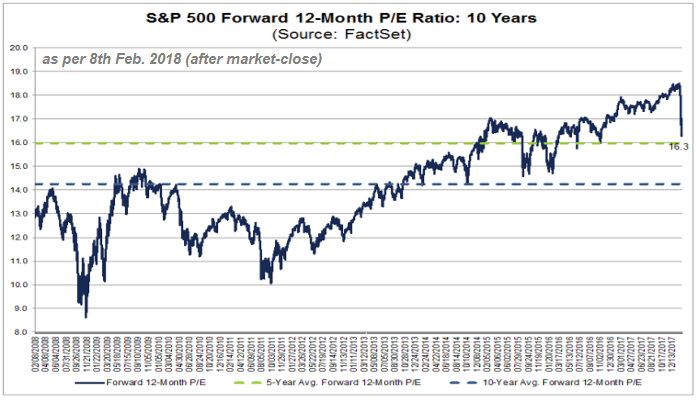
...of StockMarket-observers reasonably well in line with their earnings and sales performance? well, have a look at the most recent numbers:
Information Technology: Internet Software Leads Growth
The Information Technology sector is reporting the third highest (year-over-year) revenue growth of all eleven sectors in the S&P 500 Stock ...
A short "reminder" on US-Treasuries (10 year T-Bond)
& US-Equities-Valuation
♦ Average 10 year T-Bond yield since the year 1871 is ca. 4.6% (Status Q4-2016)
♦ Maximum 10 year T-Bond yield since 1871 is 15.3% (September of 1981)
♦ Current 10 year T-Bond yield...
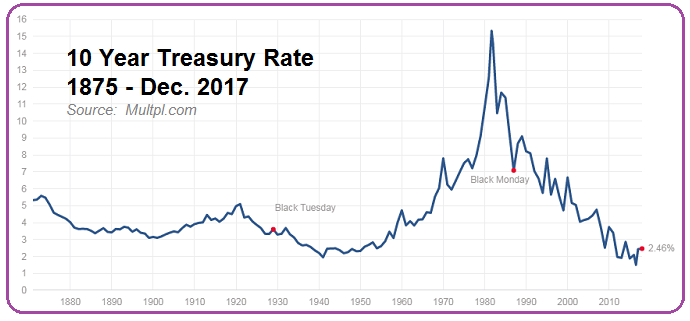
...is 2.497% (as per 20th Dec. 2017, Intraday)
Some theory: In theory lower interest rates cause asset prices (including stock prices) to rise. Here's how: Imagine a stock yields 4% and T-Bonds yield 8%. If T-Bond yields drop to 4%, the stock's yield will look comparatively attractive. "Normally" Investors will pile on and bid up ...
Cash Flow Yield
Question: What best explains the next five years of equity returns?
Answer: Based on the historical record since 1970, the correct answer is: Today's cash flow yield.
Initial cash flow yields offer the best explanation since 1970 (Status: 2013). They account for...
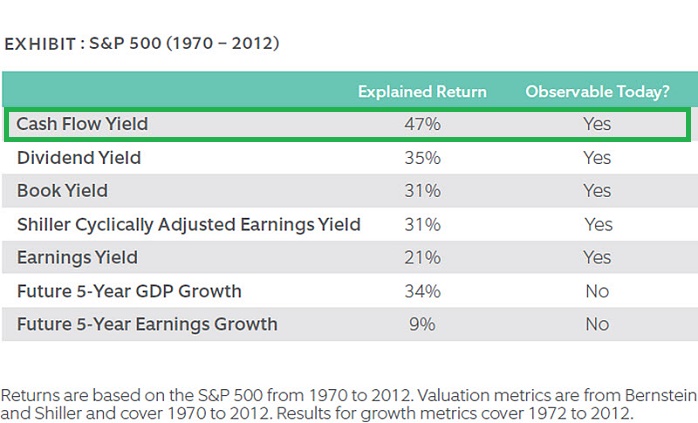
...47% of the variation in subsequent five-year (!) equity returns versus 34% for future GDP growth and just 9% for future earnings growth, a possibly surprising result.
Following exhibit below plots the relationship between 5-year global equity returns predicted from initial cash flow yields (teal) and ...
Check MOAT, then management, but ALWAYS:
Re-check Price
Rarely will the stars align so that great management (skill), moat (of the business/-model) are all clear to be seen for the potential investor and eventually also underpriced by the market (very rare!), so that...
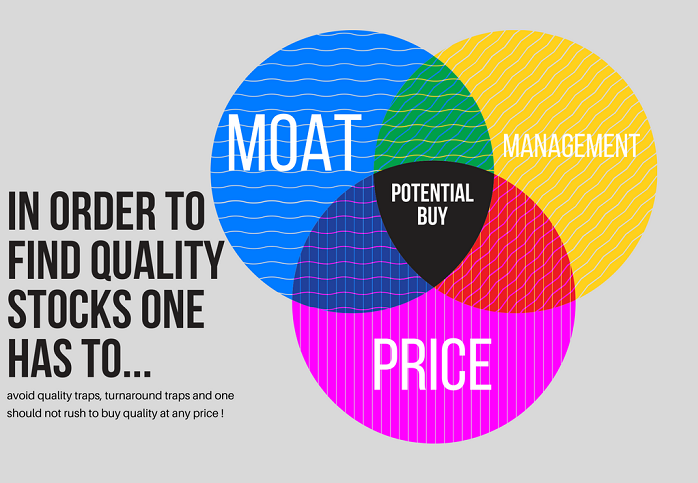
... a clear strong buy is evident. Much more frequently, quality-value investors must wrestle with a situation where one factor is not fulfilling all the criteria searched for - or at least isn't obvious.
As such, it's helpful to challenge the considered company with scenarios with both pitfalls and potential in mind ...
S&P 500 earnings (growth)
The Stock Market currently has some Corporate Profit tailwind. Since 1960, profits [...] have fluctuated around a long-term uptrend line growing at a 7% compounded annual rate. S&P 500 earnings tend to fluctuate between...
...long-term growth uptrend lines of 5% and 7%. As long as the economy continues to grow, forward earnings could continue to provide a good tailwind for the stock market. S&P 500 forward earnings tend to be a good leading indicator of actual operating earnings over the coming year when the economy is growing.
link:
www.factset.com
2014: ...
y2k Tech-Bubble Peak versus US-Stock Market
A short reminder about what really happened in the late 90s (last years of the last century) in the US-Stock Market, but also in global Tech-Stocks (extreme example: "Neuer Markt" in Germany). Please look at the disparity between the P/E-Ratios:
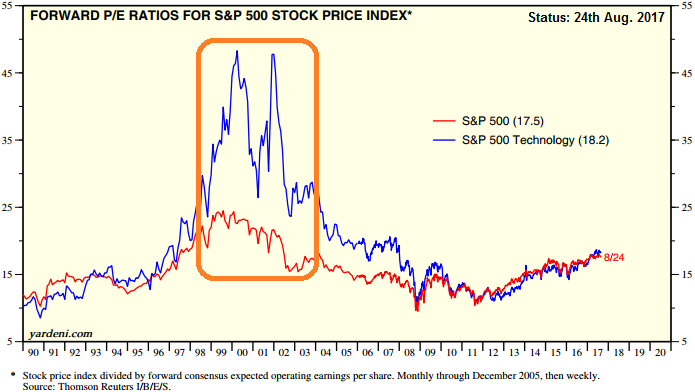
(Definition: P/E-Ratio stands for Price-Earnings Ratio) As one can see from the statistics, you really need Earnings-Growth in the medium- to longterm in order to have a reasonable tailwind to lift stock-valuations or the P/E-ratios. In the late 90s and in the quarters after the last century hit the ...
Value - "Comeback" (?)
For anyone with more than a decade in the markets, the "value premium" is almost a sacred rule. The idea that stocks with lower valuation premiums would beat their more expensive "growth" peers is almost a given. Nobel laureates Eugene Fama and Kenneth French...
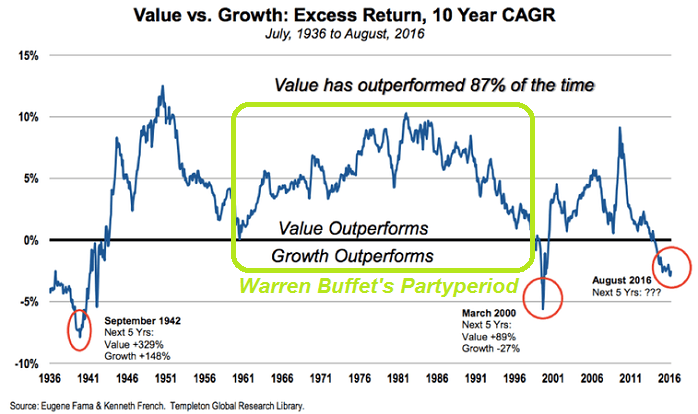
...first identified the value premium in 1992, comparing returns on high book-to-market value stocks against low book-to-market stocks. It's one of the three factors in their asset pricing model built to explain excess returns in a portfolio.
Since the financial crisis, the outperformance of value ...
Risky Sector, but the future "lies in their hands"
BIOTECH
Status @ the start of August (but now we are @ the last day of Aug. and some M&A-Activity has "taken over" - yes, some play on words...): Under-owned, undervalued? While bio-pharma's long-term growth drivers haven't changed, its...
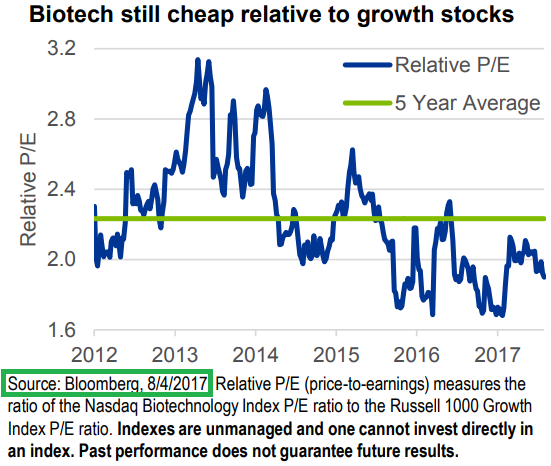
...investor base may have. The momentum breakdown in 2015 and lingering political headwinds led to industry wide outflows and cheapened valuations. Relative valuations - measured here as the ratio of the Nasdaq Biotechnology Index P/E to the Russell 1000 Growth Index P/E ratio - have cheapened over ...
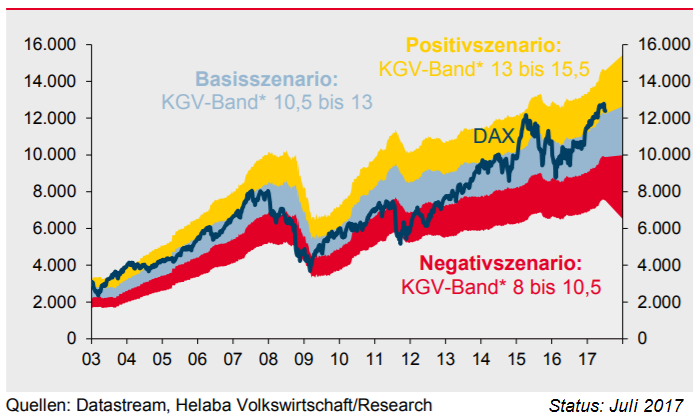
DAX - Bewertungsbänder
In guten Zeiten kann der deutsche Aktienindex durchaus in den gelben Bereich "laufen"; In schwierigeren Zeiten dagegen werden den deutschen Aktien oft nur KGVs von 8 bis 11 zugetraut. Man sieht, KGVs zw. 9 und 16 sind "immer" möglich...
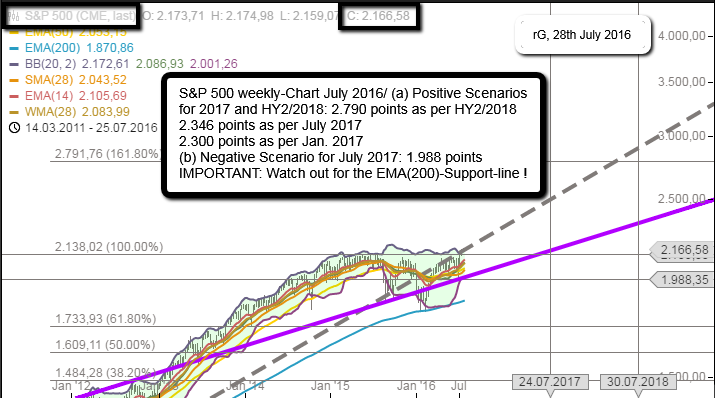
S&P 500 Valuation (HY2 / 2017)
The S&P 500 should be able to trade around a 17-18x P/E Multiple...In the context of the inflation outlook in the U.S. and the developed world, there appears to be little risk for earnings multiples in the short term.
Posting from 11th April 2017 / Valuation S&P 500 (P/E under Inflation): In the context of the inflation outlook in the U.S. and the developed world, there appears to be little risk for earnings multiples in the short term. Historically, zero to 2% inflation has remained the sweet spot for valuations. Please klick here for the original ...
Free Cash Flow (Yield)
Wenn es um die Einschätzung von Unternehmen und Aktien geht, dann ist der beste Weg, eine detaillierte Bewertung durchzuführen. Dies ist ein aufwendiges Unterfangen, welches eine Menge Arbeit erfordert. Daher ist es eine beliebte Vorgehensweise, zunächst einmal...
...mit Kennzahlen zu arbeiten, um eine grobe Ersteinschätzung zu bekommen. Mittels der Aussagen der Kennzahlen kann man dann entscheiden, ob eine detaillierte Analyse zielführend erscheint oder nicht. Kennzahlen sind also eine beliebte und auch sinnvolle Methode, um eine Erstindikation zu erhalten.
...
Bewertung Europa-Aktien versus US-Aktien
Die Grafik zeigt, dass das Kurs-BuchwertVerhältnis europäischer Aktien in Relation zu US-Titeln fast den niedrigsten Stand seit 25 Jahren erreicht hat. Zudem erleben die europäischen Volkswirtschaften derzeit einen simultanen Wirtschaftsaufschwung.
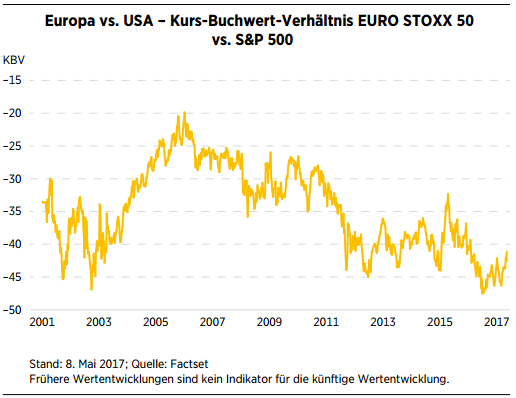
2016 verbuchten alle 28 EU-Länder ein positives Wachstum des Bruttoinlandsprodukts, was zuletzt 2007 der Fall gewesen war. Die bessere Wirtschaftslage in der Region wurde (bisher) allerdings von politischen Sorgen überschattet.
a propos Politik: Das hohe Maß politischer Unsicherheit in Europa durch ...
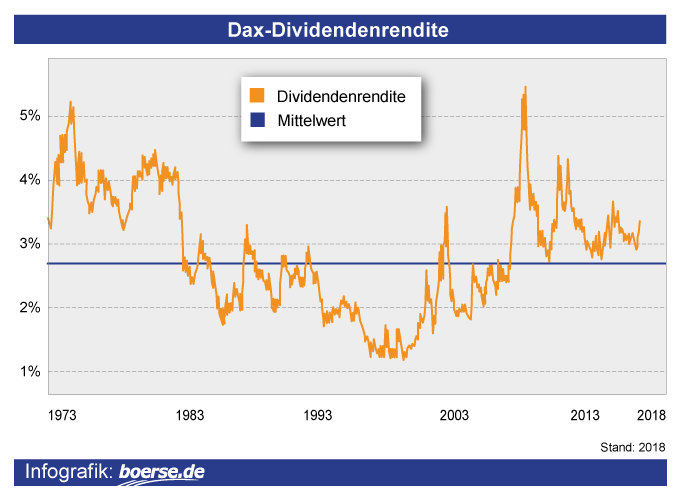
DAX-Dividendenrendite versus...
Die 30 Unternehmen im DAX haben derzeit eine Marktkapitalisierung von 1.200 Milliarden Euro. Die von der CoBa erwartete Dividendensumme von 31,7 Milliarden Euro entspricht daher einer Dividendenrendite von 2,6 %. Die DAX-Dividendenrendite liegt...
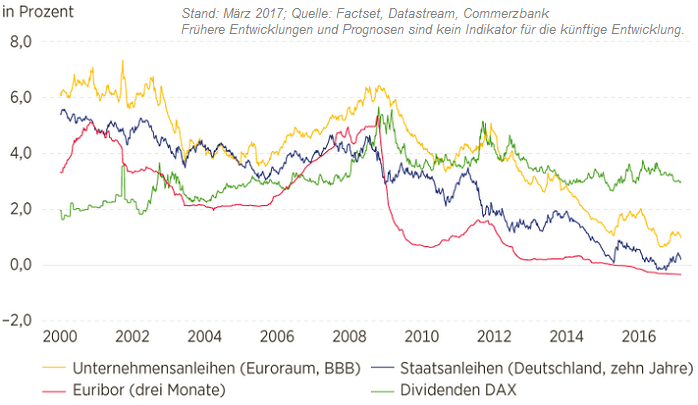
...damit weiterhin deutlich über der Rendite von Unternehmens- und Staatsanleihen (s. Grafik). Beim Kauf der zehnjährigen Bundesanleihe winkt den Investoren derzeit eine Rendite von 0,2 %. BBB-Unternehmensanleihen (also Noch-Investmentgrade) mit einer Laufzeit von drei bis fünf Jahren bieten derzeit Renditen ...
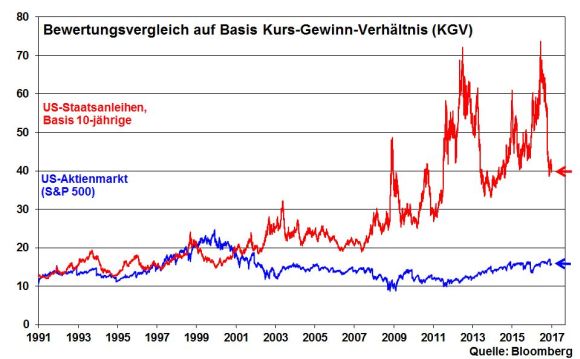
Bewertung "Anleihen versus Aktien"
US-Treasuries (Bonds) versus S&P 500 (Stocks)
Per Q1-2017 rentierten 10-jährige US-Staatsanleihen bei ca. 2,5%. Der Kehrwert dieser 2,5% (also 100/2,5) ergibt ein theoretisches Anleihen-KGV von ca. 40! Das aktuelle KGV des S&P 500 liegt ca. bei 18,5...
Earnings Yield vs. Bond Yield
("Fair Valuation" / Fair P/E ?)
As you learn in finance 101, the value of an asset is based on its future cash flows. To get a present value, you must discount this cash flow, or earnings, using an interest rate. When interest rates are high, the...
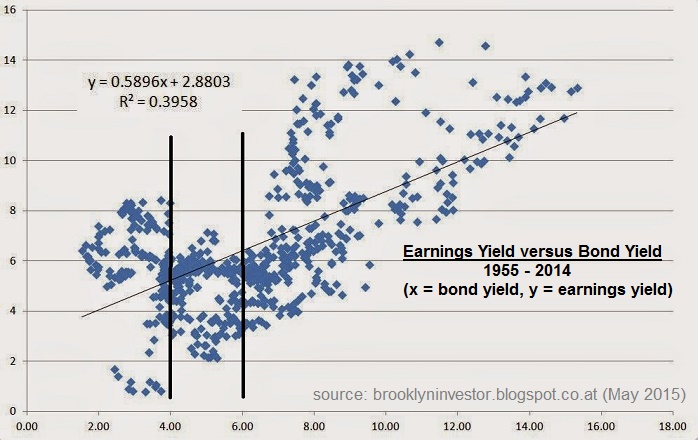
...Price-Earnings multiples (PE) of stocks are low, and vice versa. Thus, the interest rate peaks in 1921 and 1981 correspond to low PE multiples.
We know there is a relationship between interest rates and stock market valuation. Some criticized the old Fed model (10-year bond yields compared to the earnings ...
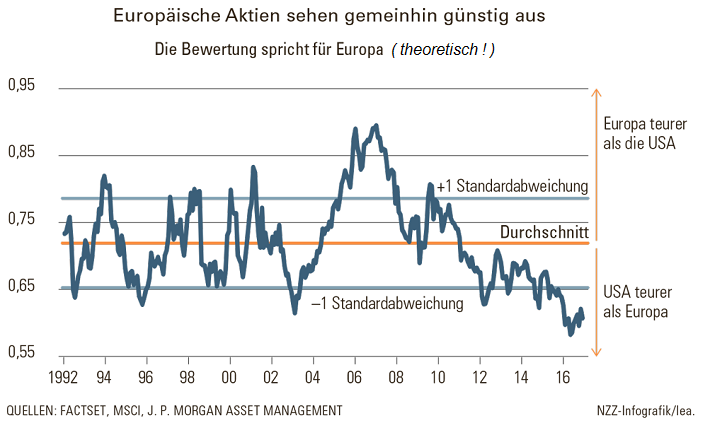
Eine (aktuelle) Analyse von J. P. Morgan Asset Management zeigt, dass das Kurs-Buchwert-Verhältnis europäischer Aktienpapiere im relativen Vergleich mit amerikanischen beinahe den niedrigsten Stand seit 25 Jahren erreicht hat (siehe Chart oben).
Zudem erlebten die europäischen Länder einen simultanen Wirtschaftsaufschwung. Schon im Jahr 2016 haben alle 28 EU-Staaten ein positives Wachstum des Bruttoinlandprodukts verzeichnet, was zuletzt im Jahr 2007 der Fall gewesen war. So gesehen verlangten die politischen Sorgen etwas Mut, um in Europa zu investieren.
Anleger wie David Tepper ...
DAX-Rollierende 12-Monats-Entwicklung und Buchwert
(2001 - 2016)
Der DAX und "sein Buchwert"; Der Buchwert ist der Wert der Unternehmenssubstanz oder grob vereinfacht: das Eigenkapital eines Unternehmens. Bei der Ausweisung des Buchwertes geht es um die Frage, wie...
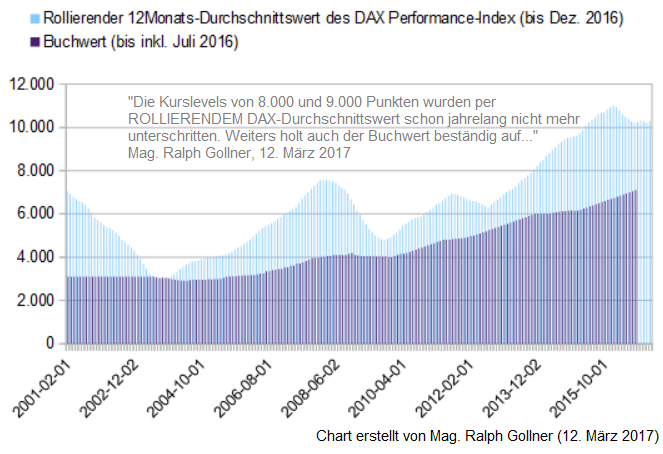
...viel die Produktionsstätten, die Immobilien, die Maschinen, der Fuhrpark, die Firmenbeteiligungen und das sonstige Eigentum eines Unternehmens Wert wären, wenn man sie verkaufen würde und vom Verkaufserlös die Schulden abzieht.
Meist liegt der Börsenwert deutlich über dem Buchwert, das Kurs-Buchwert-Verhältnis ist ...
Price-Sales-Ratio (P/S-Ratio)
1999 vs. 2015
Morgan Stanley's Adam Parker comments on valuations regarding Tech-Stocks. Parker looked a little below the surface in a research note and shared a key difference between the stock markets in 2014/2015 and the dotcom bubble of the 1990's.
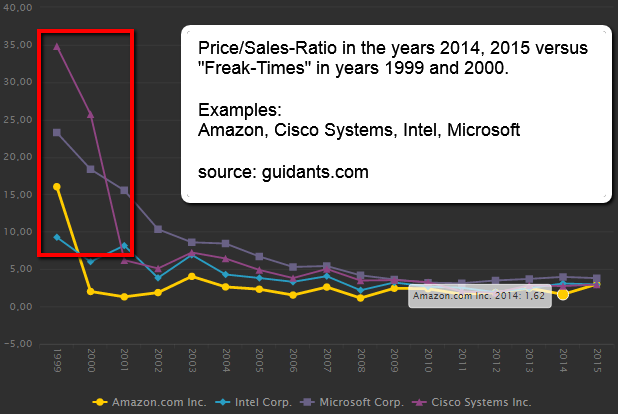
"About 40% of all technology stocks have price-to-sales levels above 5x in the year 2014, 2015, levels seen briefly during the early 1970s but otherwise only during the internet bubble buildup and unwind," he noted.
Because the high-flying tech stocks of the dotcom bubble had no earnings, investors looked ...
DAX-Bewertung 1988-2010
Folgend der fundamentalen Bewertung des DAX und vor dem aktuellen Gewinnumfeld im DAX und der zusätzlichen Erwartung, dass die DAX-Gewinne im Jahr 2017 auf ca. 920 Indexpunkte zulegen könnten (ca. 5% Wachstum), würde dies gleichzeitig...
...auch ein Allzeithoch für die DAX-Gewinne bedeuten. Gleiches könnte sich im Jahresverlauf auch bzgl. dem Buchwert ergeben (erwarteter DAX-Buchwert per 2017: 5% Wachstum auf ca. 7.600 Punkte).
Gleichzeitig muss erwähnt werden, dss der DAX im April 2015 bei ca. 12.370 Punkten sein letztes Allzeithoch markiert hatte. Kurzer ...
DAX (damals) bei KGV 29
freaky Bewertungen aus den 90ern...
Fakt ist, dass im historischen Vergleich der dt. Leitindex, gemessen am KGV, (wohl) noch relativ fair bewertet ist. Im Jahr 2000 lag das KGV bei circa 29. Aktuell (per 13. Feb. 2017 bei ca. 11.700 Punkten) liegt es UNTER 14.
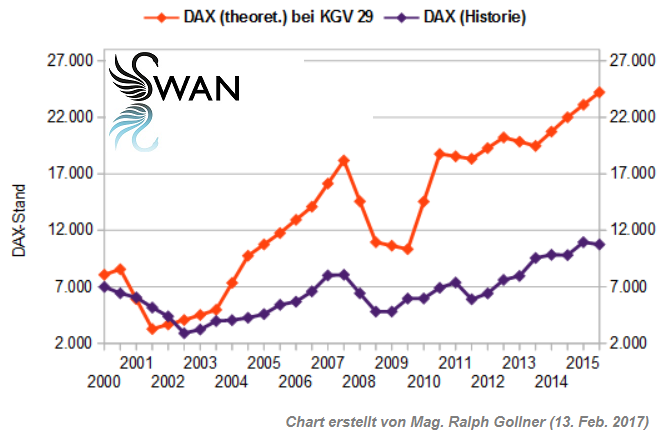
Reminder/Info: Das Dax-KGV/Das Kurs-Gewinn-Verhältnis des Dax wird errechnet, indem man die Gewinne der 30 Dax-Unternehmen mit dem Stand des Index ins Verhältnis setzt. Analysten machen also mit dem gesamten Index nichts anderes als mit einem einzelnen Unternehmen.
Vergleicht man die durchschnittlichen ...
Emerging Markets
(Valuation)
In terms of valuations, the MSCI Emerging Markets Index has traded at a significant discount to the MSCI World Index, for example, on a price-to-earnings-multiple basis. ("But") earnings growth trends have improved markedly during 2016!
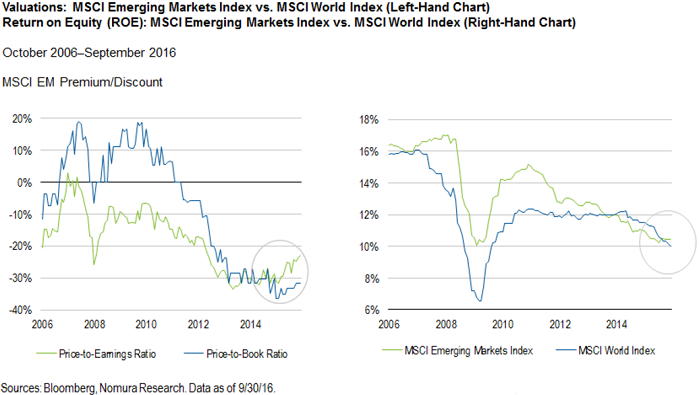
Emerging-market countries are still far behind their developed-market counterparts when it comes to overall GDP-per-capita, and so one may continue to expect strong growth prospects over the long term.
One important factor, which can favor and should sustain the "catch-up development" over the long term is that the ...
DAX-Bewertung, EM-Bewertung (Q4-2016)
(Mögliche Renditen 2016 -2031)
"Unter Schwankungen bergauf"; Unter der Annahme, dass die Zusammenhänge der letzten 130 Jahre fortbestehen, lassen sich auf Basis aktueller CAPE und KBV langfristige Renditeschätzungen für Aktienmärkte ableiten.
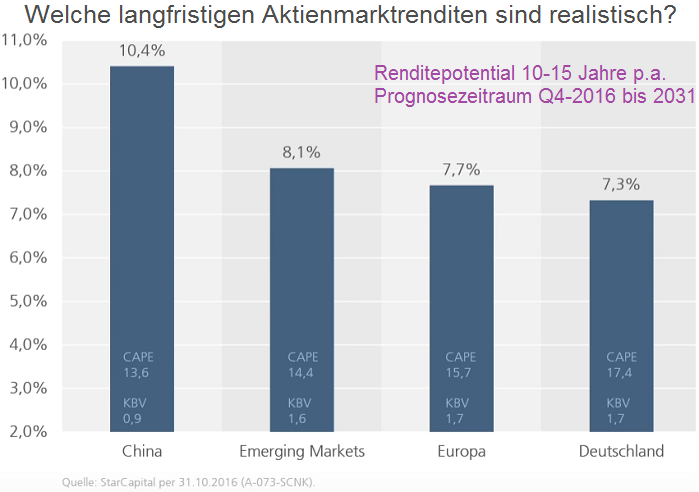
Höhere Aktienmarktrenditen sind etwa in einigen europäischen Märkten inklusive Deutschland möglich/zu erwarten: Der deutsche Aktienmarkt wird beispielsweise per Okt. 2016 mit einem CAPE von 17,4 und einem KBV von 1,7 bewertet. In der Vergangenheit folgten auf Perioden mit vergleichbaren Bewertungen im Mittel ...
Cash Flow and S&P 500 - connection
(correlation?)
There are several ways to estimate an intrinsic stock valuation. Companies have an intrinsic value, and that intrinsic value is based on the amount of free cash flow they can provide during their effective lifetime.
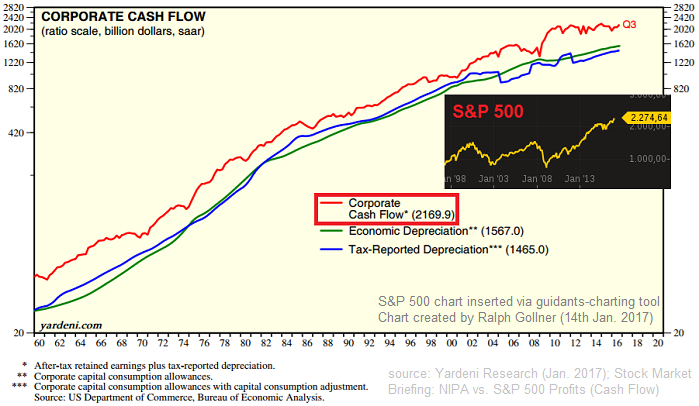
Money later is worth less than money now, however, so future free cash flows have to be discounted at an appropriate rate.
But stock valuation is not that easy in practice, because we can only estimate future free cash flows. This valuation approach, therefore, is a blend of art and science. Given the inputs, the outputs ...
Back-of-the-envelope calculation (?)
Aswath Damodaran is a Professor at the Stern School of Business at New York University and Expert when it comes to Valuation(-techniques). He estimates expected cash flows from dividends and buybacks from holding the S&P 500 for the next five years,...
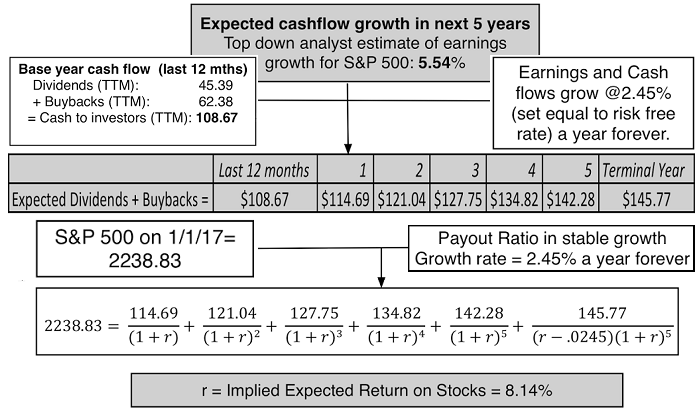
...using the trailing 12-month cash flow as his starting point and an expected growth rate in earnings as proxy for cash flow growth. He then used these estimates, in conjunction with the index level on 1st January 2017, to compute an internal rate of return (a discount rate that will make the ...
Valuation S&P 500 (quick n dirty)
Source for the data below: FactSet, Standard & Poor’s, Tullett Prebon, J.P. Morgan Asset Management. The P/E ratios are forward P/E ratios.
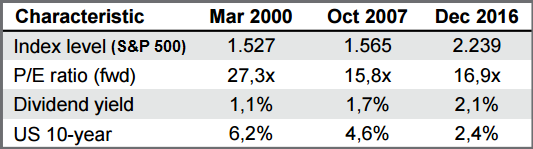
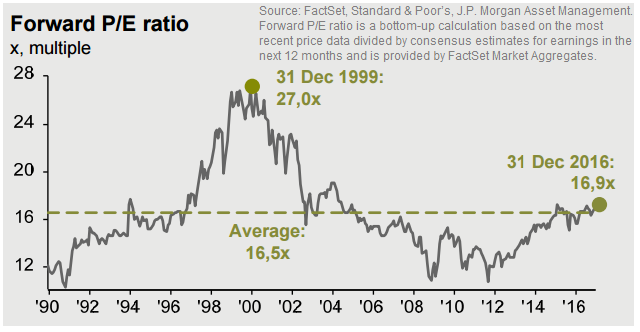
Forward P/E ratio is a bottom-up calculation based on the most recent price data divided by the mean consensus estimates for earnings in the next 12 months and is provided by FactSet Market Aggregates (Data as of 31 December 2016). To put the P/E ratio into historical perspective one can take a look into the last decades, to be more precise: the period from 1990 up to December 2016:
NIPA-Profits (S&P 500-PE-Ratio/"NIPA"/Jeremy Siegel)
Professor Siegel substitutes NIPA data for S&P earnings and produces a metric with higher explanatory power, suggesting that stocks may not be as expensive as previously assumed.
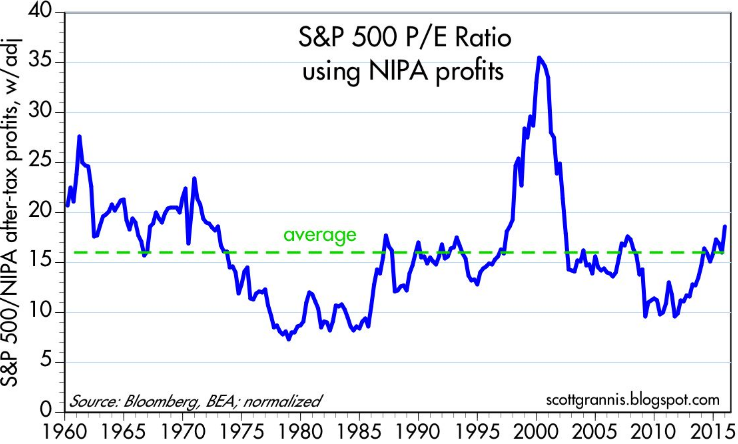
The chart above calculates the PE ratio of the S&P 500 using corporate profits as calculated in the GDP stats as the "E", and normalizing the result to match the average of the conventional PE ratio. (It also assumes that the S&P 500 index is a decent proxy for the price of all corporate equities, which is quite defensible.) This arguably has several ...
S&P 500 Forecast (2015, 2016)
The S&P 500, which tracks the biggest U.S.-listed companies closed on Thursday, 31st Dec. 2015 at 2,043 points. It ended the year down 0.73 percent after three straight years of double digit gains.
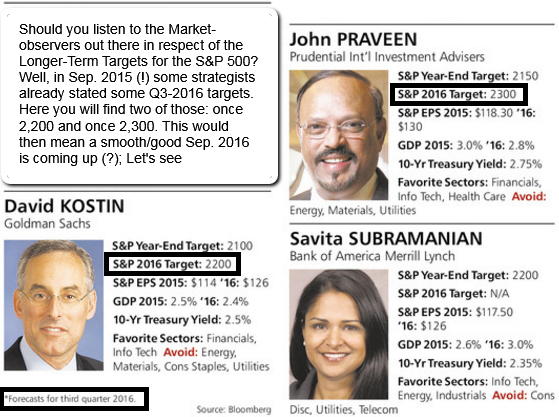
It marks a significant change from the 11.5 percent gain posted in 2014 and is also some way off forecasts collated by CNBC in December 2014. A mean average of the ten analysts' calls suggested the benchmark would finish 2015 at 2,185 points, with a gain of just over 6 percent. An updated version of the Forecast-set was issued then in May 2015, still ALL ...
Shiller PE (1881 - 2016)
One of the primary weapons that rational bubblers use to back up their case is the Cyclically Adjusted Price Earnings (CAPE), a measure developed and popularized by Robert Shiller, Nobel prize winner...
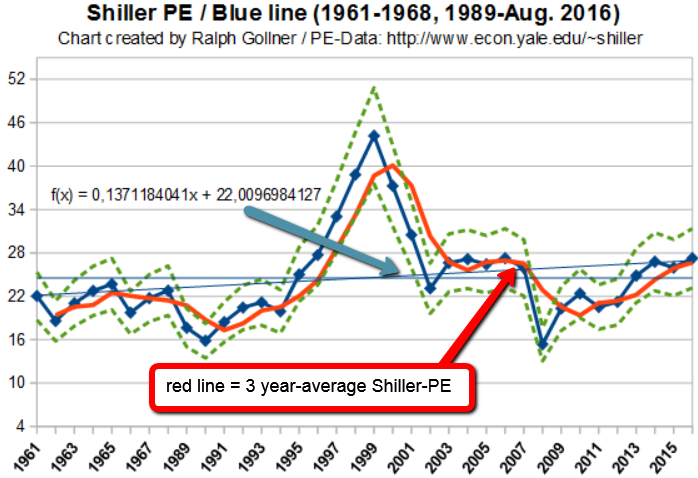
...whose soothsaying credentials were amplified by his calls on the dot com and housing bubbles. For those who don’t quite grasp what the CAPE is, it is the conventional PE ratio for stocks, with two adjustments to the earnings. First, instead of using the most recent year’s earnings, it is computed as the average earnings over the prior ten years. Second, to ...
CAPE-Ratio vs. T.BOND PE
The current CAPE of 27.27 is well above the historic average of 16.06 and if you buy into the notion of mean reversion, the case makes itself, right? Not quite! (Status: 24th Aug. 2016)
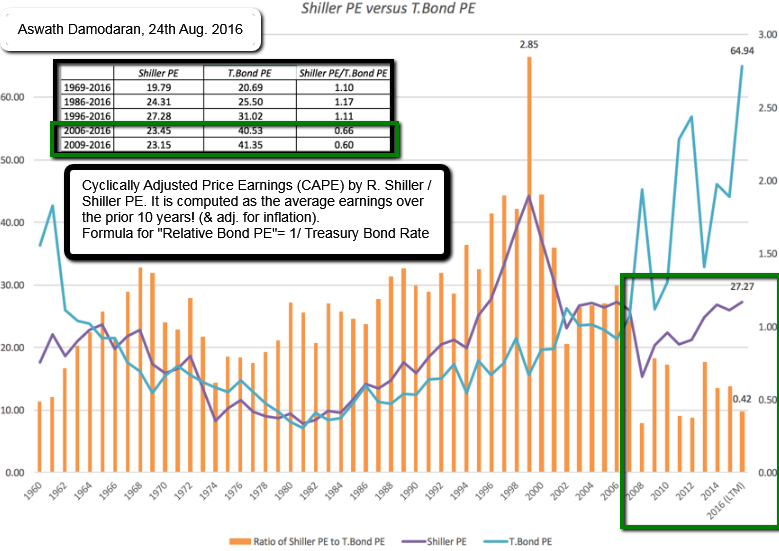
As you can see, even within the CAPE story, there are holes, largely depending upon what time period you use for your averaging. Relative to the full history, the CAPE looks high today, but relative to the last 20 years, the story is much weaker. Contrary to popular view, mean reversion is very much in the eyes of the beholder.
Investing is relative, not absolute
...
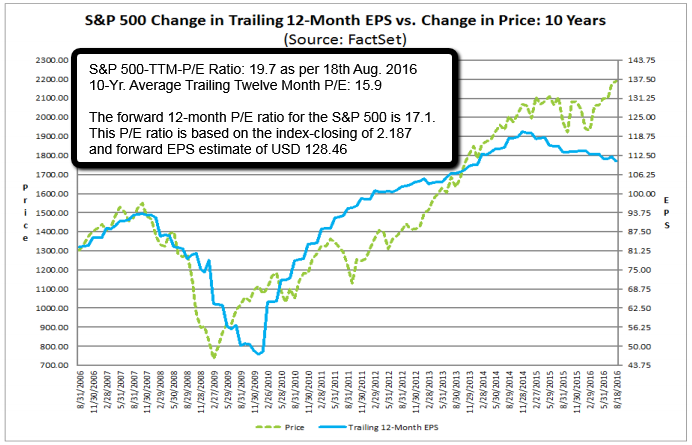
S&P 500 (TTM/Trailing Twelve Month Earnings)
There are different sources regarding EPS-figures out there in the market. Here I want to show the EPS-figures, distributed by factset-research. Below following chart I will show then a longterm-P/E-history since 1990.
 original chart-source: https://www.factset.com
Of course, one can see, that the market is currently not carrying a single-digit P/E-Ratio. Still, one has to think about the FED-Model and its implicit comparison between stocks and bonds. Bonds normally serve as the alternative to stocks - but with a bond-yield below the ...
S&P500 dividend yield vs. 30-year U.S Treasury bond
On 8th July 2016, the dividend yield on the S&P 500 was higher than the yield on the 30-year U.S Treasury bond for the first time since March of 2009 and this, of course, makes no logical sense at all...
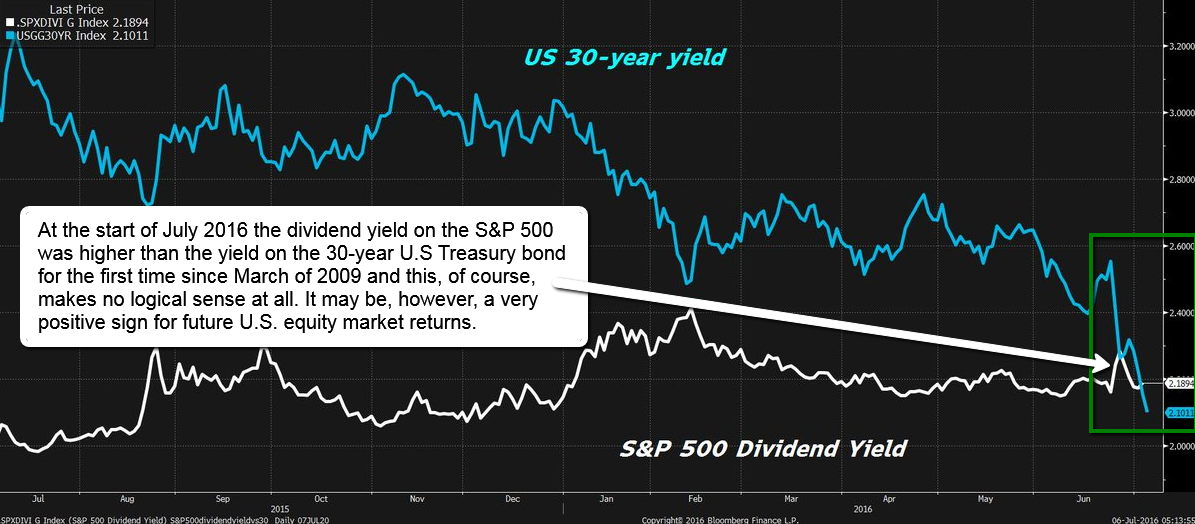
It is, however, a very positive sign for future U.S. equity market returns. On that day the yield on the 30-year Treasury bond fell to 2.10% , below the 2.14% dividend on the S&P 500.
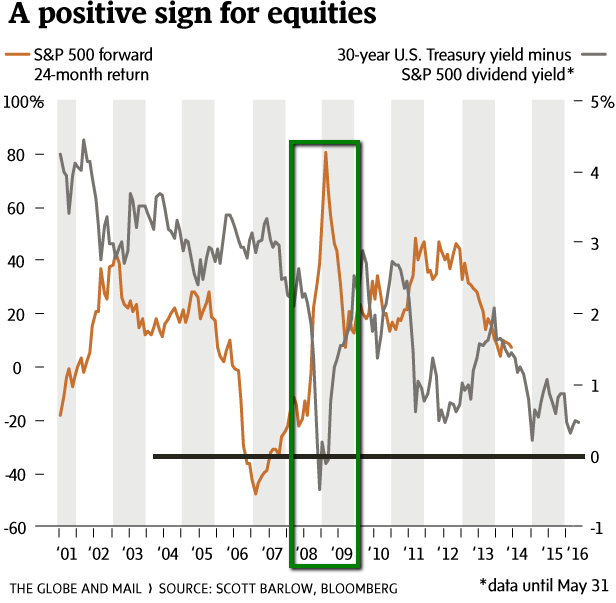
The reason this is illogical is that it means investors were willing to lock in a smaller income stream in the bond, instead of the higher indicated ...
S&P 500, ROE & Price/Book-Ratio
(1999 - June 2016)
Return on Equity (ROE) is now lagging for several quarters. One should highlight in this respect the historical relationship between ROE and the S&P 500-price/book ratio. Investors typically reward superior profitability with...
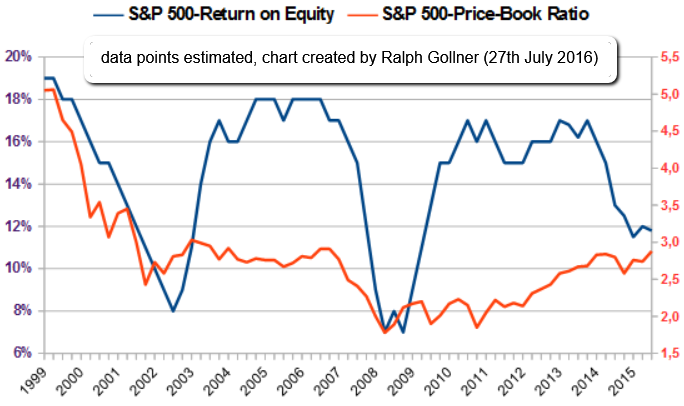
...higher valuation (higher ROE leading to higher PB-Ratios). History-RECAP: Q1-2014 & Q4-2013 (!) S&P 500 ROE dropped to 16.2% that time, and the book value reached USD 688, indicating a price/book value of 2.75x at that time.
The analysts pointed out that time the relationship between profitability and ...
DAX-Kursindex & DAX-Buchwert
(1999 - 26. Juli 2016)
Der DAX-Kursindex hat seit dem Jahr 1999 eine wahnwitzige Berg- und Talfahrt hinter sich. Per 26. Juli 2016 notiert diese DAX-Variante (der DAX-Kursindex) UNTER dem Hoch aus dem Jahr 2000!
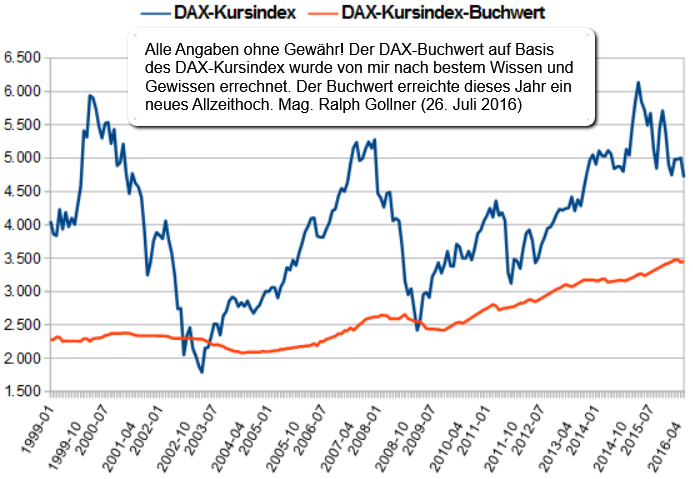
Reminder #1: Die wichtige Unterscheidung zwischen einem Kurs- und Performanceindex! Den Dax gibt es in beiden Varianten, wobei der Performanceindex die gebräuchlichste Variante darstellt. Dividenden- und sonstige Zahlungen an die Aktionäre werden bei der Berechnung des Performance-Index in den Index reinvestiert. Beim Kursindex dagegen wird der ...
Dax-Kurs-Buchwert-Verhältnis (Juni 2016)
Buchwert-Rückschau: 1996 bis 06/2016
Parallelen 2004, 2010/2011, und auch 2016 (?) bzgl. der KBV-Bewertung im DAX; So ist im Jahr 2010 das KBV für den Dax von 1,50 Richtung 1,30 gefallen (KBV v. 1,3 impliziert aktuell einen floor bei ca. 9.230 im DAX):
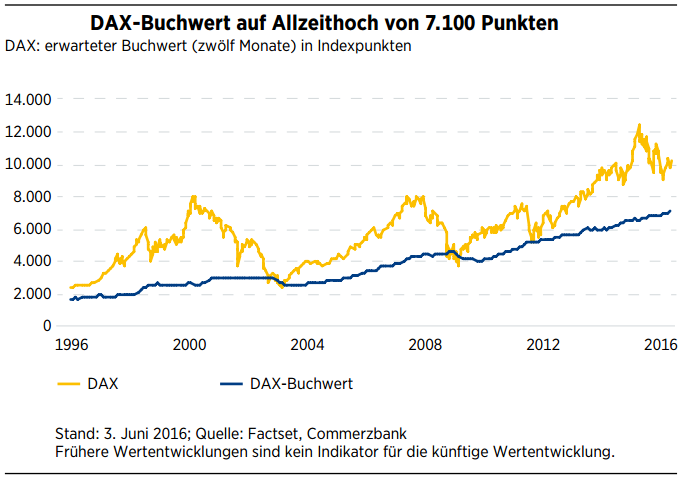
Dies hat damals laut Commerzbank-Analyst Andreas Hürkamp auch an das Nachrezessionsjahr 2004 erinnert, als der Dax im August 2004 einen Boden bildete. Damals fiel das KBV des Dax von 1,53 im Januar auf 1,29 im August. Auch 2010 hat sich das KBV ähnlich im Jahresverlauf verringert.
Wiederholt sich ...
Rule of 20 (PE of 18.9 reasonable?)
Status: June 2016
Many market commentators have been banging the drum about the stock market being overvalued for a long time and they primarily cite the almighty and high P/E ratio. But there is also the "famous (?) Rule of 20":
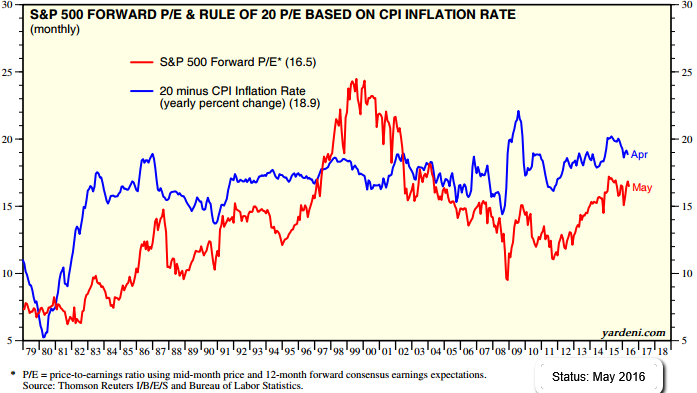
Looking only at the "naked Price/Earnings" may only give you half the picture of the current possible "overvaluation" of the market. The current forward P/E-ratio of the S&P 500 is (slightly above) around 16.5; One should also remember the S&P 500-P/E-ratio/its post-recession low of 11.1 times in August 2011. That compares to ...
S&P 500 earnings (actuals & estimates, I/B/E/S)
Thomson Reuters
The current earnings estimates for the S&P 500 are more or less near the actual earnings in 2014. The index is also more or less near the level, the stock-barometer reached 18 months ago...
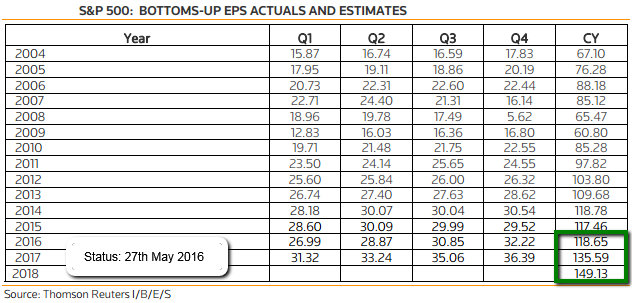
link (.pdf), 27th May 2016: http://www.trpropresearch.com/pdf/This_Week_In_Earnings.pdf
The Fed Model
The basic theoretical idea behind the model is simple. An investor faced with buying bonds or equities might choose between a 10-year U.S. Treasury yielding, say 5%, or buying an equity with an earnings yield (earnings/price) of 5%.
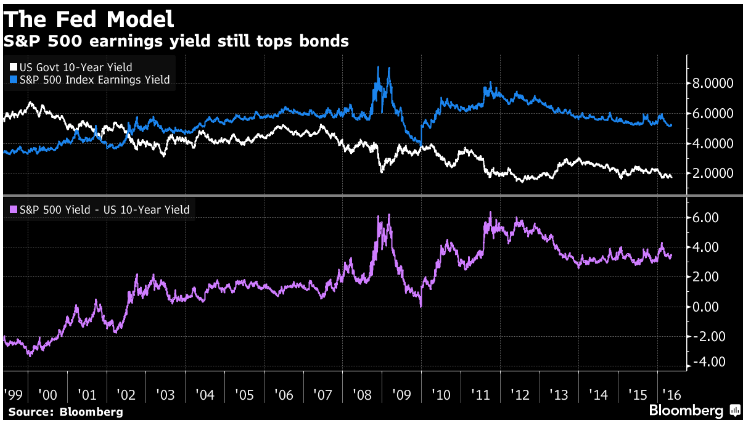
Roughly speaking, when the Treasury yield is below that of equities then it makes sense to buy equities, and vice versa.
The chart above compares the long-term performance of these two variables. As said: As a rough guide, when the earnings yield (in blue) is above the 10-year Treasury yield (in white) then equity markets are seen to be ...
EPS and S&P 500
(Earnings and the broad US-Stock Market)
Nobody knows why markets move as they on a day-to-day or month-to-month basis. But long-term returns hinge on earnings-per-share (EPS) growth & dividends, as can be seen below. "It's not the economy, stupid", but the earnings-per-share.
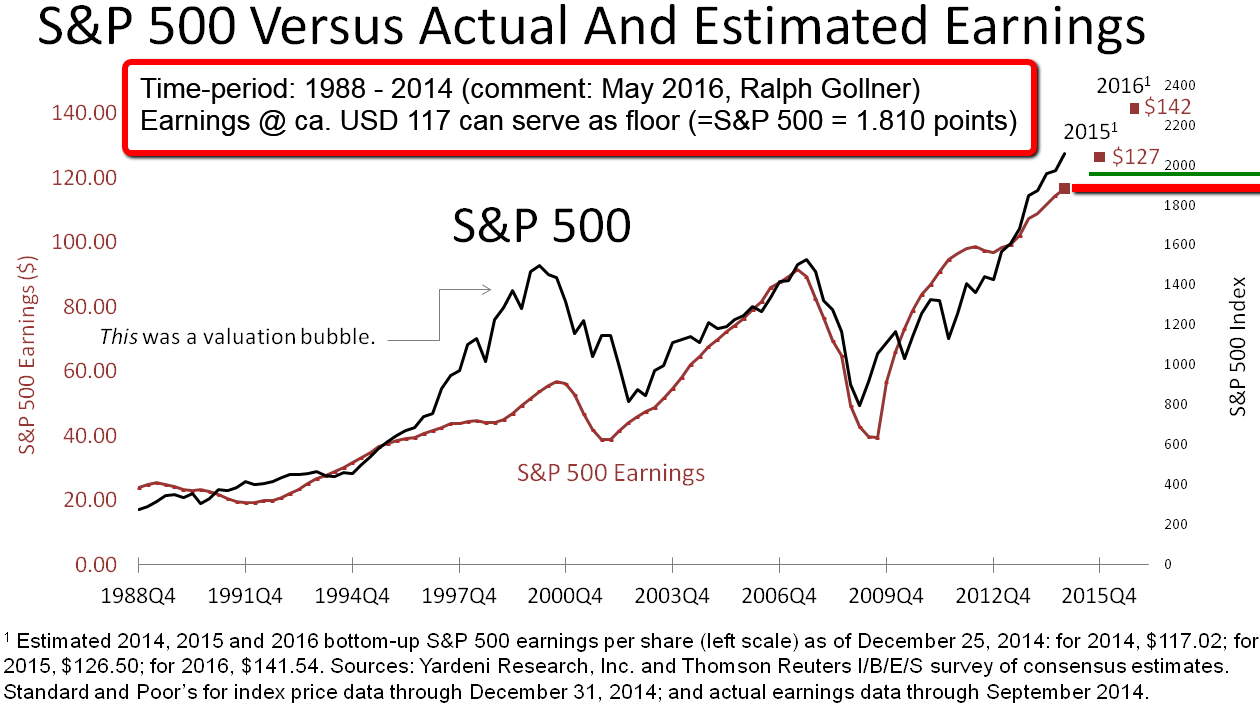
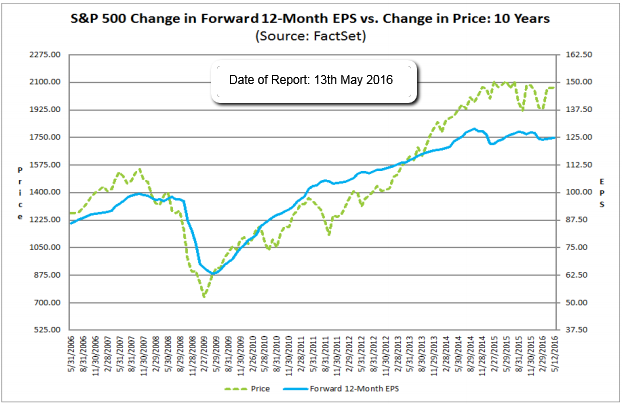
As one has been able to read in several studies from different sources, overall GDP growth seems to have no effect on long-term stock returns if it’s not accompanied by earnings-per-share growth and dividend growth.
In the two graphs above one could follow, that a Forward-EPS as per May 2016 of ...
Berkshire Hathaway (P/B-Valuation)
time period: 2000 - May 2016
In his book "One Up on Wall Street", Peter Lynch, maybe the best mutual fund manager ever, revealed a powerful charting tool that helped him to achieve a gain of 29.2% in his portfolios for 13 years.
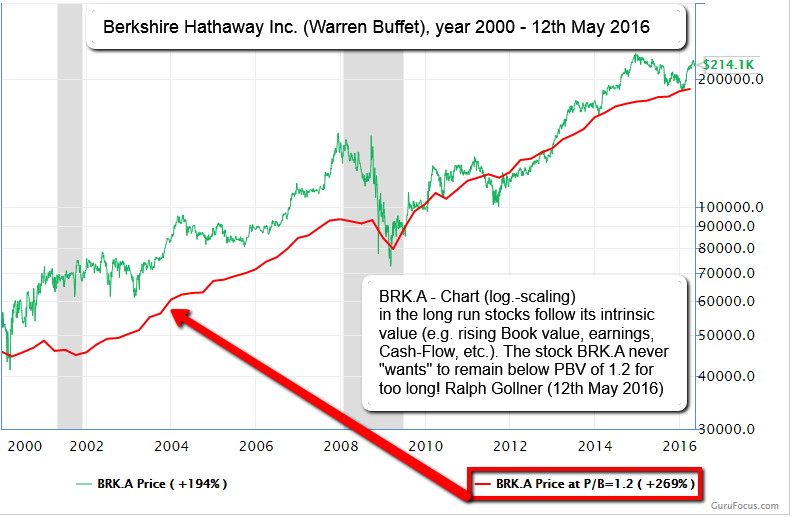
In his chart, Peter Lynch drew the stock price and the earnings per share together and aligned the value of USD 1 in earnings per share to USD 15 in stock price. He wrote in pages 164-165 of the book:
"A quick way to tell if a stock is overpriced is to compare the price line to the earnings line. If you bought familiar growth ...
Valuation NYSE / Morningstar Tool
A ratio below 1.00 indicates that the Index-level is lower than Morningstar's estimate of its fair value. The further the price/fair value ratio moves below 1.00, the more the median stock is undervalued.
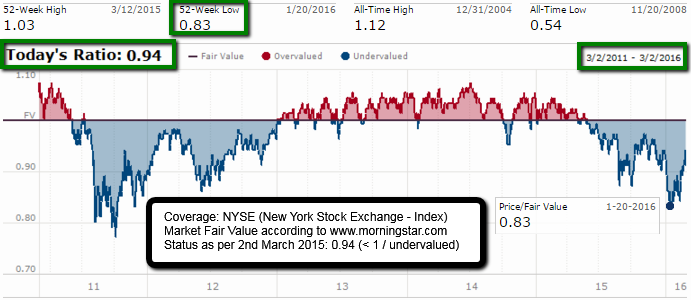 source: http://www.morningstar.com
Magic Formula Investing (Joel Greenblatt)
Joel Greenblatt recommends buying a portfolio of 20-30 Magic Formula stocks, holding for one year, and then re-running the process annually. Check out the Internet-site provided by Joel Greenblatt (s. screenshot/picture below).
 picture/source: http://creativecommons.org/licenses
It’s hard to take something called a “Magic Formula” seriously. But you should. It’s beaten the market by a wide margin over the past two decades and with less volatility (Status by the year 2013!).
The Magic Formula - a stock screener designed by hedge fund guru Joel ...
Shiller-KGV & Gewinnpotential (Jan. 2016)
Wer bei einem Shiller-KGV von weniger als zehn in Aktien einsteigt, streicht in den folgenden zehn bis 15 Jahren im Mittel eine Rendite von 12,3 % p.a. ein. Bei einem KBV von < 1,0 sind sogar Renditen in Höhe von gut 14 % pro Jahr drin.
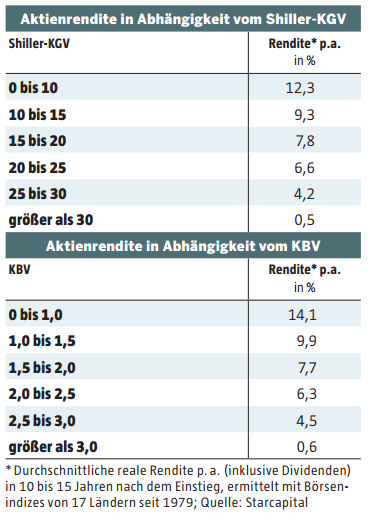
Sind die Einstiegsbewertungen dagegen hoch, schrumpfen die Gewinne deutlich. Wichtig bei diesen Zahlen: Sie sind real angegeben. Die Inflation, die stets an den Gewinnen nagt, ist schon abgezogen! Währungseinflüsse werden dagegen ignoriert. Eine steigende Fremdwährung kann die Gewinne für Anleger aus der ...
Abweichung vom "Gewinn-DAX"
Abweichung vom MEDIAN-Gewinn-KGV
Die Grenze der gerade noch typischen Unterbewertung im DAX liegt per Feb. 2016 bei ca. 9.100 Punkten; Historisch schwankte das DAX-12-Monats-Forward-KGV zwischen 7,6 im Tief und 32 im Hoch (Fehlbewertungsgrenzen im folgenden Chart):
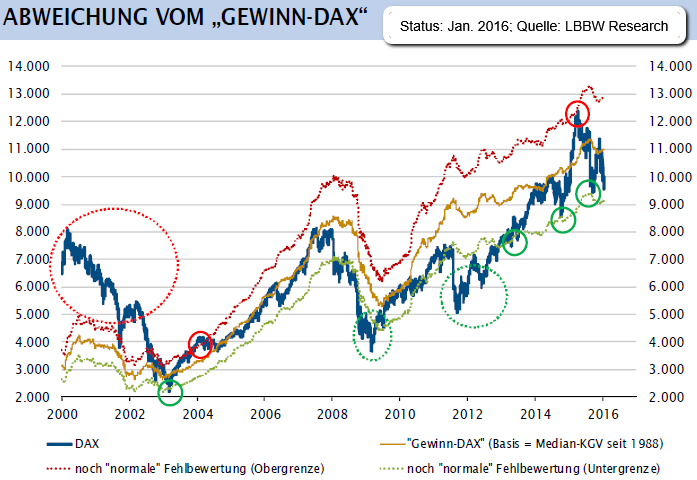
Die starke Korrektur, welche Ende November 2015 begann und sich im neuen Jahr weiter beschleunigte, drückte das DAX-KGV von damals 13,9 noch tiefer.
War der deutsche Blue-Chip-Index vor wenigen Wochen noch etwas teurer als in seinem historischen Median (13,3), ist er nun so günstig wie selten ...
Price-Book-Value S&P 500 (history up to Aug. 2015)
Some investors put more "faith" in the Price/Book Value ratio than the P/E ratio when assessing the valuation of stocks or the stock market as a whole. As a result, Forbes conducted a historical review of Bloomberg data for the S&P 500.
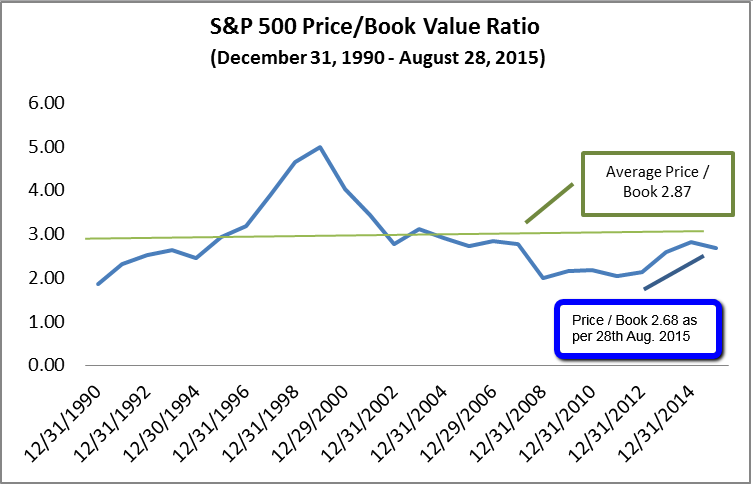 Source: Bloomberg, 28th August 28, 2015. Past performance is not indicative of future results
The average Price/Book Value ratio of the S&P 500 for the period December 1990 - August 2015 is 2.87 (according to the mentioned Forbes-article). The Price/Book Value ratio of the S&P 500 as of 28th August ...
Shiller PE-Ratio (Feb. 2016) vs. S&P 500/Market Timing
Following the idea of a valuation-based market timing-model and tactical asset allocation models based on the Shiller PE ratio (PE10), the following model was tested for the time period 1988 up to 2015 (versus the S&P 500):
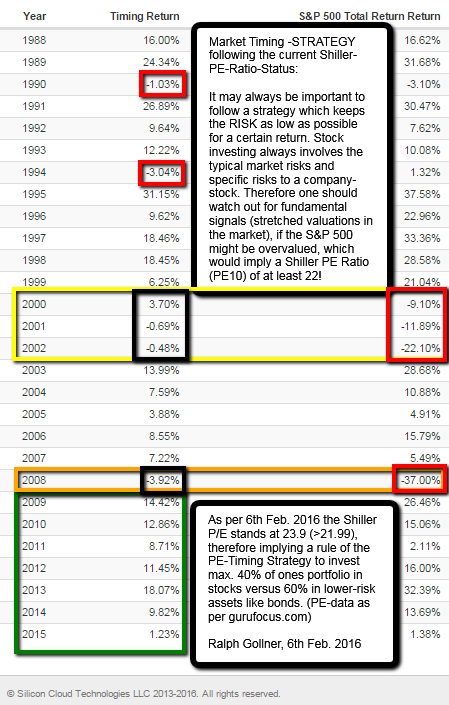 The underlying logic for tactical strategy shifts is the current market valuation/Shiller PE Ratio (PE10) which leads to the dynamic allocation between stocks and bonds (1) 40% vs. 60%, (2) 60% vs. 40%, or (3) 80% stocks versus 20% bonds.
♦ (1) If PE10 >= 22, then the portfolio allocation shall be 40% stocks, ...
Valuation CAPE & Price-Book as per 31st Dec. 2015 (Selected global markets)
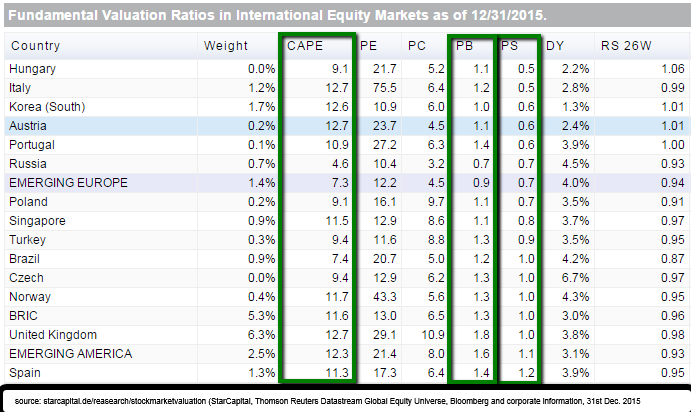
direct link: http://www.starcapital.de
In a most recent article (Bloomberg, as per today: 21st January 2016) it was mentioned that Hong Kong stocks fell below the value of their net assets for the first time since 1998 as concerns over capital outflows and China’s economic slowdown sent the Hang Seng Index deeper into a bear market.
The benchmark gauge has a price-to-book ratio below one, a level unseen since the Asian financial crisis roiled regional markets and popped a domestic property bubble almost 18 ...
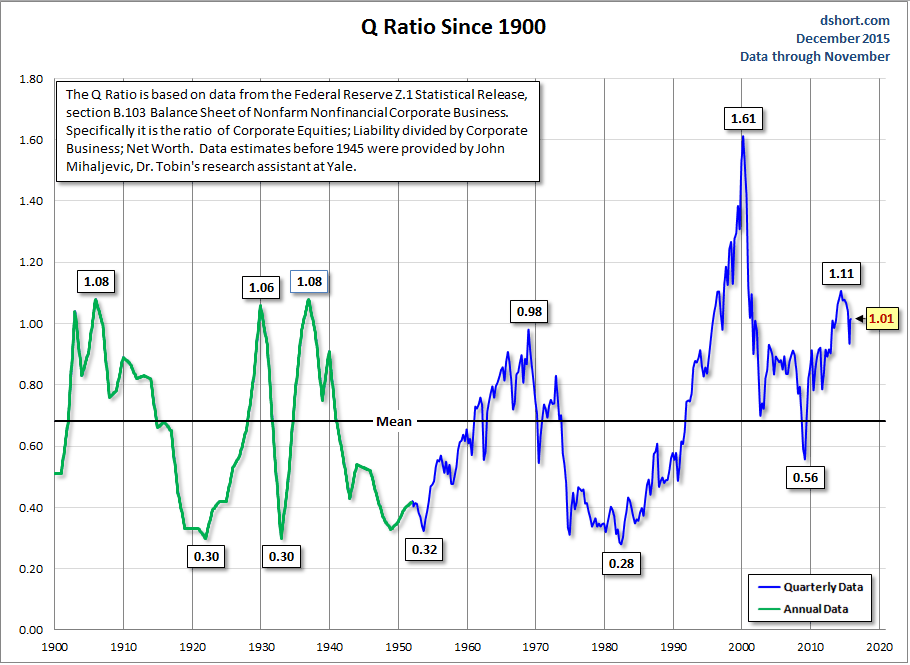
Tobin's Q
Diese Variation der Buchwertanalyse wurde 1969 vom Yale-Ökonomen und Nobelpreisträger James Tobin entwickelt.
 http://www.advisorperspectives.com
Die Tobin’s Q-Ratio stellt den Unternehmenswert (Enterprise Value, EV, einfach definiert als Börsenkapitalisierung plus Nettoschulden) ins Verhältnis zum Wiederbeschaffungswert aller Aktiven einer Gesellschaft.
Eine Q-Ratio von 1 bedeutet theoretisch, dass ein Unternehmen fair bewertet ist: Der Enterprise Value entspricht genau dem Betrag, der ausgegeben werden müsste, um das Unternehmen exakt nachzubauen. Die mittlere Q-Ratio für ...
Valuing Wall Street: Protecting Wealth in Turbulent Markets (Book on q ratio)
When Valuing Wall Street was published in March 2000, the following statement was set out on the cover of the book:
"The U.S. stock market is (was in the year 2000) massively overvalued. As a result, the Dow could easily plummet to 4,000 - or lower - losing more than 50% of its value wiping out nest eggs for millions of investors." So argue Andrew Smithers and Stephen Wright in Valuing Wall Street: Protecting Wealth in Turbulent Markets. Using the q ratio developed by Nobel Laureate James Tobin of Yale ...
US-Stocks (Valuation-History up to 2015)
Price/FCF historical average (1986 - 2015) / Average EXCL. Tech Bubble: 24.8 (Valuation as per Feb. 2015: 23.3);
It may also be of interest to know, that the S&P 500-Index stood slightly above 2,100 points on the 27th Feb. 2015.
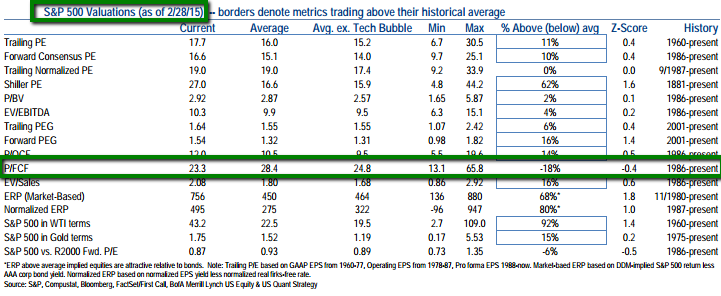 source re. Price/Free-Cash-Flow, etc. - History (S&P 500): http://www.merrilledge.com
EV/EBITDA-History (S&P 500): http://www.zerohedge.com
EV/EBITDA per company: http://www.infinancials.com/
Related Articles
Worldwide Rig Count 2010- 5/2015 (OIL / business barometer)
Baker Hughes has issued the rotary rig counts as a service to the petroleum industry since 1944, when Hughes Tool Company began weekly counts of U.S. and Canadian drilling activity. Hughes initiated the monthly international rig count ...
Please check out Scrapbook of Reviews on Benoit Mandelbrot
http://users.math.yale.edu/mandelbrot/
[...]
"Nach dem konventionellen mathematischen Modell dürfte es zwischen 1916 und 2003 nur 58-mal passiert sein, dass der Dow-Jones-Index an einem Tag mehr als 3,4 % steigt oder fällt. In Wahrheit ...
Long-Term-Investing
Time horizons: The longer, the better
Based on several well-known studies, the length of time that individual investors hold stocks, mutual funds and exchange-traded funds (ETFs) has shrunk precipitously over the past 50 years. Back then it was common for investors to have ...
Anlagezeitraum für Aktien (10 Jahre sollte die Meisten belohnen (?)
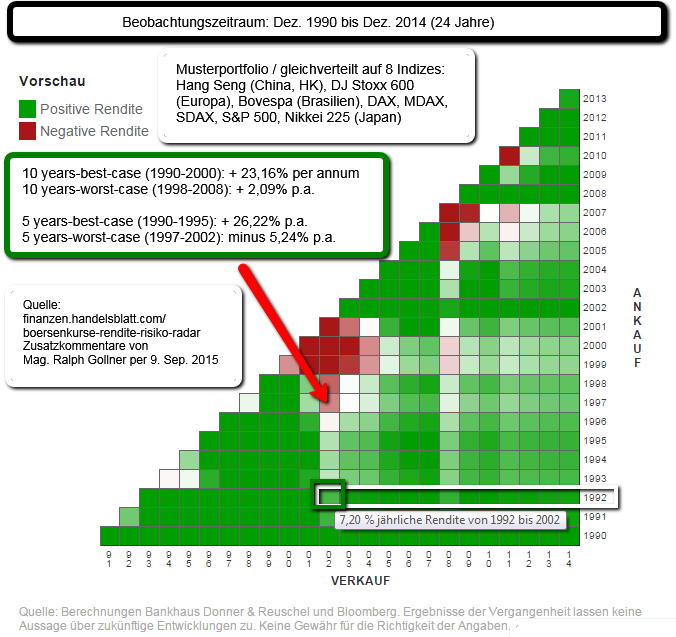
link zum Selber-nachrechnen: http://finanzen.handelsblatt.com
MSCI Indizes (Aktien p.a. 1989 bis 2014)
Die USA und Europa haben das weltweite Börsengeschehen in den vergangenen Jahrzehnten geprägt. Die Serie "Bewährte Märkte" von Fidelity International beleuchtet die Fakten dieser Märkte im Detail (Kommentare von mir leicht geändert):

Die USA und ...
Gesundheitsausgaben (in % vom BIP), Langzeithistorie

Den mit Abstand höchsten Anteil der Gesundheitsausgaben am BIP verzeichneten die USA (16,9 Prozent), gefolgt von den Niederlanden (11,8), Frankreich (11,6) und der Schweiz (11,4 Prozent). Österreich liegt mit 11,1 Prozent knapp zwei ...
S&P 500 yearly returns 1980 - 2014
US-Stock-Market-Returns (S&P 500) were positive in 27 out of the last 35 years (timespan: 1980 - 2014)! Out of these 27 years a positive return of at least 20% has been achieved in 12 years. Status of annual return overview: 25th Aug. 2015.
please check out ...

History recap of the 1st trading-week of the year 2016
For the 1st week in 2016, the S&P 500 fell 6 %, the Dow Jones Industrial Average shed 6.2 % and the Nasdaq Composite tumbled even 7.3 % (in only 5 days).

It was the worst start to a year for the S&P 500 on record. S&P 500 components, a ...
China Exports (New Year-effect, Feb. 2016)
The export crash is misleading in this case because the Jan. & Feb.-months host China’s biggest holiday, the Chinese New Year, when factories rush to meet orders before business shuts down (see yellow boxes in the last years):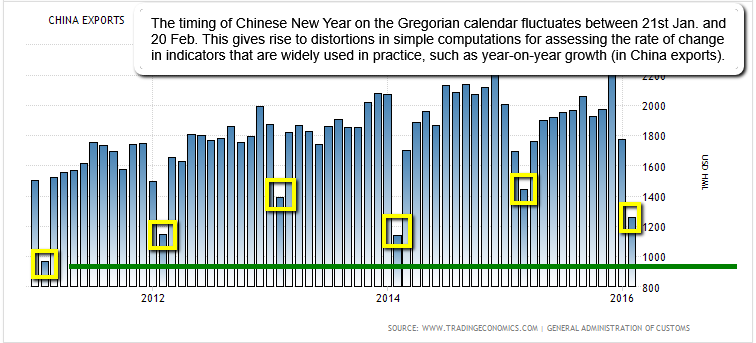
Disclaimer "upfront": ...
St. Patrick's Day (17th March 2016)
St. Patrick’s Day has a bullish history itself. DJIA, NASDAQ and Russell 2000 also exhibit solid track records of gains over the past 21 years on the thirteenth trading day of March (see StockTradersAlmanac.com).

Average gains range from 0.26% for DJIA ...
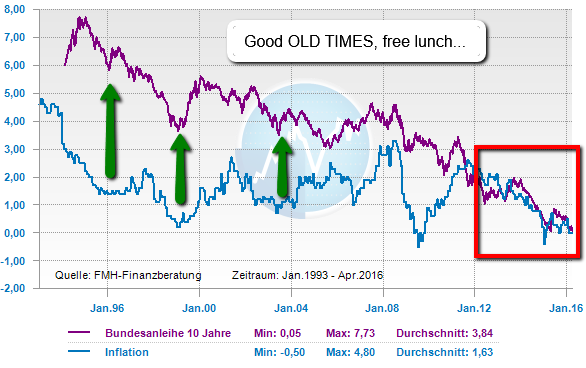
Umlaufrendite/Staatslanleihen (Historie)
1993 - 04/2016
Die Umlaufrendite deutscher Bundesanleihen ist am Montag (11. April 2016) erstmals auf 0 % gefallen. Damit erhalten Anleger, die in deutsche Anleihen investieren, im Schnitt erstmals keine Zinsen mehr. Vorab die deutsche Bundesanleihe:
...
Momentum (last 3 months)
Momentum picking up! Check out each sector-development in the big stocks-universe (> 4,900 stocks). All sectors (!!) in the green over the given period (status: 16th April 2016):
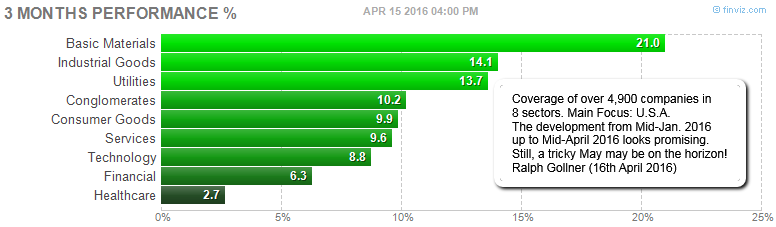
The wide US-Stock Market (S&P 500/SPX) is also gaining momentum (again), as can be seen ...
Baltic Dry Index (All-Time-Low Feb. 2016)
Der Baltic Dry ist im Feb. 2016 so tief gesunken wie noch nie zuvor (per April jedoch wieder kräftigst erholt!). Der Index bildet die Frachtkosten wichtiger Rohstoffe wie Eisenerz, Kohle und Kupfer ab.
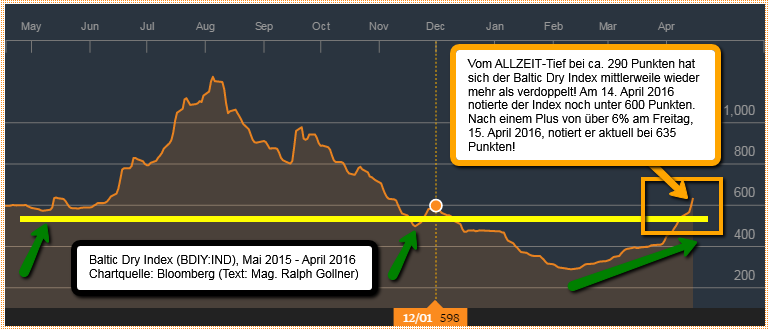
In der Regel ist die Container-Schifffahrt ...
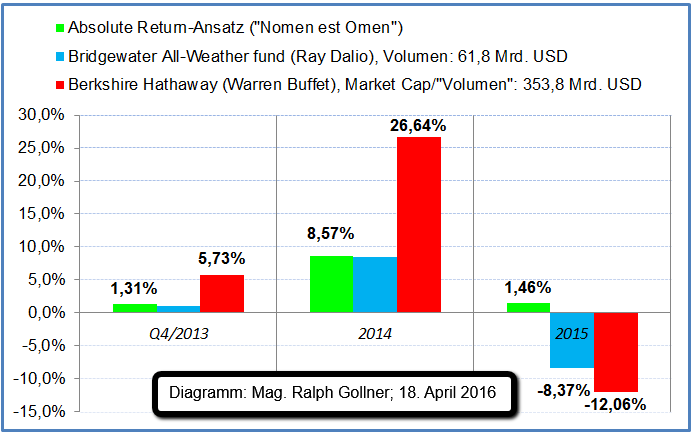
Absolute Return vs. Warren Buffet, Ray Dalio
(Q4/2013 - Dez. 2015)
Es gibt zum abgelaufenen Jahr 2015 und dem Finanzmarkt mehrere Meinungen. Einige meinen sogar, für kleine Aktienwerte, Nebenwerte und Mid-Caps war 2015 garnicht so anstrend und schwierig, wie die Mehrheit meint.
 Performance ...
Dividend-ETF (vs. S&P 500), period: 2006 - 2015
The average investor may be searching for "low-expense-fee"-ETFs in order to build his Long-Term-Portfolio. Following ETF achieved an annual performance of 13.46% in the last 5 years (10-year perf. yoy: 8.63%):
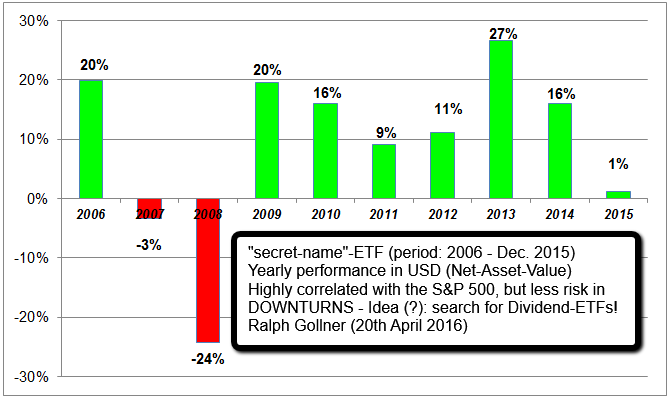
In an ETF the stock selection ...
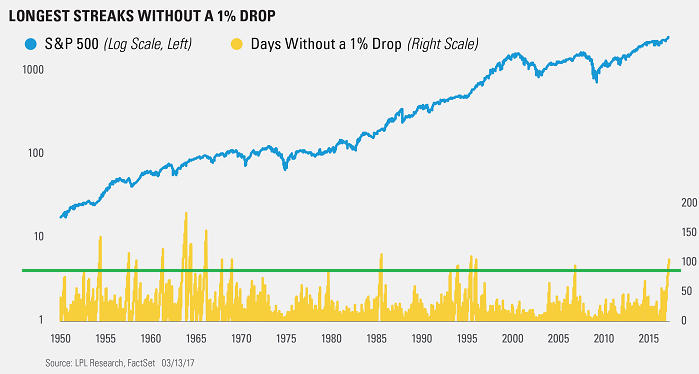
S&P 500 Streaks without a 1%-drop
Is A Lack Of Volatility A Sign Of Complacency?
The S&P 500 Index has gone 104 days in a row without a 1% close lower! In fact, the S&P 500 hasn't moved in a daily range of more than 1% for 59 days in a row, the longest such streak going back 50 years and...
...
Selected Hedge-Fund performance (year 2015)
In the following overview you can find last years' performance of selected Hedge-Fund Managers, ATTENTION: Last years' return-calculation is based on the weighted portfolio performance:
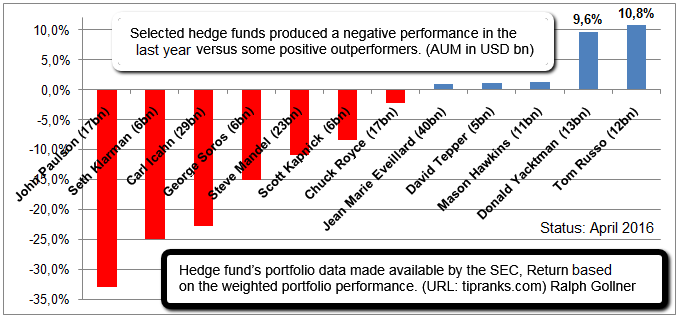
The more than a dozen (pretty well known) mentioned ...
Mittelschicht-anstieg 2016 bis 2030!
Zwischen 1990 und 2010 hat sich der weltweite Anteil der Menschen, die unterhalb der absoluten Armutsgrenze von 1,25 US-Dollar leben müssen, mehr als halbiert, von 47 auf 22 Prozent. Das entspricht einer Verminderung um 700 Millionen Menschen.
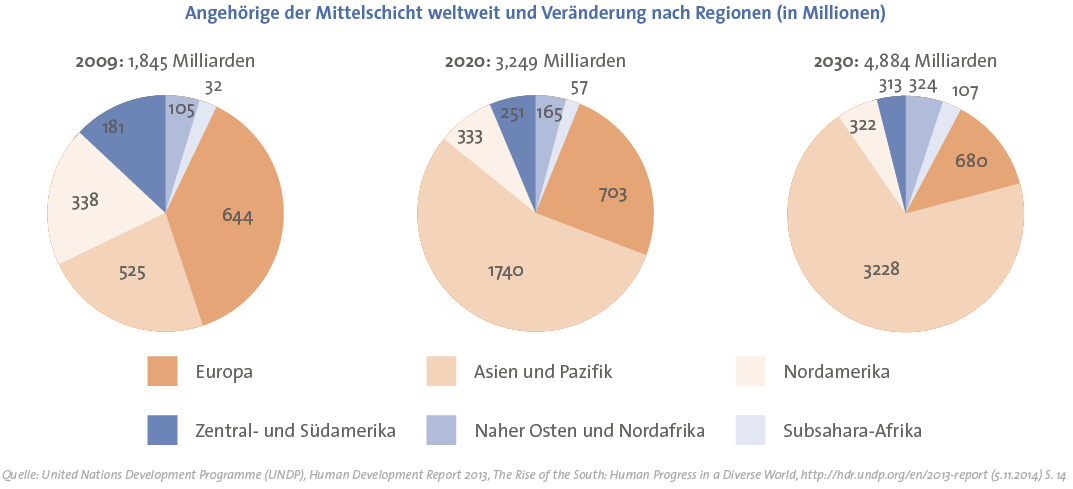
Die ...
S&P 500 "Forecast" 2016 - 2022
Do Past 10-Year Returns Forecast Future 10-Year Returns? Vanguard expands its previous research in using U.S. stock returns since 1926 to assess the predictive power of more than a dozen metrics that investors know ahead of time:
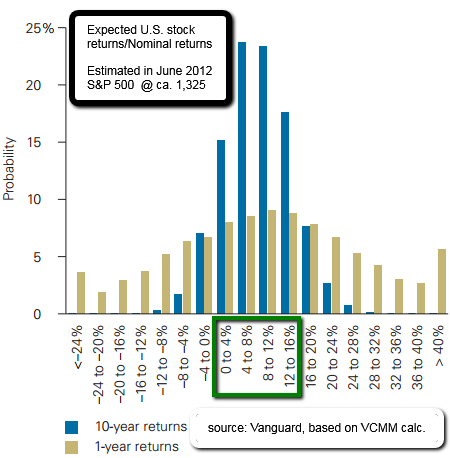
Projections are based on ...
Die fünf Vorsorgetypen in Österreich
Wie die ÖsterreicherInnen mit dem Thema „Private Pensionsvorsorge“ umgehen, wie sie sich entscheiden oder auch nicht, zeigt eine Studie der BAWAG P.S.K. (Nov. 2014).
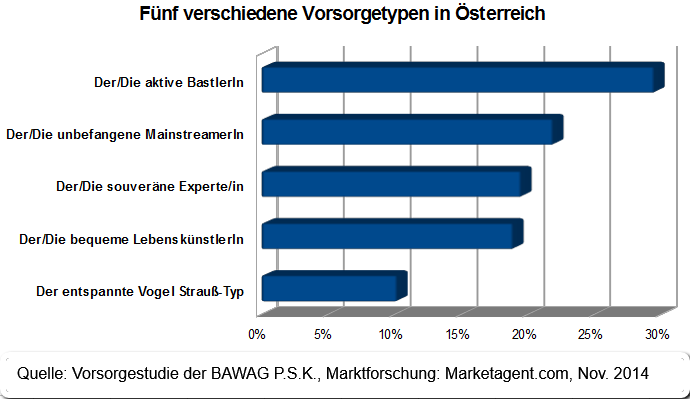
Die Befragten sind sich darüber im Klaren, dass das Thema „Private Pensionsvorsorge“ ...
Carl C. Icahn (Investor)
C. Icahn has, unequivocally, shown superior skill as an investor. Consider this: Icahn has returned 31% annualized between 1968 and 06/2015. BUT since 2014 everything got a little bit more difficult...
Still: Based on the weighted portfolio performance he achieved ...
US-population 1950-2016
The US-population is growing ever since. GDP-Growth is achieved via productivity growth, but also due to more people producing a higher output (GDP). In the U.S.A. the population more than doubled from the year 1950 until now.
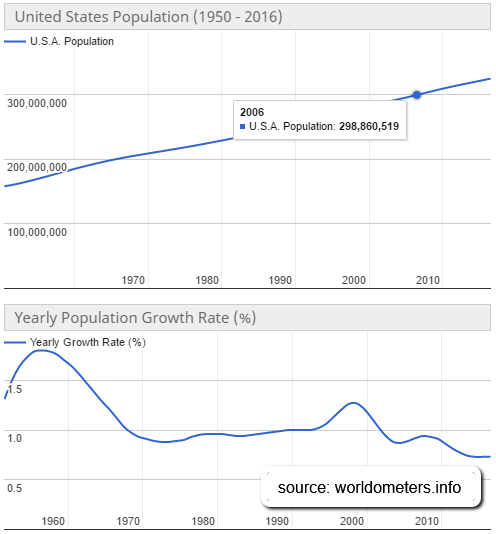 current US-population figures: ...
US-New Home Sales
New Home Sales in the United States averaged 652.45 Thousand from 1963 until 2016, reaching an all time high of 1,389 Thousand in July of 2005 and a record low of 270 Thousand in February of 2011.
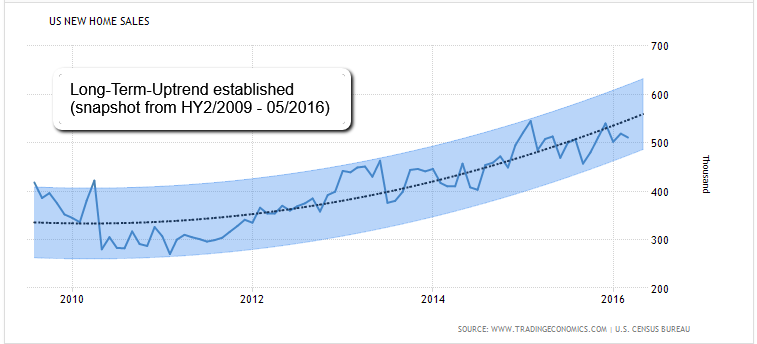
Definition: A sale of the new house occurs with the signing of a sales ...
Snapchat versus Facebook
(Status: HY1/2016)
Snapchat is coming up! Tumblr, Vine, Twitter, Pinterest, Instagram, Linkedin – Nearly no one can reach the time spent by US-users on its platform. Only Facebook-users spend more time per month on its platform: ca. 1,000 minutes.

Photo-Sharing is ...
Aktien versus DE-Umlaufrendite
Die Niedrigzinspolitik der EZB zeigt immer fatalere Auswirkungen: Die Umlaufrendite ist im April erstmals auf 0 Prozent gesunken. Das heißt: Wer dem deutschen Staat Geld leiht, bekommt im Schnitt keine Zinsen mehr. Ein Novum!
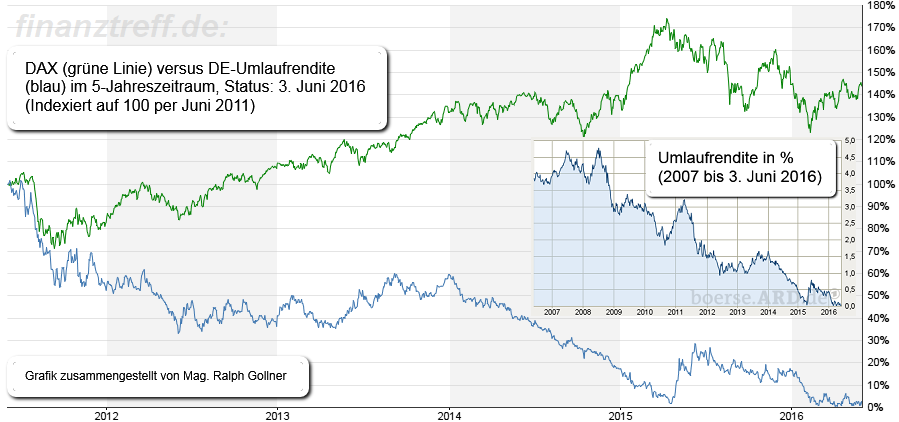
Was den deutschen ...
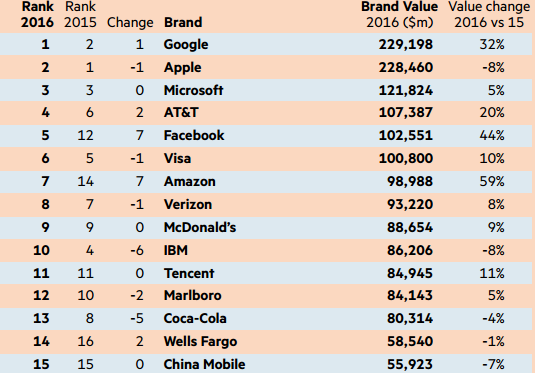
Top Brandz (2016)
The world’s 100 biggest brands still command a significant premium over others and that value increased by 3% to USD 3.4tn this year, according to the latest BrandZ rankings compiled by MillwardBrown, the research agency:
 complete list/please click here: ...
Rolling Returns 12 months & S&P 500
(July 2016 - 07/2017 - July 2018)
Writing about one-year-targets (implied returns), one should keep in mind, that the average ROLLING-RETURN for a 1 year period is 7.02%, the median for a 1 year-rolling-period in the Dow Jones Industrial average is 6.62%.
...
Indien & China (Mittelschicht-Anstieg)
China: In den kommenden (vier bis) fünf Jahren steigt der Konsum im Reich der Mitte um 50 Prozent, behauptet eine Studie. Vor allem die jungen wohlhabenden Chinesen geben demnach viel mehr Geld aus als ihre Eltern.
Folgend der eingangs erwähnten Studie ...
For the first time, America is no longer No. 1 for super-rich
The wealth of high net worth individuals (HNWI) in the Asia-Pacific grew by 10% or almost five times North America's 2% growth for "HNWI" last year, according to a Report released by Capgemini, a global consulting service.
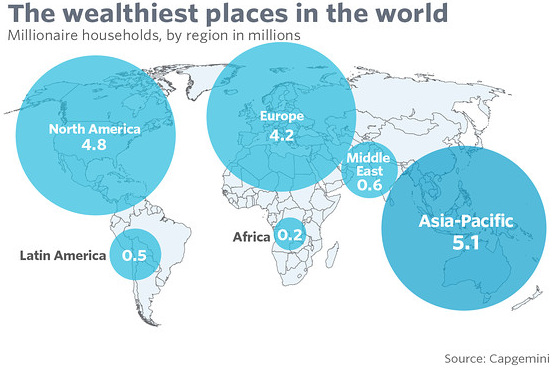
There ...
Betriebliche & überbetriebliche Pensionskassen Österreichs
Die Performance betrug in 2015 +2,36%. Der Fokus liegt (jedoch) auf langfristiger Veranlagung. Der durchschnittliche Veranlagungserfolg der österr. Pensionskassen liegt mit Ende des 3. Quartals 2016 bei +3,3%.
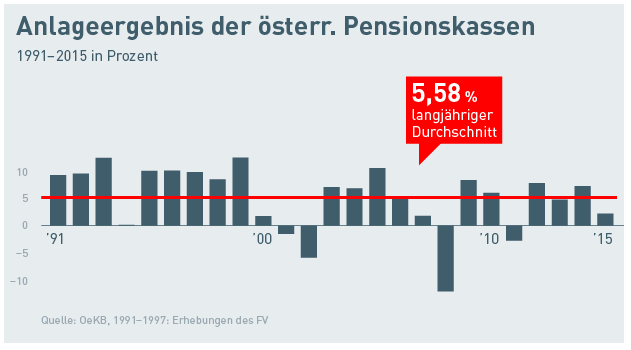
Der 1992 gegründete ...
Banking in the US / Net Interest Margin & 10YR-US-Treasuries
Net interest margin is a measure of the difference between the interest income generated by banks or other financial institutions and the amount of interest paid out to their lenders (for example, deposits), relative...
.gif)
...to the ...
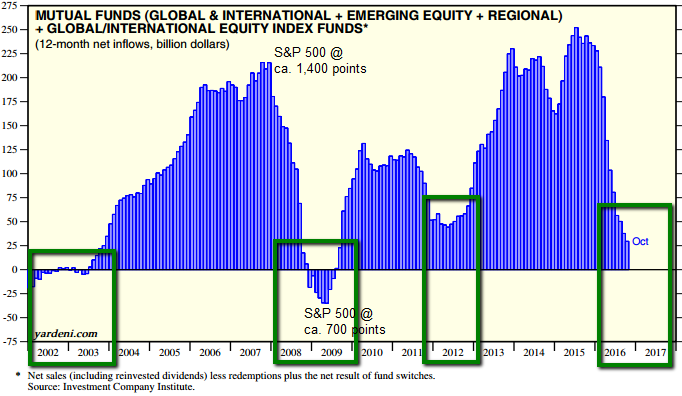
Fund Flows (Tailwind for stocks ?!)
Nov./Dec. 2016
Investors plowed money back into ETFs at a breakneck pace during the first week of December 2016. After adding USD 48 billion to U.S.-listed ETFs in November, they added USD 14.6 billion to the space in the week ending Thursday, 8th December.
 ...
...
The Majority of the World’s Population Lives in This Circle
China and India, or "Chindia" - is home to about 40 percent of the world's population. Furthermore there are now at least 3.8 billion people living inside the highlighted circle (that circle holds 22 of the world's 37 megacities):

...
Die wertvollsten Unternehmen der Welt
Die Top-Plätze im Ranking der 100 teuersten Konzerne sind weiterhin für amerikanische Firmen reserviert. Der deutsche Spitzenreiter ist SAP auf Platz 60.
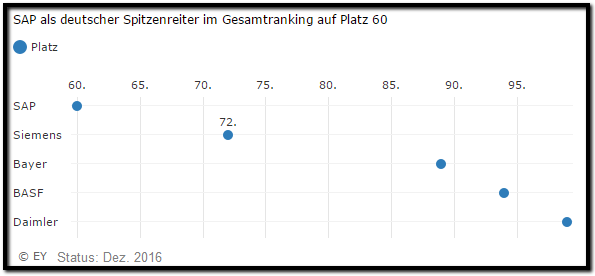
Die zehn wertvollsten Unternehmen der Welt kommen auch in diesem Jahr aus den Vereinigten Staaten. ...
The Pareto Principle
...is an economic term invented by an Italian economist Vilfredo Pareto in the 20th century. It is also called the 80-20 principle, meaning that 80% of effects come from 20% of the causes. In the book "The Tao of Warren Buffet" written...
...by Mary Buffett, one can ...
Remember the Big Bull Markets (50s, 90s)
I guess, the times to achieve great returns via Value-Investing are now much harder than in the last century...maybe, BUT: there always has to be an Equity Premium OVER Bond-yields! (my best guess)
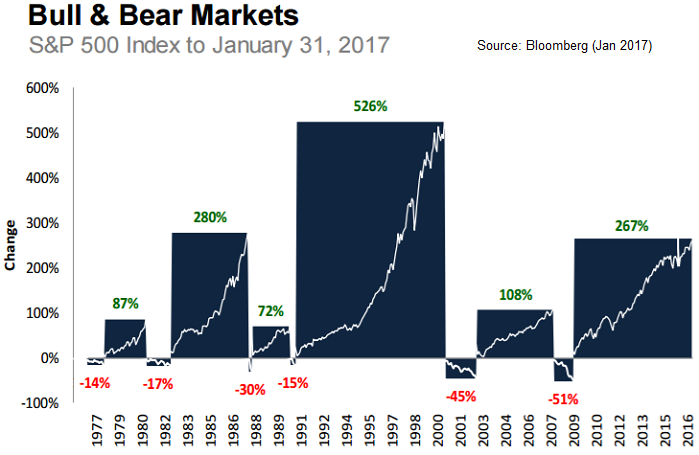
For the purposes of this illustration, a bull ...
Wenn Du (als Junge/r) Zeit/GEDULD hast...
Beim Vorsorgen gilt: Besser früh und wenig als spät und viel. Wer zeitig mit dem Sparen anfängt, muss sich weniger stark einschränken als Spätberufene:
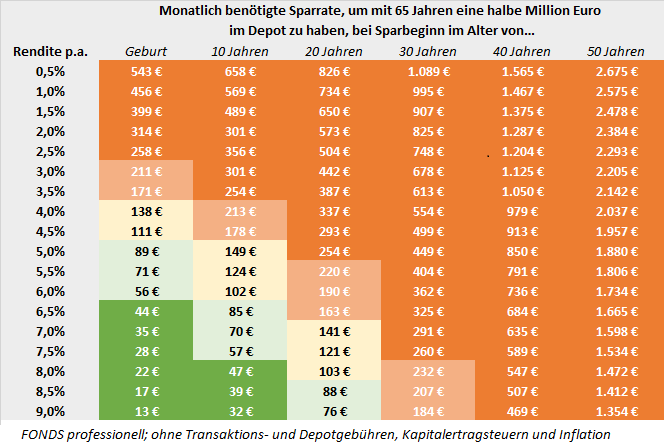
Ein plakatives Beispiel (siehe Schaubild oben):
Jemand setzt sich ein Sparziel von 500.000 Euro, ...
DAX-MATRIX
(Geburtsjahr bis Feb. 2017)
So viel Geld hättet ihr heute, wenn Eure Eltern bei Eurer Geburt in den DAX investiert hätten. Es ist ein Brauch, zur Geburt des Kindes gleich ein Sparbuch anzulegen, das ihm mit Zinsen zum 18. Geburtstag ausgezahlt wird. Noch schlauer wären...
...
DAX vs. Dow Jones Ind. Average
(Jan. 2000-Jan. 2017)
Von den 205 Monaten seit Ende 1999 wurden beim Dow Jones 122 mit Gewinn abgeschlossen. Dies entspricht einer Gewinnhäufigkeit von 59,51%. Der Dax (89 Monate im Plus) weist hingegen eine "reduzierte" Gewinnhäufigkeit von 56,6% auf.
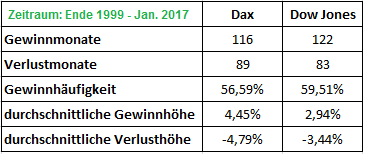
Hinzu ...
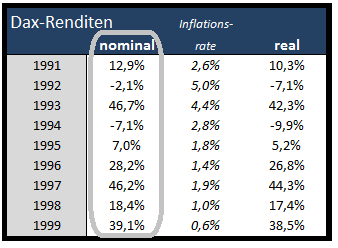
DAX-Jahresrenditen (1991 - 2012)
2013-2016 bitte selber nachschlagen ;-)
Seit 1950 hat die langfristige reale Rendite des deutschen Aktienmarktes relativ konstant zwischen 5% und 9,5% p.a. betragen. Insofern sind 6% p.a. real bzw. 8% p.a. nominal gute Erwartungswerte für eine...
...
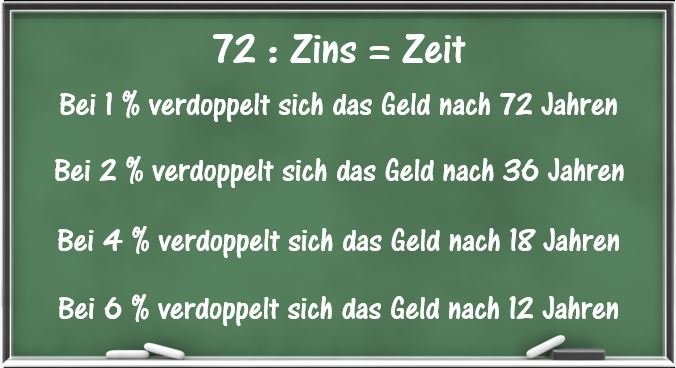
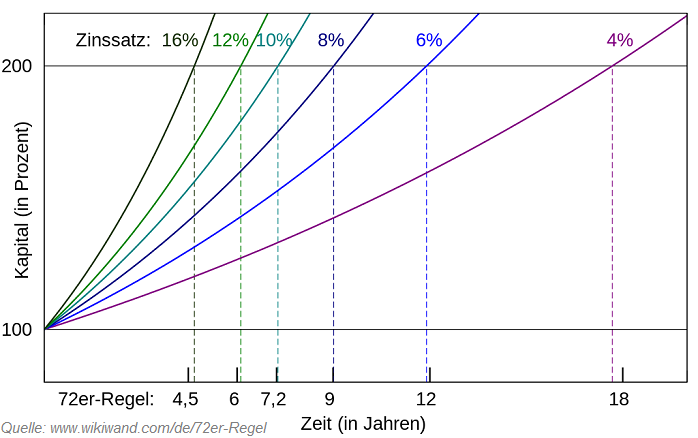
72er-Regel (Verdoppelung)
144er-Regel (Vervierfachung)
Kleines Quiz: Wie lange müssen Sie Ihr Geld in Aktien anlegen, bis es sich bei einem durchschnittlichen Zinssatz (bei einer Rendite) von sechs Prozent pro Jahr verdoppeln wird? Die richtige Antwort liegt bei 11,9 Jahren. Eine...
...
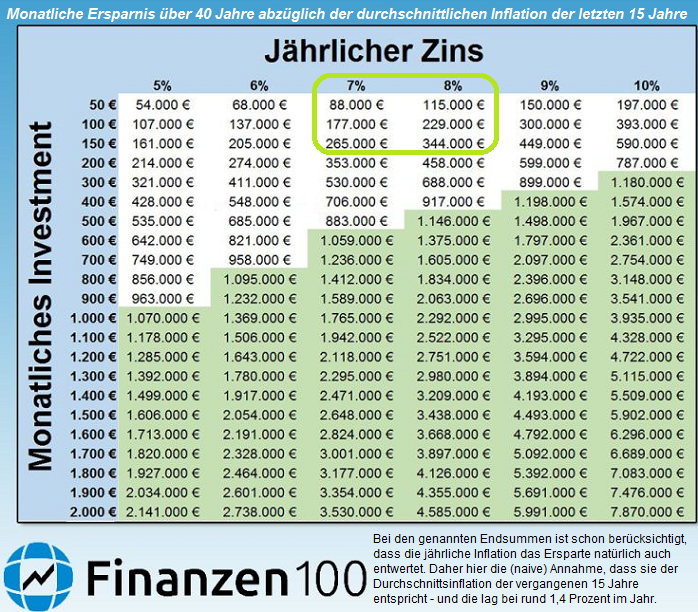
40 Jahre sparen
(nur 50 Euro pro Monat)
Zinseszinsen sind der größte Freund eines jeden Sparers und Anlegers. Über 40 Jahre kommen dabei erquickliche Summen zu Stande - selbst wenn man nur wenig Geld zurücklegen kann. Bei den genannten Endsummen ist schon berücksichtigt, dass die...
... ...
Economic Confidence Model
Martin A. Armstrong, a former chairman of Princeton Economics International Ltd, developed The Economic Confidence Model. He proposes that that economic waves occur every 8.6 years, or 3,141 days, which is Pi X 1,000. At the end of each cycle is a crisis...
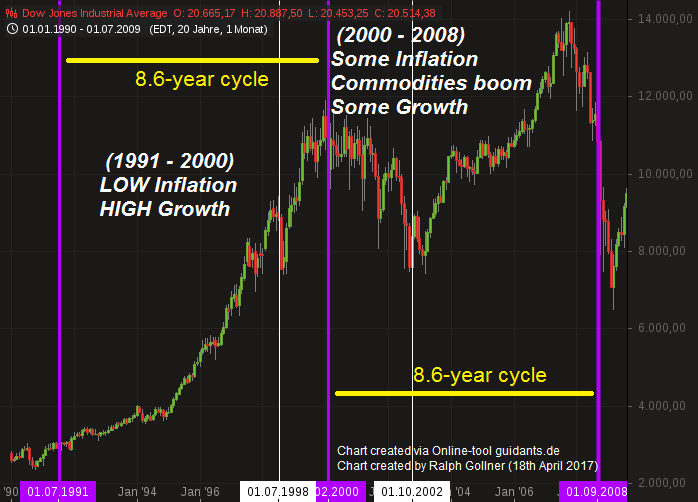
...
Bullenmärkte seit 1926 (inkl. "Bärenmärkte")
"kurz und schmerzvoll"
Wie lange kann ein Bullenmarkt "laufen"? Sehen wir uns eine Analyse des US-Vermögensverwalters First Trust an. Sie untersucht die Auf- und Abschwungphasen - im Börsendeutsch: Bullen- und Bärenmärkte - an der Wall Street...
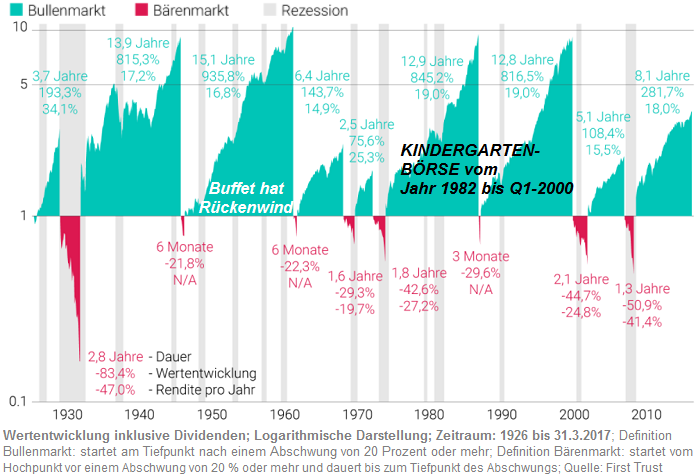
...
US Stockowners fearful (not greedy)
?
In the year 2016, according to a poll of over 1,000 American adults, even with the Dow Jones industrial average near its record high, only slightly more than half of Americans (52%) say they currently have money in the stock market,...
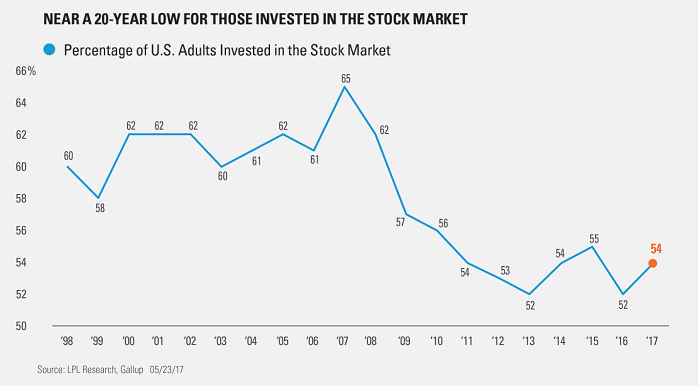
...matching the ...
US stock market returns don't look that extreme relative to history
Stock market returns are not as extreme as some might suggest. Following chart contrasts the current five-year return of the S&P 500 with the historical distribution of five-year returns.
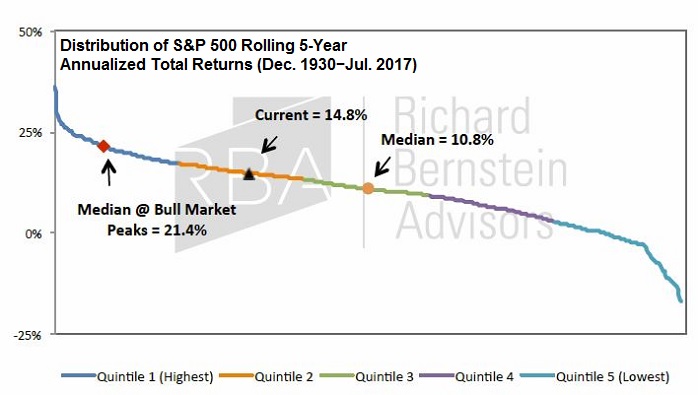
Of course, the recent experience ...
Tagesgeld und Inflation
Status: 15.07.2017
In den letzten 20 Jahren war über diese ganze Zeit noch nie der Abstand von Inflation zu Tagesgeldzins so hoch wie in den letzten Monaten. Weiteres Ansteigen der Inflation ist nicht ausgeschlossen,...
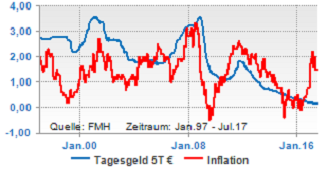
...aber ein baldiges Anziehen der ...
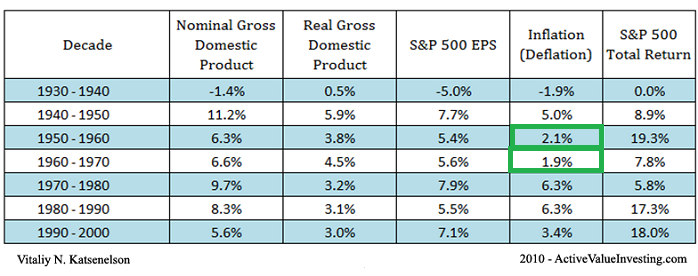
Stock Market Returns (Decades)
Although it is hard to observe in the everyday noise of the stock market, in the long run stock prices are driven by two factors: earnings growth (or decline) and/or price-to-earnings expansion (or contraction). ANNUAL StockMarket-Returns from 1930 until 2000:
 ...
...
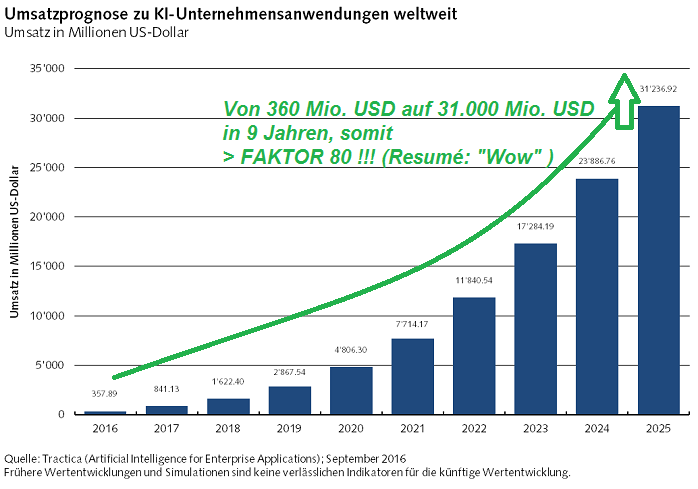
Künstliche Intelligenz
(Mögliches Potenzial 2017 bis 2025)
Hinter dem Begriff Künstliche Intelligenz (KI) verbirgt sich die Fähigkeit von Computern, menschliche Tätigkeiten zu übernehmen, meist jedoch schneller, präziser oder auch günstiger als ihre Vorbilder. Die technologischen...
...
Network effects
It's one of the most important concepts for business in general and especially for tech businesses, as it’s the key dynamic behind many successful software-based companies. Understanding network effects not only helps build better products, but...
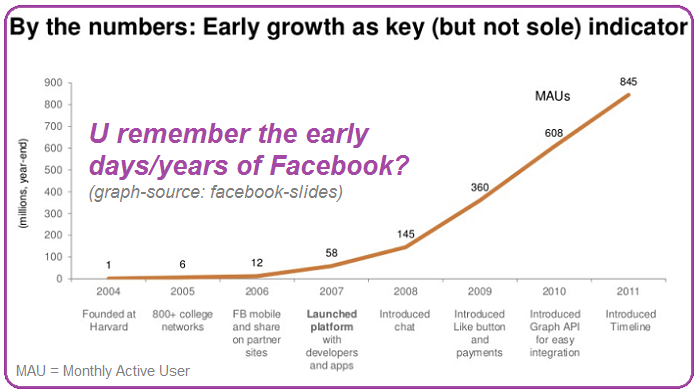
...it helps build moats and ...
The World's Wealthiest Cities
Following Snapshot gives you a selection of the "Top 15 Cities", the "15", which in total globally hold USD 24 trillion in Wealth. >> That's about 11% of the world's total private wealth. Why the focus on Asia here? Well, let's recheck the future...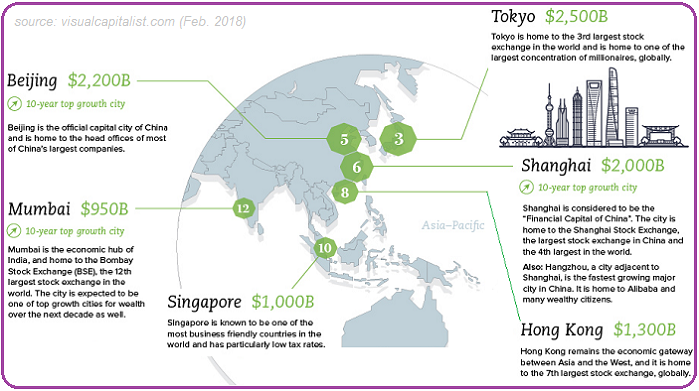
This extract ...
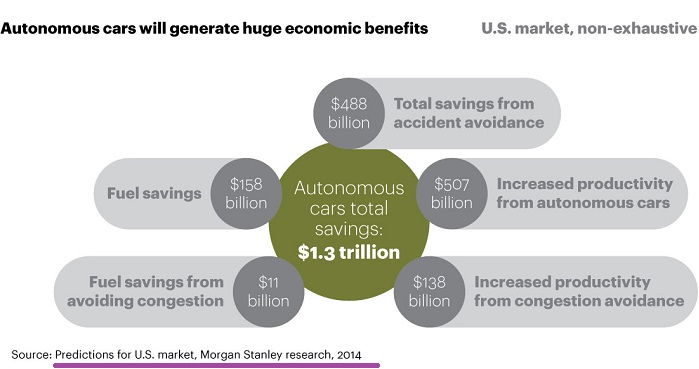
Autonomous Driving
(Status: year 2017)
The societal benefits of autonomous driving; Imagine a world with fewer accidents, fewer traffic deaths, greater energy efficiency, and lower insurance premiums. This is the world of autonomous driving. It brings mobility to people who lack easy...
...
Inflationszahlen Österreich
(1900 bis Dez. 2016)
Österreich und (s)ein verstörendes 1. halbes Jahrhundert (1900 bis 1950); (Nicht nur) aus Finanzmarktsicht schaut der Zeitraum 1900 bis 1950 in Österreich verherrend aus...Was dies mit dem Vertrauen der Bevökerung und von Investoren...
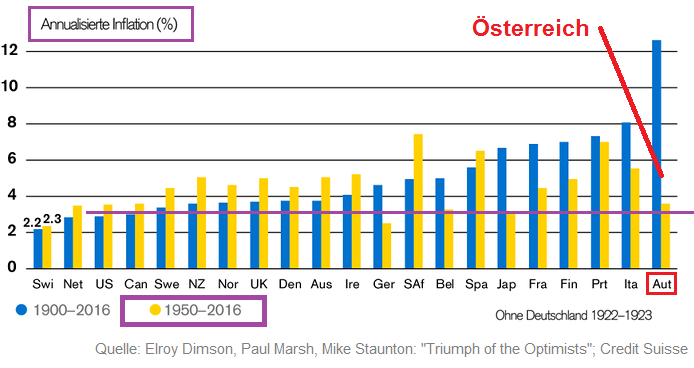
...
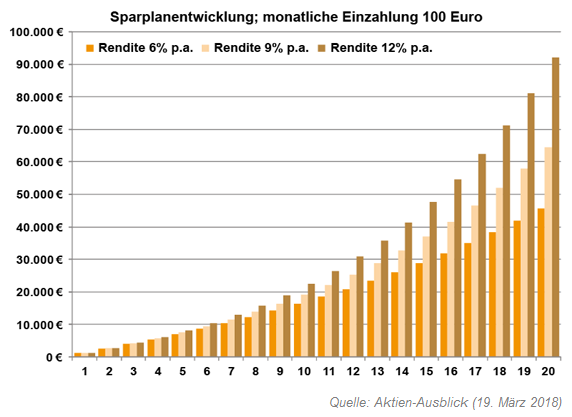
Investieren über Sparpläne (?)
Selbst mit kleinen finanziellen Schritten kann ein grösserer Betrag angespart werden. Das geht theoretisch/zum Beispiel mit Sparplänen. Außerdem spielt man hier den Zinseszinseffekt für sich aus. Schauen wir uns folgende Beispiele an: Aus monatlichen...
...
Die 72er-Regel
(Der Zinseszinseffekt)
Die 72er-Regel ist eine Faustformel aus der Zinsrechnung. Die Regel gibt näherungsweise an, nach wie vielen Jahren sich eine verzinsliche Kapitalanlage im Nennwert verdoppelt (siehe folgende Grafik). Dazu teilt man 72 durch die Prozentzahl des...
...
Understand the exponential function!
University of Colorado Professor Albert Bartlett was widely viewed as a pioneer on explaining the arithmetic involved in the world's population, energy, and sustainability issues.

Fundamentally, linear functions are just addition. Unfortunately, this is ...
Zinseszins
(Wake-Up Call)
Eine klare Botschaft: Je länger wir sparen und dabei regelmässig Zinsen erhalten, umso stärker wächst das Vermögen an. Und je höher die Verzinsung ausfällt, desto kräftiger fallen die Vermögenszuwächse pro Jahr aus. Nimmt man an, dass...
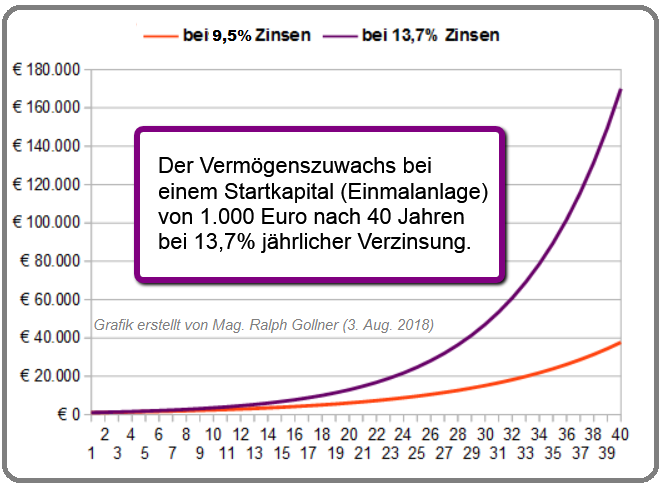
...man 1.000 Euro 40 Jahre ...
Very scary months for the "new investor"
According to history, the dangerous zone from a time-perspective might me the period starting from July until October; Please recheck for yourself: 15 out of the 20 (75%) biggest one-day Crashes occured during that period:
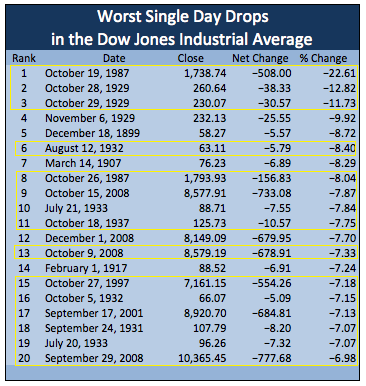
Let us rethink this ...
Globale Mittelschicht
(Status im Jahr: 2017)
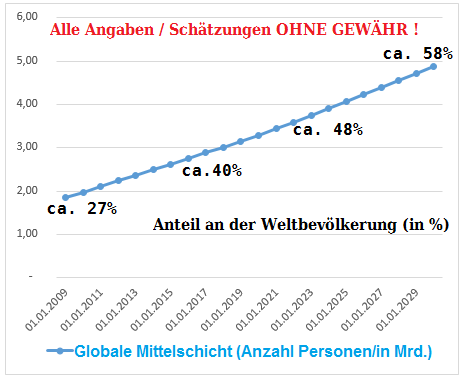
Eine atemberaubende Entwicklung ist im Gange. Ungefähr 140 Millionen Personen stossen jedes Jahr zur globalen Mittelschicht hinzu. Dieser Anstieg könnte sich in den nächsten 5 Jahren sogar noch erhöhen: auf 170 Millionen Menschen jährlich. ...
"Singles Day"
(Nov. 2018)
Alibaba. Was für Amazon der Black Friday ist, ist für den nicht weniger findigen chinesischen Rivalen der "Singles Day". Der Event fand - wie immer - am 11. November statt und entpuppte sich für Alibaba auch dieses Jahr wieder als...
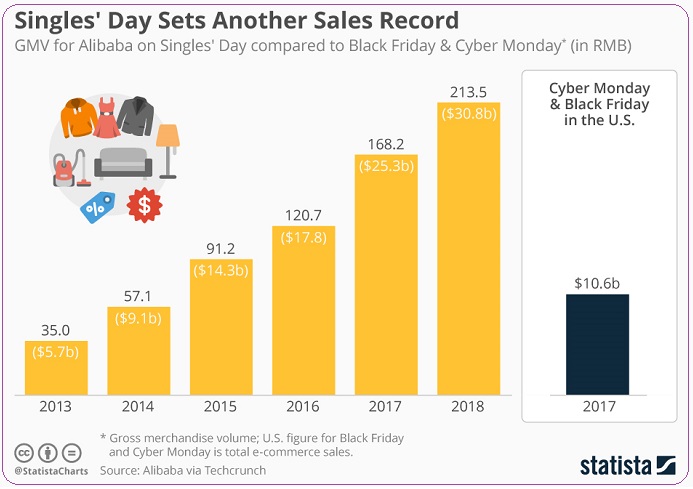
...Gelddruckmaschine. Wie das ...
(Nicht nur) Für den Durchschnittsanleger gilt:
ein langer Anlagehorizont ist -wohl- entscheidend
Für einen langfristig erfolgreichen und nachhaltigen Vermögensaufbau führt wohl an einer Investition in die Aktienmärkte kaum...
...ein Weg vorbei. Immerhin können Anleger auf lange Sicht mit ...
Kindergartenbörse 1982 bis 1999 (vs. post-2k)
Ziel einer jeden aktiven Aktienstrategie sollte es sein, im Vergleich zu konventionellen Aktienindizes ein deutlich höheres
Rendite-Risiko-Verhältnis anzustreben; Denn: Der Preis für die Rendite ist das Risiko
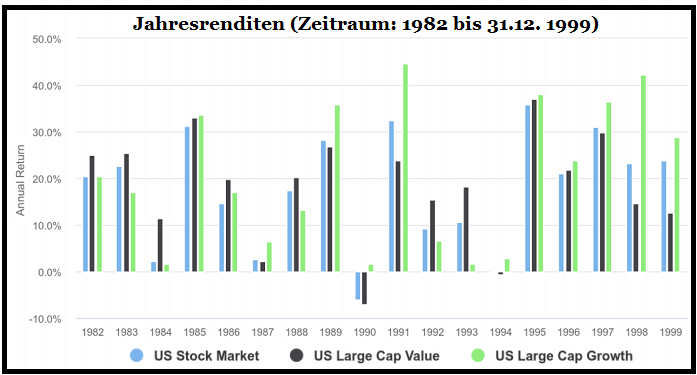
Jeder Rendite steht ein Risiko ...
Fibonacci & Warren Buffet (age 14 - 83)
Below the Fibo-Formula the normal wealth effect is displayed through the lifetime of Warren Buffet (started with the age of 14 until the "current" age of 83) if applied via consistent Fibonacci-series. Mr. Buffet was one of the few who managed to...

...
Life of PHI
Fibonacci everywhere.
Goldener Schnitt der Schönheit
Bei der Frage nach der Attraktivität greift die moderne Wissenschaft zum Maßband. Laut dem Schönheitschirurgen Stephen Marquardt lassen sich (auch) die Proportionen eines gut aussehenden...

...Gesichts nach dem Maß des ...
RECHECKING
"Quantitative Momentum: A Practitioner's Guide to Building a Momentum-Based..."
(Authors: Wesley R. Gray, Jack R. Vogel)
Quarter-ending months generally have the highest returns when comparing low and high momentum portfolios. Once momentum-profits are...
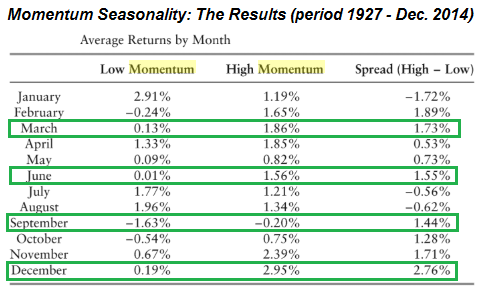
...the largest in ...
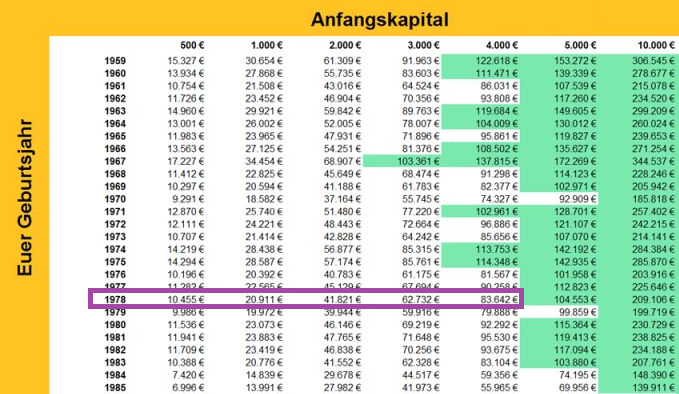
1928 - Nov. 2019 (nearly +10% p.a.)
Interesting insight into the annual returns/decades from the year 1928 onwards:
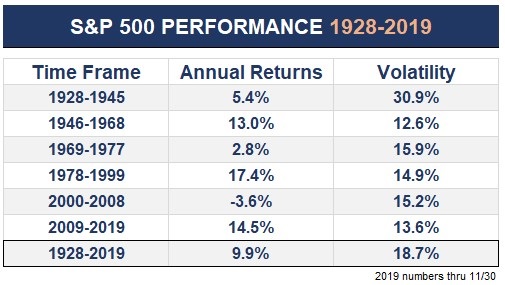
>> fascinating. Please take a look at the easy period 1978 (my birthyear) until 1999!
The Power of Compounding
The Magic of starting early and INVESTING LESS!
At the beginning of the 21st century most young people are told that social security won't be there for them when they retire from the work force. Thus, in order to be able to completely retire from the...
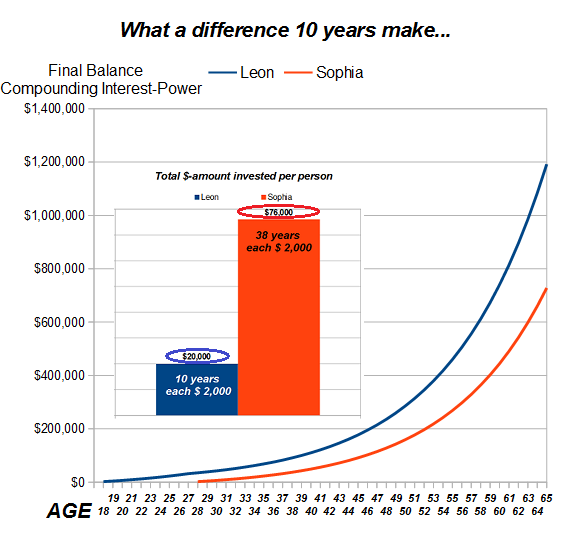
...workforce, ...


