Related Categories
Related Articles
Articles
NIPA-Profits (S&P 500-PE-Ratio/"NIPA"/Jeremy Siegel)
Professor Siegel substitutes NIPA data for S&P earnings and produces a metric with higher explanatory power, suggesting that stocks may not be as expensive as previously assumed.
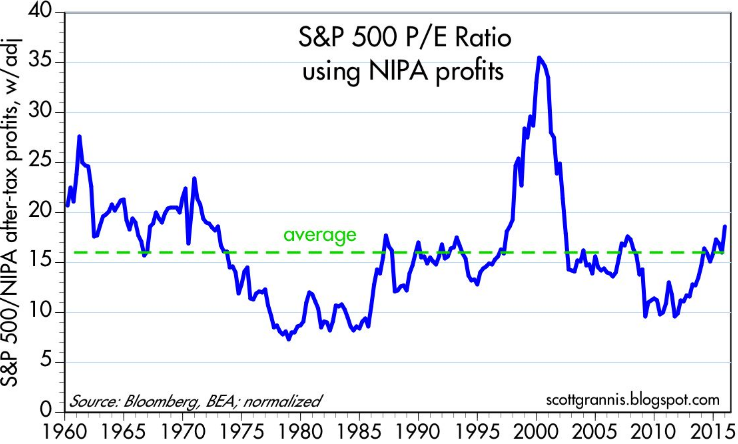
The chart above calculates the PE ratio of the S&P 500 using corporate profits as calculated in the GDP stats as the "E", and normalizing the result to match the average of the conventional PE ratio. (It also assumes that the S&P 500 index is a decent proxy for the price of all corporate equities, which is quite defensible.) This arguably has several advantages relative to the conventional method of calculating PE ratios. Instead of using 12-month trailing earnings as in a conventional analysis, this method uses the annualized profits of the most recent quarter, thus giving us a more contemporaneous measure of multiples. Furthermore, NIPA profits are based on actual profits as reported to the IRS, which are quite unlikely to be overstated or otherwise distorted by accounting methods, or by equity buybacks. This calculation-method gives us a similar conclusion than the standard PE-calculations made with GAAP-earnings: PE ratios are somewhat higher today than their long-term average. In recent years this method has yielded PE ratios that were below average. Clearly, equities are no longer "cheap," but neither are they grossly overvalued (Status as per March 2016).
In a paper in the Financial Analysts Journal, Jeremy J. Siegel, a finance professor at the Wharton School of the University of Pennsylvania, presents interesting data that might challenge the validation market bears see in the elevated Shiller CAPE. In "The Shiller CAPE Ratio: A New Look" (see link/.pdf - link at the end of the posting), Siegel points out that forecasts of future equity returns using the CAPE ratio may be too pessimistic given changes in the computation of earnings under Generally Accepted Accounting Principles (GAAP).
! The rise of "mark-to-market" accounting, asset writedowns, and the belief that accounting standards have become more conservative in a post-Sarbanes Oxley world could be putting downward pressure on the earnings used in the CAPE ratio!
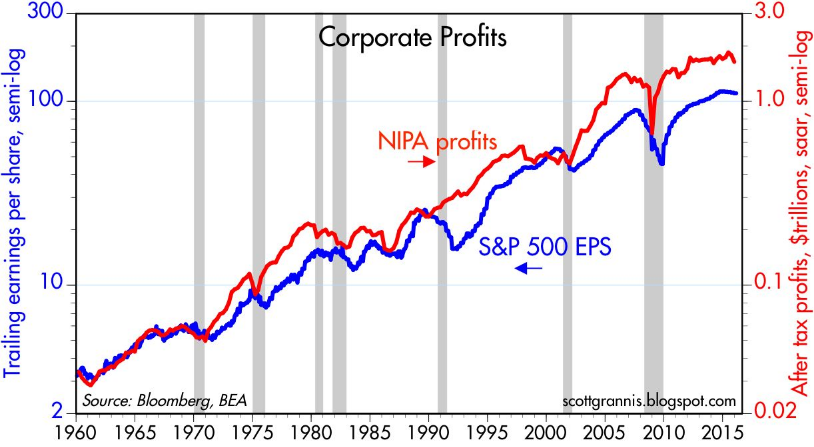
Siegel uses consistent earnings data from the after-tax corporate profits in the National Income and Product Accounts (NIPA) compiled by the Bureau of Economic Analysis of the Department of Commerce. Accurate evaluation of the validity of the CAPE model valuation signal requires that the reported earnings series is consistent across time. The NIPA data provides that consistency, and with data back to 1928, has a long enough history to test through multiple business cycles.
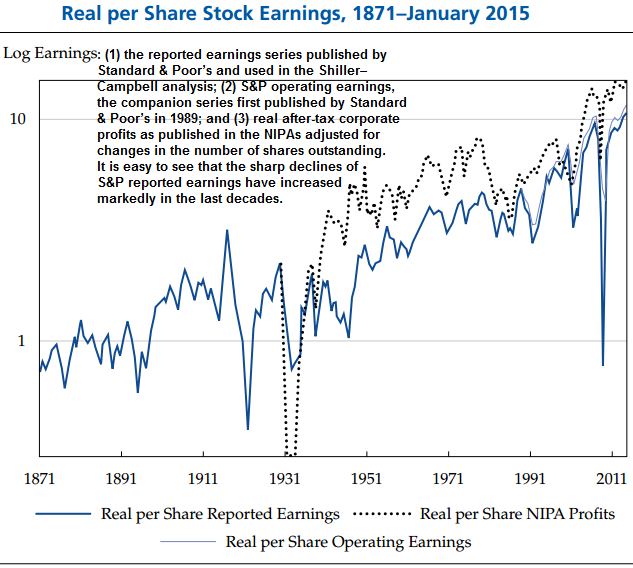
When the NIPA data was substituted for the S&P earnings data, the forecasts of US equity returns increased meaningfully and the explanatory power of the CAPE model was further improved. For market bulls, this change did not make stocks cheap to historical levels, only less expensive. Using January 2015 as his measuring point, the overvaluation of the equity market drops from 54.6% to 18.8% when NIPA profits are substituted. Using a total return series of CAPE, which seeks to neutralize the impact of the shift towards accretive share buybacks versus the higher dividend yields of past periods, and the overvaluation of the market drops from 40% to 7.1% using NIPA profits.
Substituting NIPA profits leads to lower multiples and higher expected forward returns. How much higher? The January 2015-January 2025 real returns forecasted by CAPE were just 2.2% per annum, but more than double that figure (4.41%) using NIPA profits. Forward returns would still be below the 6.7% long-term average real return on equities, but perhaps not as dire of an outcome as signaled by the CAPE method.
The Siegel analysis offers an insightful take on a well-documented market valuation tool, and details an important methodological shortcoming - time-varying accounting earnings - that should be taken into account when basing opinions of market valuation of the Shiller P/E!
Bonus/A chart on "Financial Earnings" versus "REAL WORLD-EARNINGS" from 1960 up to 2016: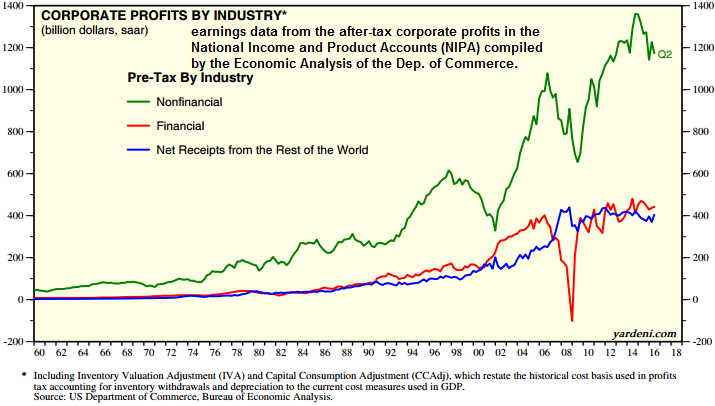
LINKS:
http://seekingalpha.com/article/challenge-shiller-p-e
7%-growth path ("past" ?) http://blog.yardeni.com/2015/06/the-trend-in-profits-excerpt
http://scottgrannis.blogspot.co.at/2016/03
http://scottgrannis.blogspot.co.at/2013/08/equity-valuation
.pdf Jeremy Siegel www.cfapubs.org/doi/pdf
profits, profits, NIPA-profits "yardeni" (Long-Term, etc.) www.yardeni.com/pub/ppphb.pdf


