Related Categories
Articles
Bitcoin (Magic, if Daily CLOSE > 45k $)
Let's see, if Bitcoin can close this week above 45,555 $. If BTC can also manage a 3Day-Close above 45,555 $ by tomorrow, Monday, that could mark a real bullish Signal - in my view:
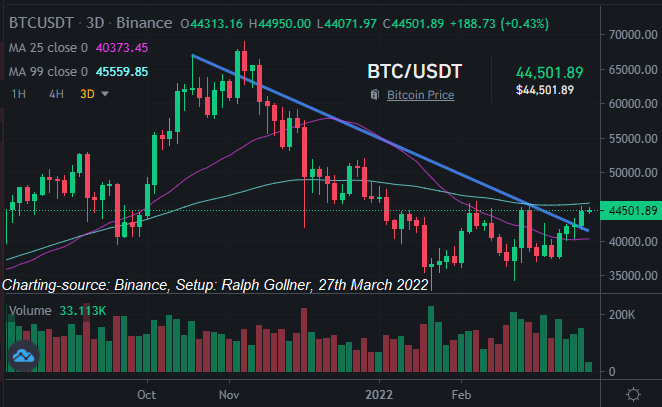
For the moment the BITCOIN-chart- above looks very interesting. By Monday, 28th March 2022, around EODay we will eventually know, if the 3Day-Candle is closing on a bullish tone :-)
NO FINANCIAL ADVICE
Disclosure upfront:
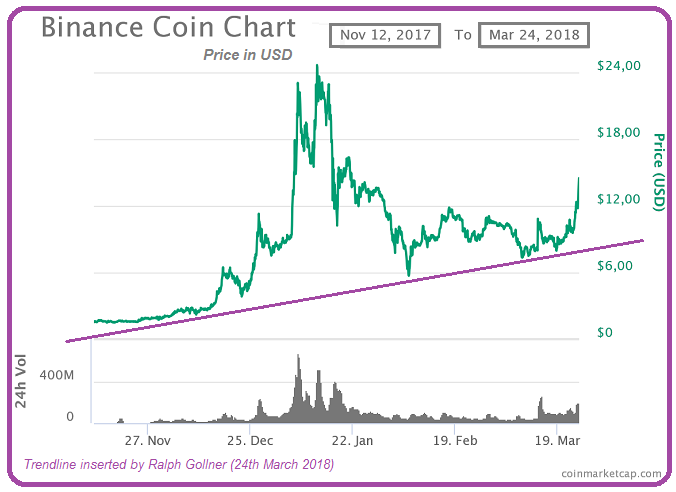
I am a "Binance-Believer" since the year 2018, when I made my first transaction on that Crypto-Platform.
Well, what I really wanted to say: "The current Binance-Chart looks juicy to me"
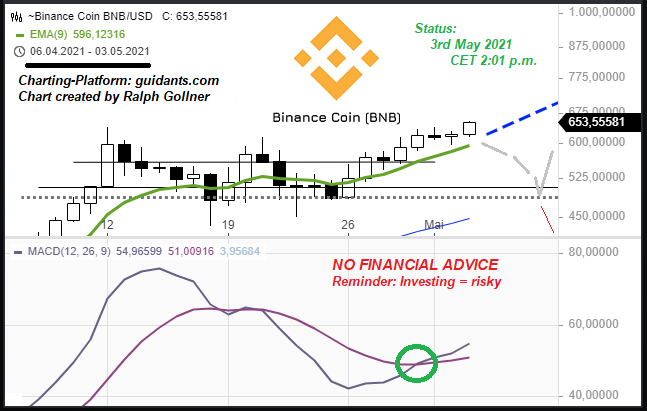
But please do your own Research first!
cheers Ralph
Disclaimer/Disclosure: Ralph Gollner hereby discloses that he directly owns digital assets/Crypto-currencies like Binance coin (BNB), Bitcoin (BTC), Ethereum (ETH) and other as per 3rd May 2021.
Disclaimer/Hinweis nach §34 WPHG zur Begründung möglicher Interessenkonflikte:
Binance coin (BNB), Bitcoin (BTC), Ethereum (ETH), und ...
Bitcoin 4h-Chart (Pot. Inverse SKS)
NO FINANCIAL ADVICE, but please check the following chart! In German: Eine potentielle INVERSE Schulter-Kopf-Schulter Formation. AKA: "Inverse SKS"; Wirkt aktuell recht bullish:
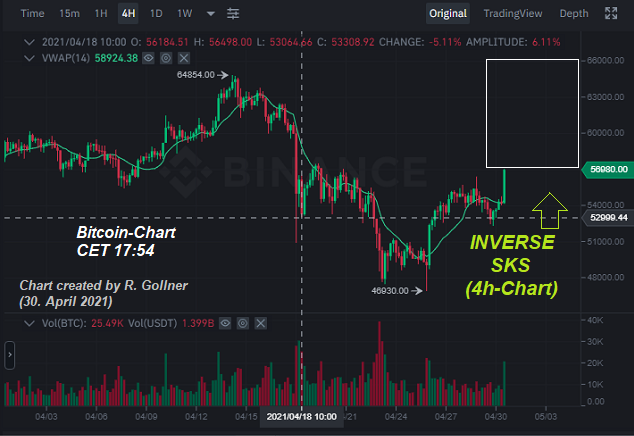
Stay tuned ;-)
cheers Ralph
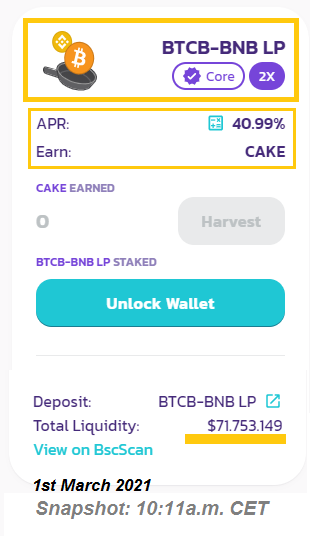
PancaceSwap (CAKE) near 40$
Upfront Info: I am a Hodler in PancakeSwap (CAKE), even when CAKE fell down into the high single digits-area back in March 2021. As long as CAKE stays above 30$ I guess, I will keep on "HODLING". Please also check the nice comparison...
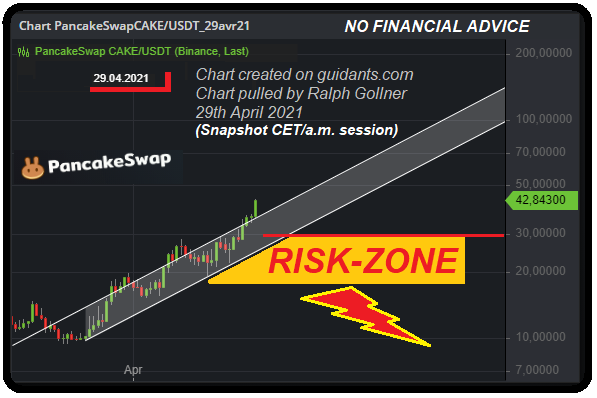
...between the Total Value Locked and the price of CAKE during the last 3 months in following graph:
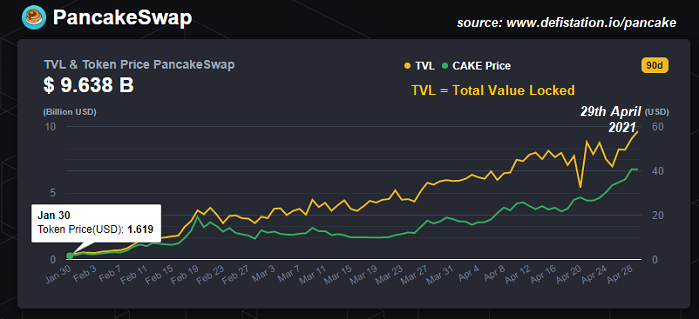
DeFi (Dezentralized Finance) and PancakeSwap still look very hot to me, especially PancaceSwap since they managed to upgrade their Platform to Version2 during the last weekend!
But of course ...
PancakeSwap (DeFi)
new All-Time-High
Dear Readers. I am loving DeFi. It might be a risky space but it has some academic incentives to dive deep into the rabbit hole! And so far it really paid off (4me). PancakeSwap is hitting a new All-Time-High today. "CAKE"...
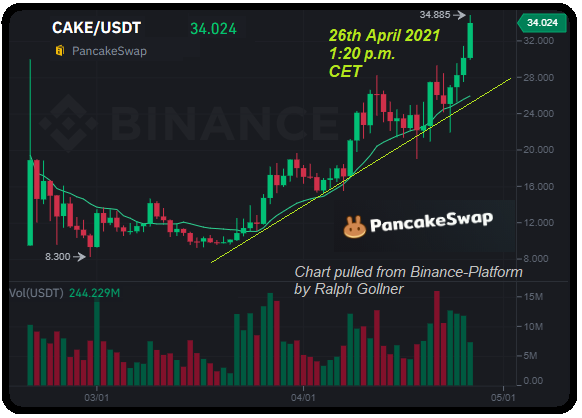
...ist the governance token of the DeFi Exchange PancakeSwap.
On the 1st March 2021 I already made a posting about how one can handle that DEX (DEX = Decentralized Exchange). You can find that posting under posting #1352 (Dated: 1st March 2021) >> www.private-investment.at/posts/view/1352
Back in those times (ca. 2 months ...
Venus Protocol (short "Venus")
Crypto-Token
Venus Protocol (short "Venus") is an algorithmic-based money market system designed to bring a complete decentralized finance-based lending and credit system onto Binance Smart Chain. Venus...
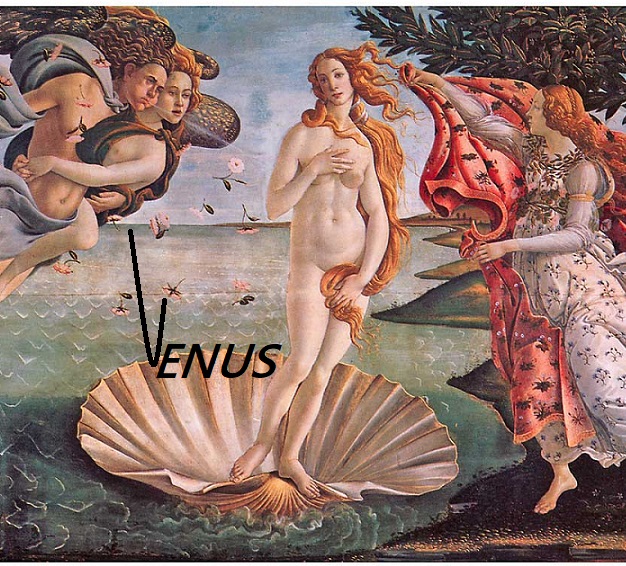
Bildquelle: https://dananda.de/product/venus-von-milo
...enables users to utilize their cryptocurrencies by supplying collateral to the network that may be borrowed by pledging over-collateralized cryptocurrencies. This creates a secure lending environment where the lender receives a compounded interest rate annually (APY) paid per block, while the ...
DeFi (Dezentralized Finance :-)
Love it or Hate it
( I AM LOVING IT )
Money and finance have been around in one form or the other since the dawn of human civilization. Crypto is just the latest digital avatar. In upcoming years, we might see every financial service that we use...
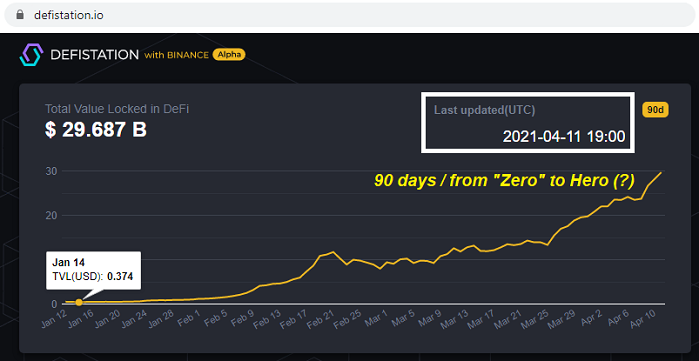 Chart: Total Value Locked (TVL) in Projects running on the Binance Smart Chain (BSC)
...in today's fiat system being rebuilt for the crypto ecosystem. We’ve already seen asset issuance and exchange, borrowing, lending, custody, and derivatives built for crypto.
What's next?
The first generation of DeFi dapps ...
Mirror Protocol
The new way of Purchasing Tokenized Assets (Stocks, Cryptos, etc.)?
What are Mirrored Assets? (short Definition on Coingecko.com) >> MIR is the governance token of Mirror Protocol, a synthetic assets protocol built by Terraform Labs (TFL) on...
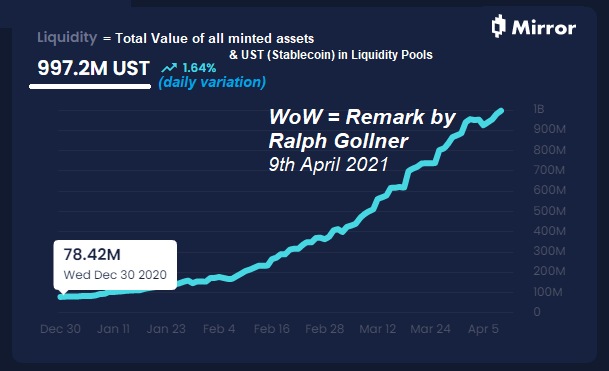
...the Terra blockchain.
Mirror Protocol is decentralized from day 1,
...with the on-chain treasury and code changes governed by holders of the MIR token. TFL has no intention of keeping or selling MIR tokens, and there are no admin keys or special access privileges granted. The intent for this is to be a completely ...
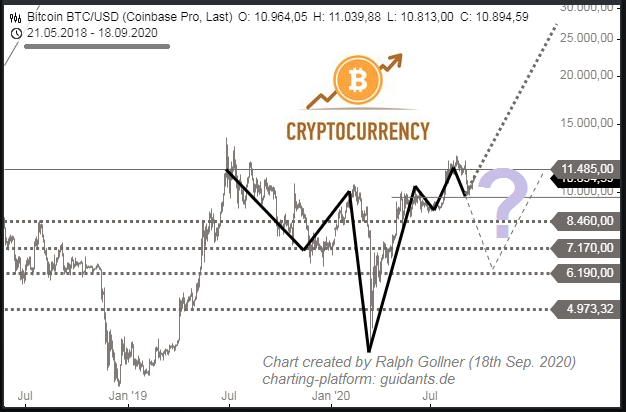
Bitcoin-path until July 2021 (?)
Status now: 24th March 2021
Dear visitors! Bitcoin had a fantastic run since the beginning of the year. The cryptocurrency received some boosts by Elon Musk himself over the last weeks and months. Tesla now own Bitcoins! To get some idea about...
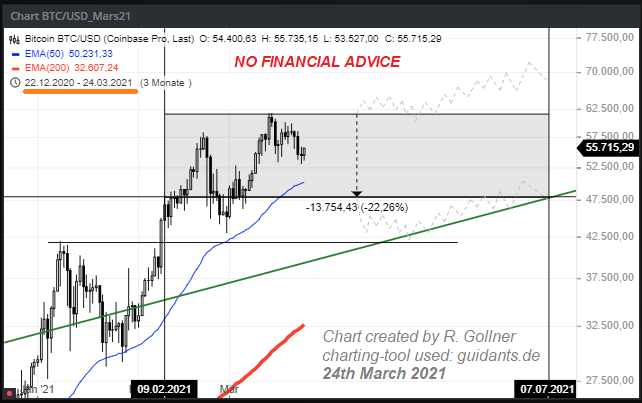
...how this journey will go on on to which planets this travel my lead (moon, or even Mars?) I wanted to take a look at the bigger picture and also in a more medium-term manner. As you can see in my chart above I am keen on looking at the price-chart from two perspectives: The more bullish sight and the little ...
Ever thought about farming some yield from your Crypto-Hodlings?
Well, that might be a risky task.
But one, which I am happy to experiment around with.
I participated in the Bull run of Binance-coins (BNB) from the year 2018 onwards until now. I held some BNB-coins, when they were...
...below 20 US-Dollar per coin and I also held some, when they were reaching All-Time-Highs at ca. 360 US-Dollar. With such a decent (unrealized) gain-cushion in mind I found myself in the position of an Early-Adopter in the Space of DeFi. But to be more precise: In the adoption phase of Year 1 of that ...
Krypto-Universum liegt aktuell > der 1Billionen-Dollar Schwelle
Grund genug, um zu sehen, wer sich auf den ersten Plätzen bzgl. Marktkapitalisierung so tummelt. Reminder: It is analogous to the free-float capitalization in the stock market. Market Cap = Current Price x Circulating Supply.
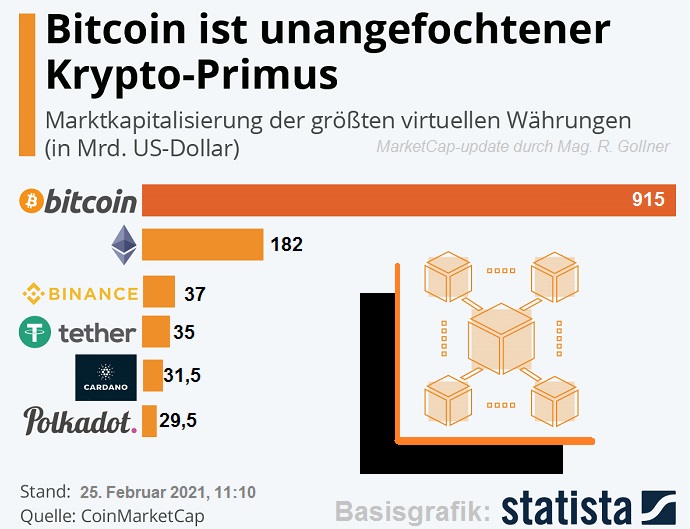
Besonders spannend finde ich persönlich, dass meine Binance-Coins so einen rasanten Aufschwung nun im Januar und Februar 2021 erfahren haben. Dies erfolgte auch im Zuge der DeFi Anwendungen rund um "Pancakeswap.finance", Venus & Co.
DeFi steht für Decentralized Finance; Einige Statistiken und Infos ...
Crypto-Space
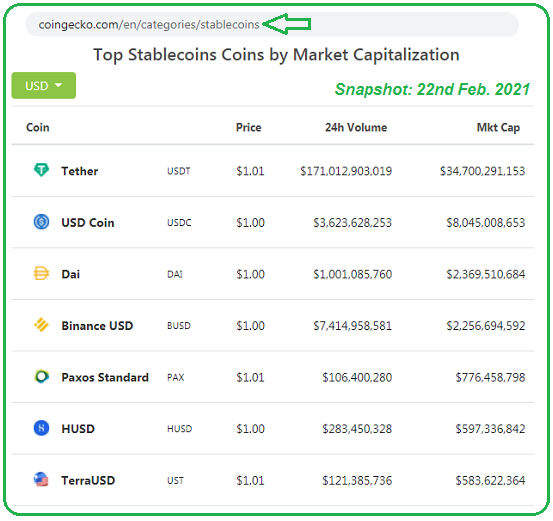
>> Stablecoins <<
Stablecoins are assets that have price stability characteristics that make it suitable to use as a unit of account and store of value, often pegged to a national currency. In recent months the liquidity in this market is gaining steam:
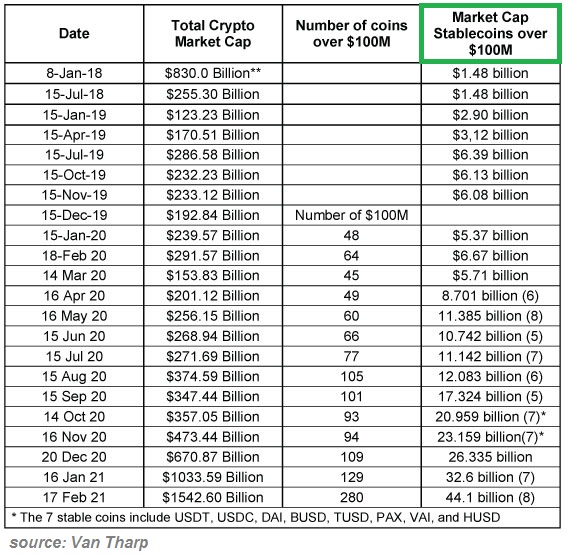
Currently the market cap of the Stablecoins-space sits at ca. 48 billion to 50 billion US-Dollar:
link:
DeFi, what else?
"Coinbureau" is such a great treasure for every Average-Joe out there >> To learn for free anything you want to know about Crypto and Digital assets. Already in March 2020 Coinbureau was crazy about Dezentralized Finance:
Please listen to the video-section above (I earmarked the Video for your from Minute 12 onwards)
As we now know (April 2021) Coins, especially Governance Tokens from the DeFi-Space (Decentzalized Finance) were on a tear during the last quarters producing insane Performance for their holders since Q2-2020.
Reminder: The video above went on air in ...
Binance coin
(BNB)
My technical target reached for the moment: which lies between 110 US-Dollar and 135 USD; Since we are still in an early inning (my best guess), many new outcomes seem possible. I will recheck the exact profit numbers of Binance within the next weeks...
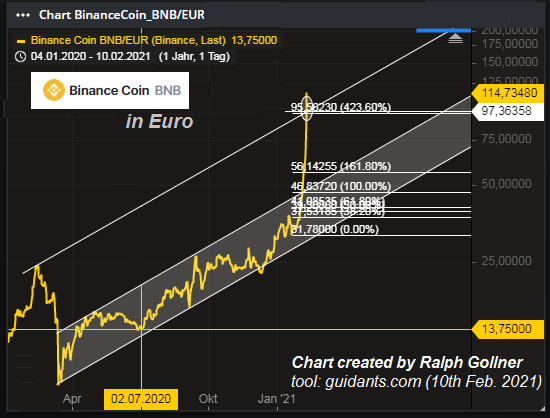
...in order to find out, how I could possibly enlarge my current positions -when suitable- but some info on that topic upfront:
To give you some fundamental Info from the start of December 2020: Binance said, they expect to have profits of USD 800m to US-Dollar 1 billion in the year 2020, up from about USD 570 ...
UPDATE zu meinem Posting vom 13. Dez. 2018
Bitcoin (BTC/USD)-Kursentwicklung nun hier vom
Jan. 2015 bis 3. Jan. 2021
Bei Aktien versuche ich -grundsätzlich- einen langen Anlagehorizont einzuhalten. Bei exotischen Investments wie Kryptowährungen könnte man sich evtl. einen...
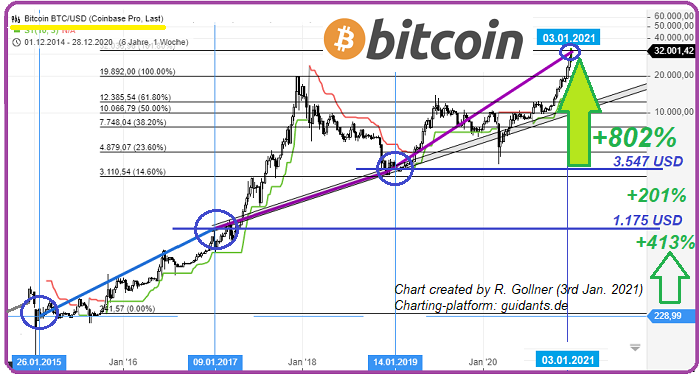
...Anlagehorizont von 4 bis 8 Jahren vornehmen? Aktuell habe ich im Krypto-Universum Investments beispielsweise in Bitcoin (BTC), Ethereum (ETH) und Binance Coins (BNB); Ich versuche bei allen Coins noch mehrere Jahre durchzuhalten...
Hier der REMINDER, dass der BTC alle zwei Jahre sehr schöne Sprünge NACH OBEN ...
Bitcoin-FLASHNEWS
Heute vormittags (Wiener/Europäischer Zeit) ist der Bitcoin-Kurs nun über 22.000 US-Dollar! Solange der Kurs über 20.000 USD verbleibt, bin ich guter Dinge und bleibe (natürlich) weiterhin investiert. Reminder: KEINE EMPFEHLUNG!
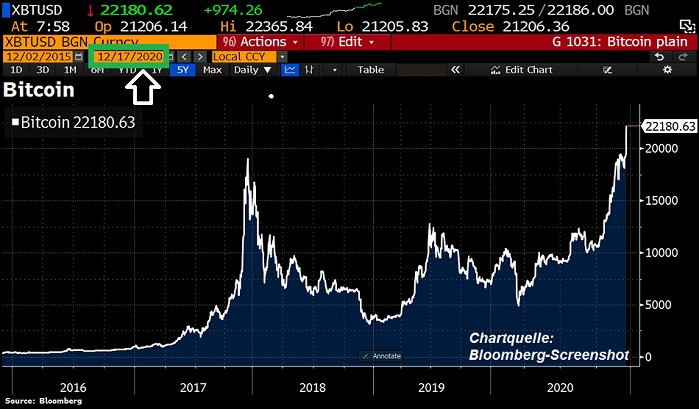
Ich bin auf jeden Fall noch immer recht überzeugt von der Qualität und der Stabilität des dezentralen Netwerks. Es hat sich ja auch bereits seit mehr als 10 Jahren bewährt. Keyword: Bitcoin wird wohl mittlerweile als Longterm-Store of Value angesehen, wenn schon nicht als Medium of Exchange...
Aber was nicht ist, könnte noch werden (siehe ...
Bitcoin and hurdles (Nov. 2020)
My best guess: No further comment needed, IF Bitcoin stays above 10,000 USD!
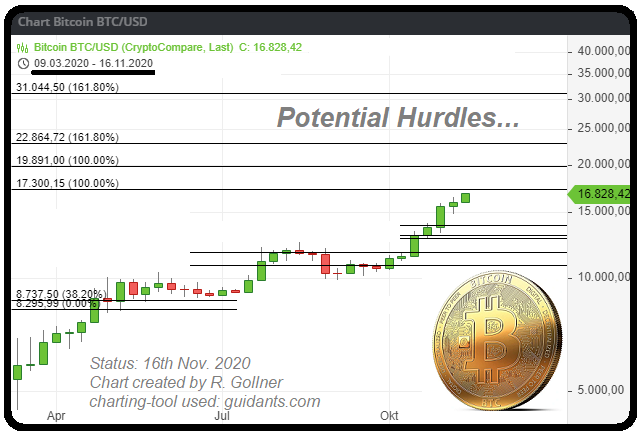
Cheers Ralph
Disclosure: I am currently (as per 16th Nov. 2020) invested in BTC directly AND indirectly via certificates
Stelar returns :-)
Market Volatility is what can give you stellar returns
link / this article was posted circa 1 year ago:
p.s I like CZ ;-)
Bitcoin
Inverse SHS-pattern (?)
As the name suggests, this is the opposite of the well known head and shoulders (SHS) pattern - and as such, it indicates a bullish reversal. An inverse head and shoulders is formed when the price falls to a lower low in...
...a downtrend, then bounces and finds support at roughly the same level as the first low. The pattern is confirmed once the price breaches the neckline resistance and continues higher.
If you need a perfect example of an Inverse SHS-pattern it would look like following graph:
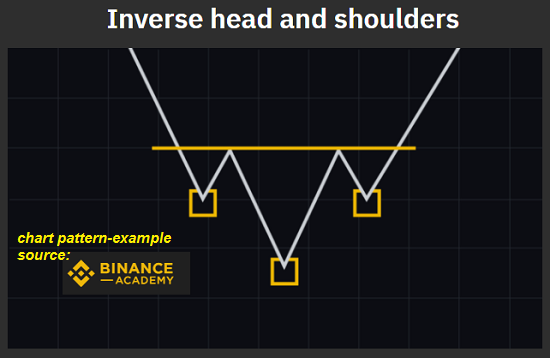
If you find time please also read the interesting ...
BTC zwischen
12.500 und 9.200 USD
Die Sandwich-Zone für den Bitcoin ist mittelfristig mit den Marken 12.500 USD auf der Oberseite und 9.200 USD auf der Unterseite abgesteckt. In der Zwischenzeit spielen sich interessante Entwicklungen beim ETH-Preis und bei den DeFi-assets ab.
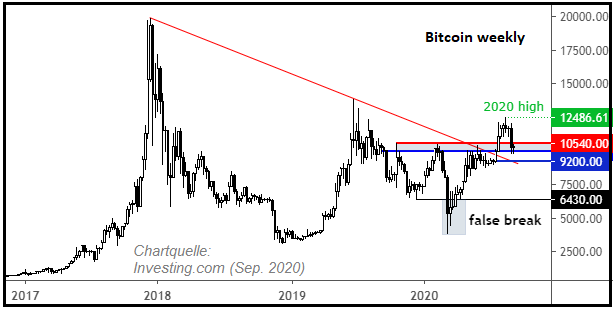
DeFi ist ein spannendes Thema; Als Einstieg bittet sich folgender link an: https://defipulse.com
Resumé: Ein nachhaltiger Ausbruch über 12.550 USD könnte ein Feuerwerk entfachen...sofern der BTC/USD nicht vorher eher unter 9.000 USD abtaucht...
link:
...
BITCOIN
Supertrendindikator-Signal auf Wochenbasis?
Ein Indikator, der letztens an Popularität gewonnen hat, ist der Supertrend. Vielleicht liegt es nur am Namen, dass dieser zunehmend im Repertoire vieler privater Trader auftauchte...(?)
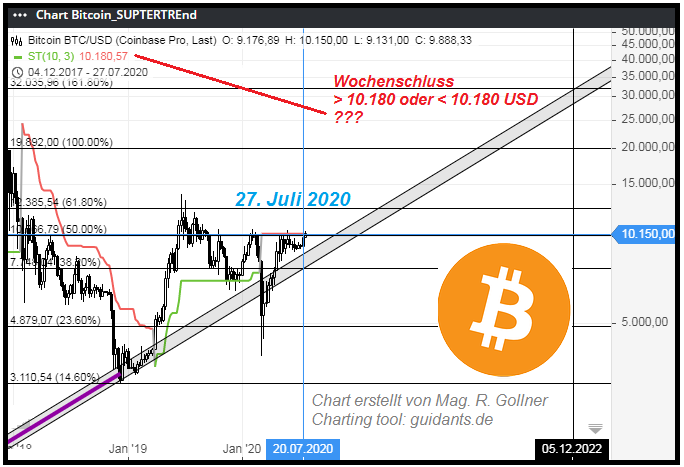
Basis des Supertrends ist ein gewichteter Mittelkurs des Basiswerts. Ausgehend von diesem Mittelwert wird nun die sogenannte Average True Range über die letzten N-Perioden gebildet. Entwickelt von Wilder misst die Average True Range (kurz: ATR) die "wahre durchschnittliche Schwankungsbreite" einzelner Kerzen über die letzten N-Perioden. Entstand im ...
Bitcoin-Halving (Mai 2020)
Im Code der Bitcoin Blockchain ist festgehalten, dass alle 210.000 Blöcke ein Bitcoin Halving stattfindet. Die ersten beiden fanden in den Jahren 2012 und 2016 statt, nachdem der Bitcoin 2008 ins Leben gerufen wurde. Das nächste Halving...
...steht kurz bevor.
Was ist ein Bitcoin Halving überhaupt?
Als Satoshi Nakamoto vor zwölf Jahren die Bitcoin Blockchain ins Leben gerufen hat, legte er die maximal verfügbare Anzahl Bitcoins auf 21 Millionen fest. Diese Bitcoins kamen damals aber nicht alle gleichzeitig auf den Markt: Die Nutzer des Bitcoin-Netzwerkes ...
Bitcoin-Stats (Cryptocurrencies)
June/July 2019
In the last months and quarters the Bitcoin-price and the whole Digital-Assets universe found an intermediate bottom. So let's take a quick look at some statistics regarding bitcoin and its adoption (Bitcoin ATM-installations/"installed base").
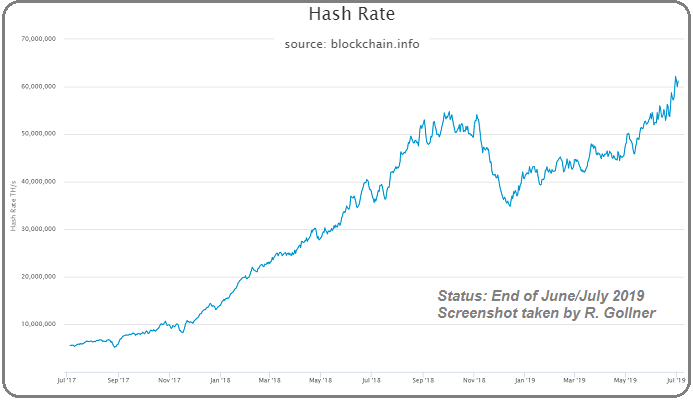
A new All-Time-High in the Hash Rate-records; Nice to start with !
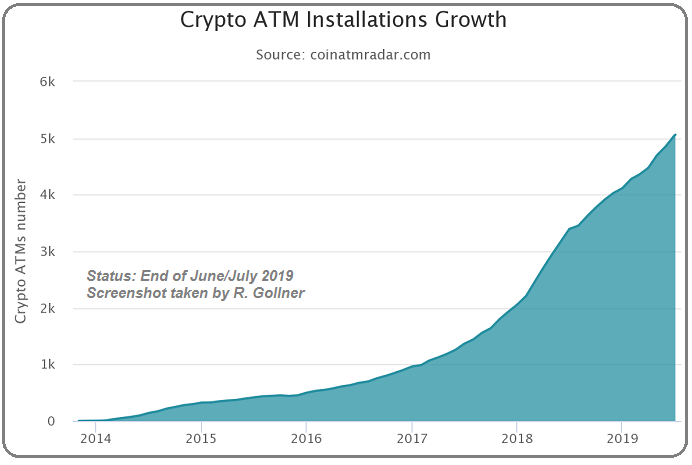
Interesting detail:
My home-country Austria and my home-town Vienna are leading locations in the Crypto-Space :-)
![]()
So far the pick-up in demand (rising Cryptocurr.-prices) seems plausible and justified, at least to me.
cheers
...
BITCOIN bei ca. 10.000 USD
(Juni 2019)
Der Chart erinnert etwas an die NASDAQ aus dem Jahr 2000, mit dem darauf folgenden 16 Jahre lang währenden Hängebauch, um dann ein neues Allzeithoch zu erreichen. Das Jahr 2019 war bisher ganz stark vom Comeback des Bitcoin und...

...auch des sonstigen Kryptowährung-Universums geprägt. Spannend, dass nebenbei auch die "normalen" financial assets wie Aktienindizes und Anleihepreise im Jahr 2019 starke Anstiege verzeichnen können. Nach einem durchwachsenem Finanzjahr 2018 aber vielleicht auch nicht so verwunderlich...
Auf jeden Fall schiebt sich ...
Bitcoin (BTC/USD)-Kursentwicklung
Jan. 2015 bis 13. Dez. 2018
Bei Aktien versuche ich -grundsätzlich- einen langen Anlagehorizont einzuhalten. Bei exotischen Investments wie Kryptowährungen könnte man sich evtl. einen Anlagehorizont von 4 bis 8 Jahre vornehmen. Aktuell...
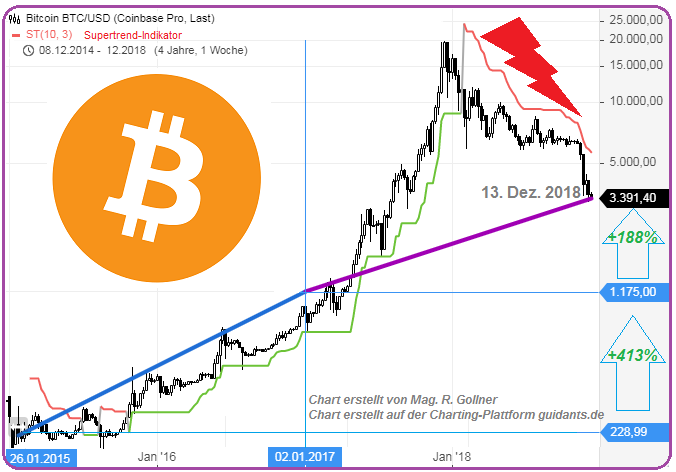
...habe ich im Krypto-Universum ein Mini(MIKRO!)-Investment in Binance Coins (BNB), jedoch keine Investments in Bitcoin (BTC), oder Ethereum beispielsweise - diese crypto-assets sind mir mittlerweile (aktuell) zuu riskant! Bei BNB versuche ich noch mehrere Jahre durchzuhalten...
DENNOCH:
Oft wird vergessen, dass der ...
Oil Demand
(in the years 2000 - 2015)
Let's track the world oil demand as another useful way to monitor the global economy. World crude oil usage rose to a record high of 89.5mbd in the year 2012 (Status: Sep. 2012 and 12 months before). While "Old World" demand remained depressed...
...at that time, "New World" demand already rose to a fresh record high. The latter exceeded the former by 39% ! (already). March 2005 was the inflection point where New World began to exceed Old World demand.
The next Figure, below, shows a the interesting shift: a shift in the way oil supplies were ...
Cryptocurrency-Exchange(s)
Trade-Volume
Coinbase and Binance might be the most well known Cryptoexchanges as per June 2018; As most people know: Cryptocurrencies can be traded through cryptocurrency exchanges. These cryptocurrency exchanges are platforms through...
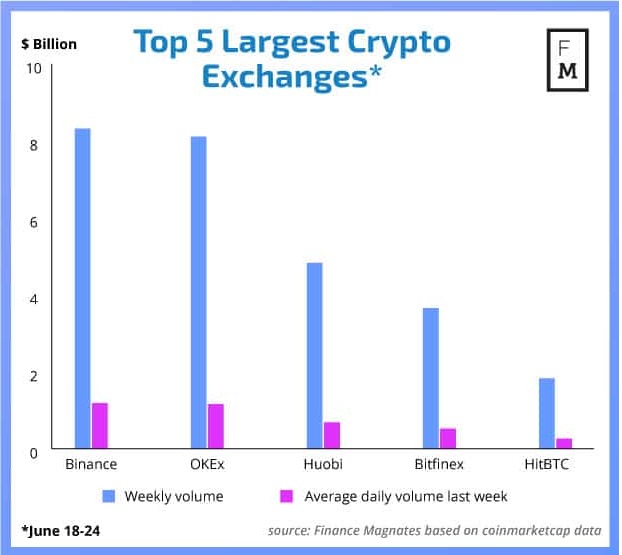
...which you can purchase or sell digital currencies for dollars, euros, and pounds, as well as other digital assets. For example, you can sell bitcoins and purchase dollars with the sold bitcoins, or you could exchange bitcoins for ether.
These exchanges are a vital part of the virtual currency expansion rate. Currently ...
Crypto Portfolio (Jan. 2017 vs. May 2018)
If you applied several Risk Management measures on the way up throughout the last quarters your Crypto Portfolio may have had an equity curve like the one stated below (in EURO):
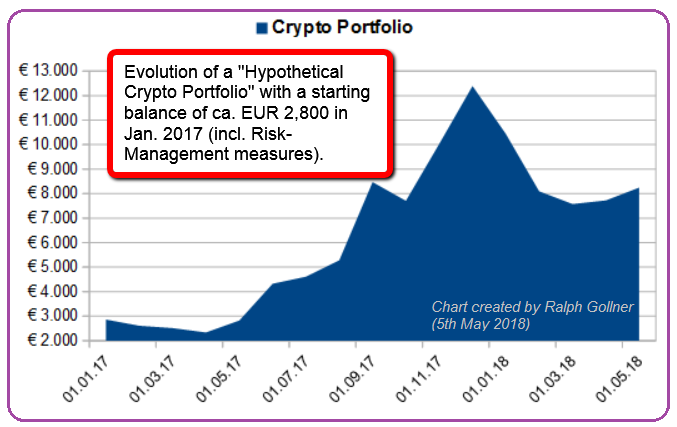
Good Luck
Reminder: The Cryptocurrency-Universe is a HIGH-RISK sector.
Do your homework first !
ETH (Magic USD 38 billion floor)
There is some kind of turnaround taking place in the last few days (weeks) in the cryptocurrencies-universe. I am holding again ETH and now also Bitcoin Cash. But still, Bitcoin is NOT part of my Crypto-Holdings - yet -
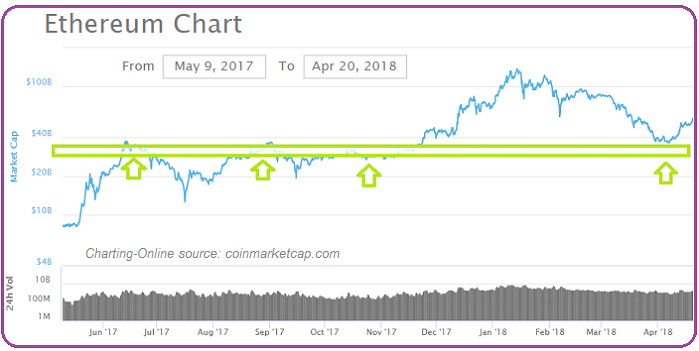
In the chart above one can clearly see the supporting level (area) around USD 38 bn, where ETH is bouncing off from its lows to form some kind of short/intermediate uptrend (This area also relates to an ETH-price of approx. USD 380).
Just some short remarks on the cryptocoin Ether:
Ethereum is a decentralized platform for ...
EURTRY
Ein sehr heisses Eisen ("tricky situation")
Die Türkei schuldet ausländischen Gläubigern (per Q1-2018) 450 Milliarden Dollar, von denen 276 Milliarden Dollar in in Dollar und Euro denominiert sind. Der türkische Entwicklungsminister Lütfi Elvan...
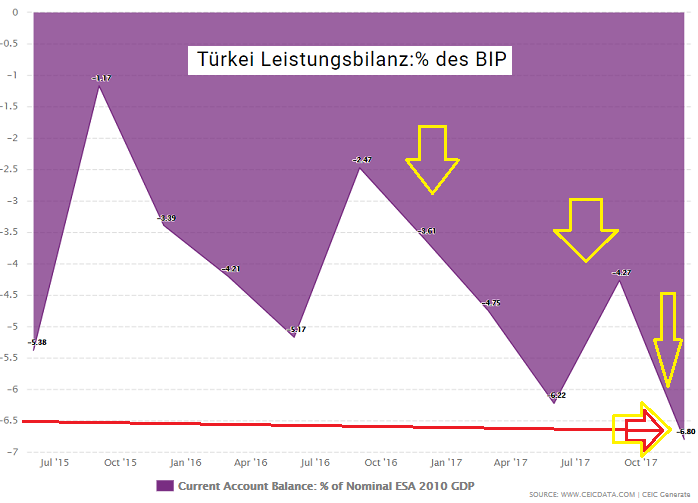
...sagte der Zeitung Milliyet, dass der türkische Privatsektor zu ca. einem Drittel (36%) in ausländischen Währungen verschuldet sei.
Kurzfristige Schulden, die spätestens innerhalb von 12 Monaten zurückzuzahlen sind, machen (wohl) etwa ein Viertel der Gesamtschulden aus. Diese Daten legen nahe, dass der aktuelle Wertverlust der Lira ...
EUR/CHF
(Euro / Schweizer Franken)
Der Euro nimmt (wieder) mehr Momentum gegenüber seinem "Nachbarn", den Schweizer Franken, auf (siehe die stark ansteigenden Durchschnittslinien EMA, DEMA und TEMA, jeweils auf 50-Tagesbasis).
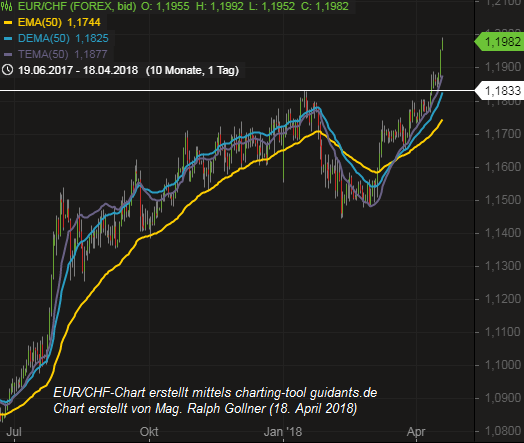
Es bleibt - wie immer - spannend im globalen Währungshandel.
BTC-Seasonality (2010 - 2017)
Das "Bitcoin - Krypto-Team" ist recht praktisch unterwegs...hier einer ihrer Artikel! In medias res: Aus saisonaler Sicht wird es für Bitcoin nun besonders spannend. Welcher Börsenmonat weist die höchste Gewinnwahrscheinlichkeit auf, wann drohen stärkere...
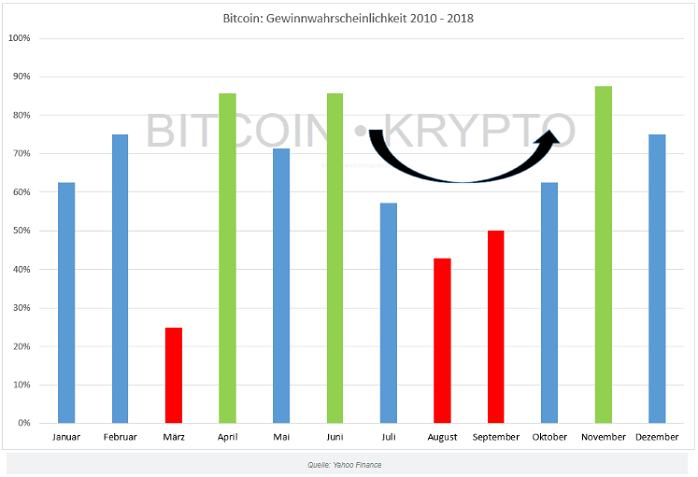
...Rückschläge und welche Durchschnittsperformance ist in den einzelnen Monaten zu erwarten? Während es vor allem für die amerikanischen Aktienmärkte inzwischen umfangreiche Statistiken gibt, sind ähnliche Auswertungen für den DAX bisher noch selten. Für Bitcoin sieht es noch schlechter aus. Die ...
Cryptocurrency-Exchange(s)
Coinbase and Binance might be the most well known Cryptoexchanges as per March 2018; As most people know: Cryptocurrencies can be traded through cryptocurrency exchanges. These cryptocurrency exchanges are platforms through...
...which you can purchase or sell digital currencies for dollars, euros, and pounds, as well as other digital assets. For example, you can sell bitcoins and purchase dollars with the sold bitcoins, or you could exchange bitcoins for ether. These exchanges are a vital part of the virtual currency expansion rate.
Upfront info / ...
Bitcoin (Magic Level, "To B or NOT to b" ?)
Since there are many theories in the Crypto-Market on how to value Bitcoin & Co. one has to find ones way through that jungle. Technicals could provide some sort of help for ones Risk-Management, Position-Sizing, etc.
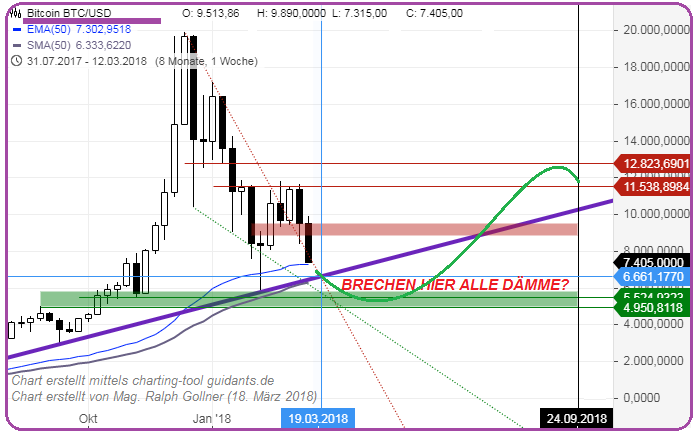
We will have to see, if the level of 6,666 USD will be reached, or if a bounce from current levels should satisfy the steep correction from the 20k-levels (nearly) touched in the final months of last year (2017).
As can be seen in the chart above, a potential downmove with an eventual uplift in the upcoming months, could even ...
BITCOIN
"Magic Fibo-levels" for the (near?) future
9.200 points @ 23.6%-Fibonacci-level, 11.230 @ 38.2%-level, 12.880 @ 50%-level, 14.540 @ 61.8%-level. Sustainable breaks to the upside -a break of each level- needed, if a further rise can be anticipated...Please also check the Moving...
...Average -potential support line- if needed (SMA 28-weeks given in the weekly updated chart above). Btw.: one should always have a look at the downtrend-line and a potential sustainable break to the upside, which occured in the most recent days...(Status: 4th March 2018). Please -THEREFORE- also take ...
ETH (Ethereum < USD 556)
Well, the "digital asset" Ethereum (ETH) is now below the "short-term" support-level of USD 556. The next step to see will be, if the level of USD 555 (see daily candle of 6th Feb. 2018) can be re-gained again within the next days or weeks and...
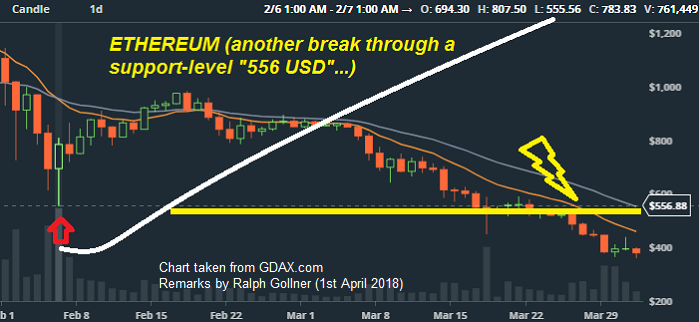
...eventually be defended by (a) Sunday's closing price. As we know, cryptocurrencies are being traded (b) 24/7: without a stop! Good Luck, if you are involved !!
Disclaimer: Extremely high risk, total loss possible - as we (hopefully) all know !!!
Litecoin (LTC), Downtrend-Break
Litecoin Definition: What actually is Litecoin? Well, Litecoin is a digital currency (often these are also called crypto-currencies) which is not backed by any country's central bank or government. Still, like other currencies, Litecoins can be...
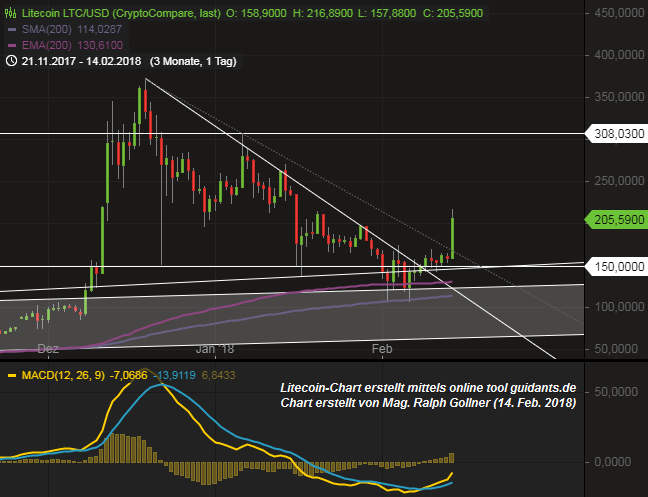
...traded for goods or services. So you have heard of other cryptocurrencies, such as Bitcoin and Ethereum. Then Litecoin is currently one of the five largest cryptocurrencies in circulation. Transactions from one Litecoin to another are made by digitally exchanging heavily encrypted hash codes across a ...
DASH (Trendkanal)
Jeder "Dash-Preis" > 400 USD lässt noch "nach mehr" hoffen. Allerdings ist wohl das Wichtigste für diese Kryptowährung, dass Niveaus über 200 USD gehalten werden, um nicht -KURZFRISTIG- von einem totalen Crash sprechen zu müssen. Interessanterweise notierte...
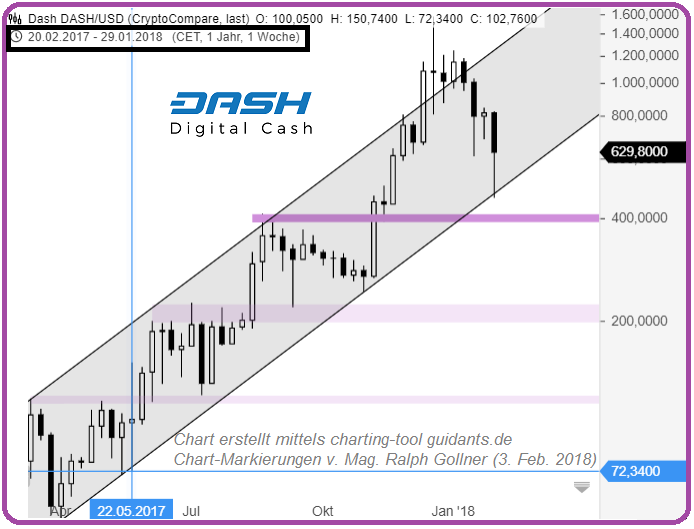
...DASH (aber) Ende Mai 2017 (erst) bei ca. 72 USD (siehe Chart). Somit hat sich der DASH-Kurs in diesem kurzen Zeitraum (Mai 2017 bis Anfang Februar 2018) mehr als verachtfacht!! Aktuell befindet sich DASH eher bei 700 USD als bei 70 USD...
Nach dem normalen "DASH" gibt es nun eine Krypto-Wallet(-Idee) für ...
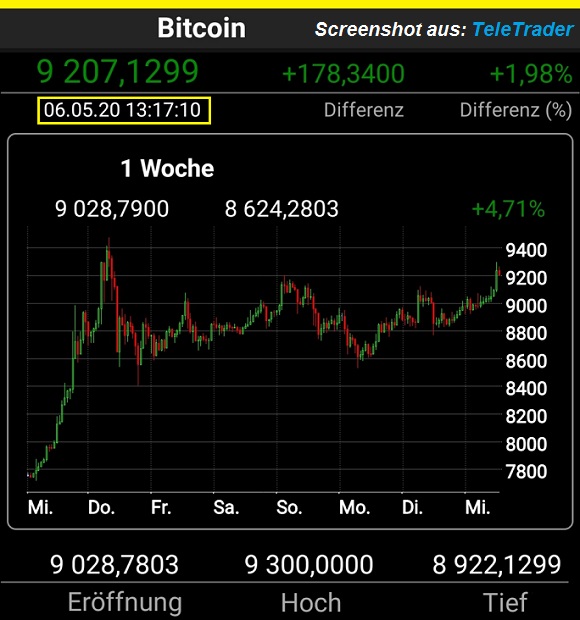
Bitcoin @ magic 10k-level
Let's see if this psychological level will hold as support, or if it will be cut through like butter.
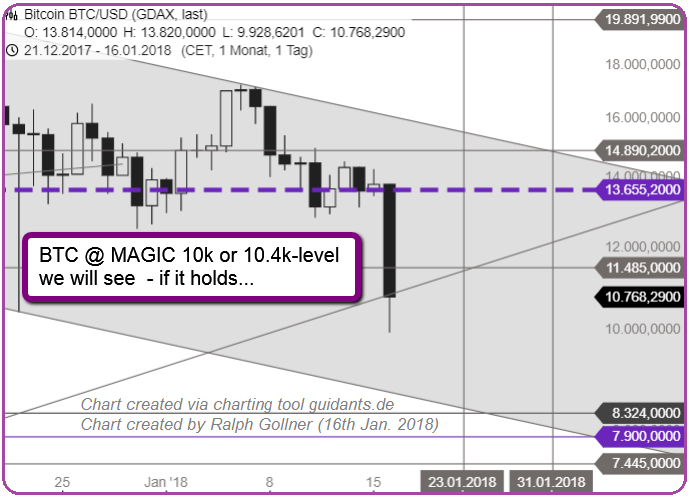
This week is far from being over (weekend also still to come by ; -)
Therefore the weekly candle is still "in the making" !
Disclaimer/Disclosure: Ralph Gollner hereby discloses that he is directly and indirectly investing in Ethereum and Bitcoin. Bitcoin is subject of this commentary, Snapshot above (as per 16th Jan. 2018). Reminder: HIGH RISK !
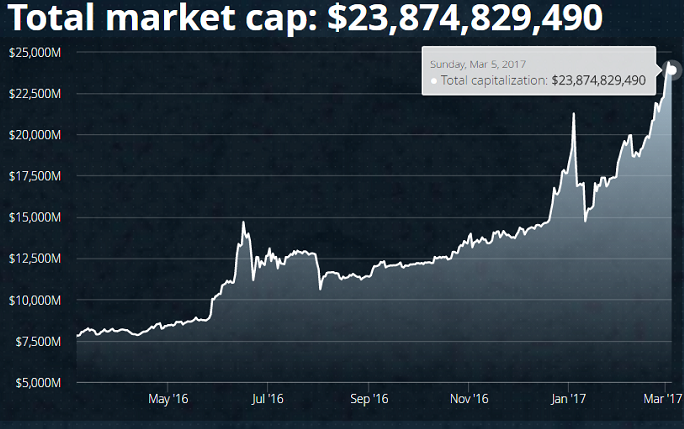
Cryptocurrencies Total-Market Cap ("now")
The cryptocurrency "Bitcoin (BTC)" is still number one - following the units issued times current market price per BTC. But there are many other cryptocrrencies around. In total they now make up more than USD 680 bn in Market Value:
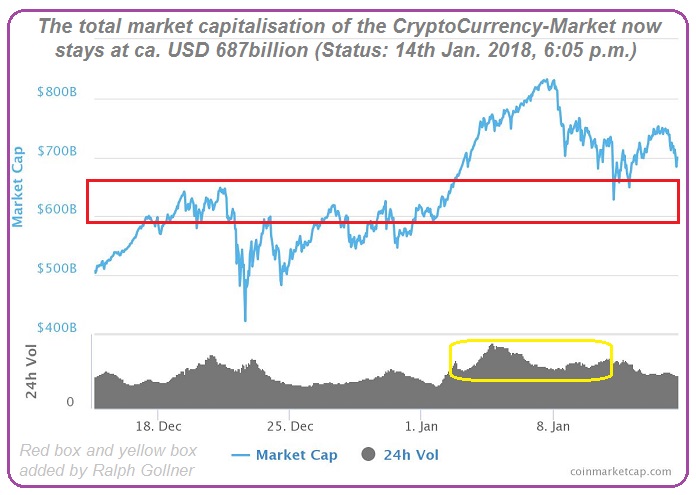
From the chart above one can see that I (Ralph Gollner) see "special risiks" if the Total Market-Cap of the Cryptocurrency-space falls below the magic USD 600bn-level >>> a Level which has established itself as some kind of relevant support / signal-level to look at.
There are many questions from Newbies, who are ...
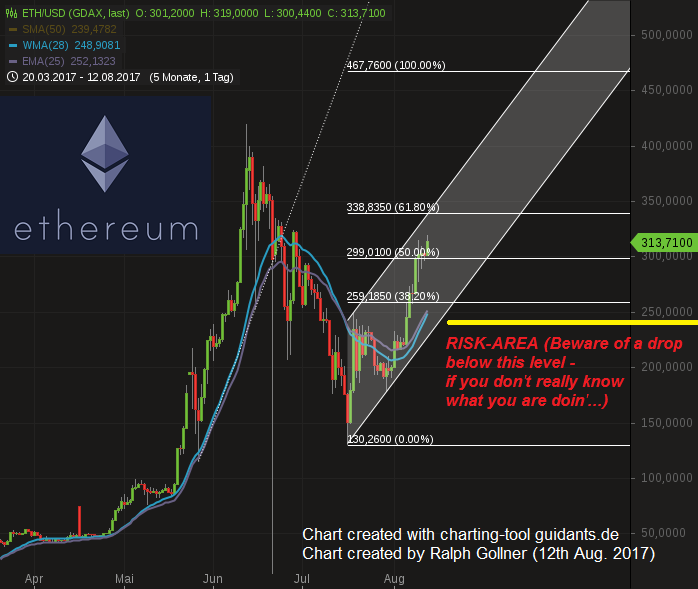
ETH (Chart-update)
The "Fibonacci-Framework" from August 2017 (my elder posting) is still in place. Furthermore I updated the scenario for "my" potential Risk-Zone! As long as the Ethereum/USD price stays above 670 USD - I should not be feeling overly stressed..
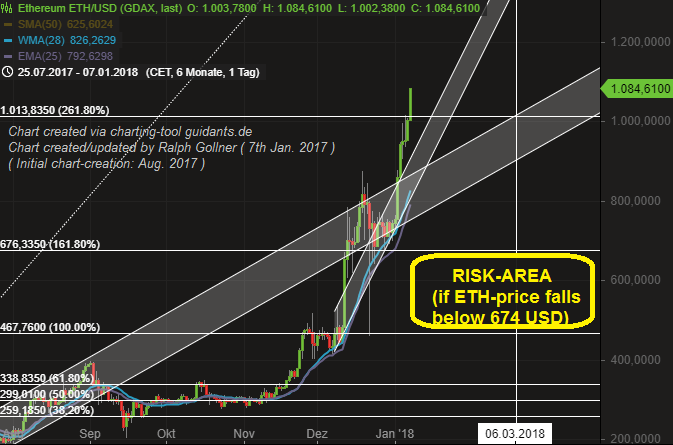
Disclosure / Disclaimer: Ralph Gollner hereby discloses that he is directly and indirectly investing in Ethereum and Bitcoin. Ethereum is subject of the commentary above (as per 7th January 2018). Reminder: High Risk !
Blockchain Transactions
(Number and Volume)
Bitcoin Transactions# and USD-Volume (eventually NVT Ratio)
♦ Daily Transactions (please find the "Live-Counter" under following link: https://blockchain.info/de )
♦ Recheck also the USD volume transmitted through the blockchain since "its launch"
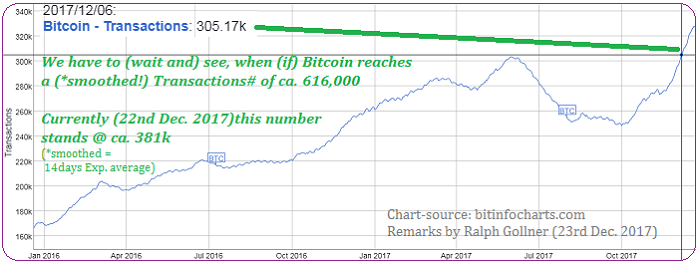
>>> USD volume as per 22nd Dec. 2017: 3,883,534,990 (ca. 3,99bn)
>> USD volume as per 5th March 2017: 381,747,467 (ca. 381mn)
=> factor 10 within less than 10 months !!
links:
https://blockchain.info/de/charts
http://charts.woobull.com/bitcoin-nvt-ratio Recheck a possible valuation - indicated her ...
Bitcoin - Kleiner Black Friday
(22. Dez. 2017)
Der heutige Tag hat nicht nur in den Finanz-Medien, sondern auch innerhalb der "Digital-Currencies Community" zu heftigen Ausschlägen geführt. Nicht nur der Bitcoin, auch die meisten anderen Alt-Coins sind teilweise zig-Prozent abwärts...
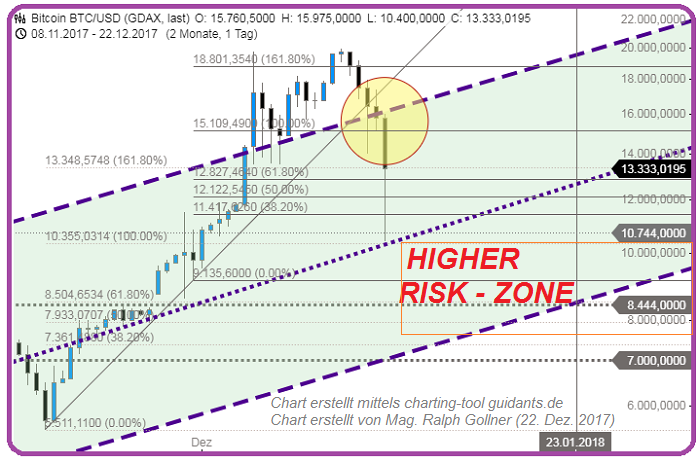
...gerauscht. Hält man (aber) nun etwas inne und betrachtet den Run seit November 2017 - dann sieht man doch, dass ein "Einbruch" evtl. gar richtig und im Endeffekt auch wichtig ist (war?). Bei jedem Medien-Hype werden unerfahrene Greenhorns angelockt, welche sich noch nie eine Stunde, geschweige denn ...
Ethereum (new All-Time-High)
Ethereum, the 2nd most popular cryptocurrency, surged by over 30% in the last 24 hours to reach a current price of over USD 620 today (12th Dec. 2017). Today's surge might also have to do with the fact that the ethereum network recorded its highest number...
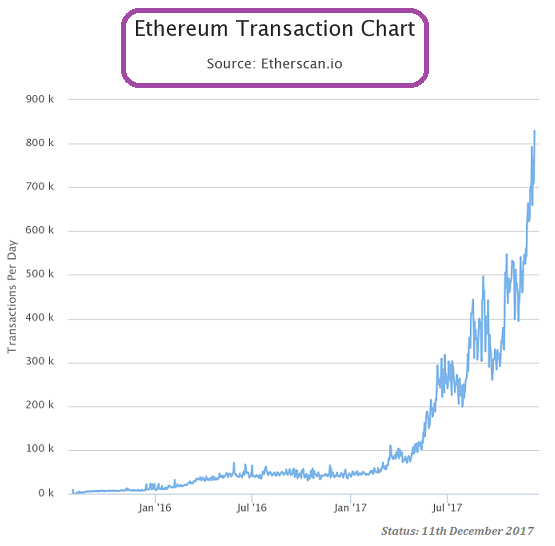
...of transactions yesterday (11th Dec. 2017). Furthermore: The record comes a day after a group of banks led by UBS announced a data quality control project on Ethereum's blockchain. As a Reminder: Ethereum's blockchain, unlike bitcoin's, can support layered on applications and facilitates so-called ...
Ethereum (23rd Nov. 2017 until Xmas)
Ethereum is a decentralised platform for applications. It is powered by Ether - a cryptocurrency, which is in turn powered by the Blockchain technology. Applications are built with the use of smart contracts - computer algorithms which...
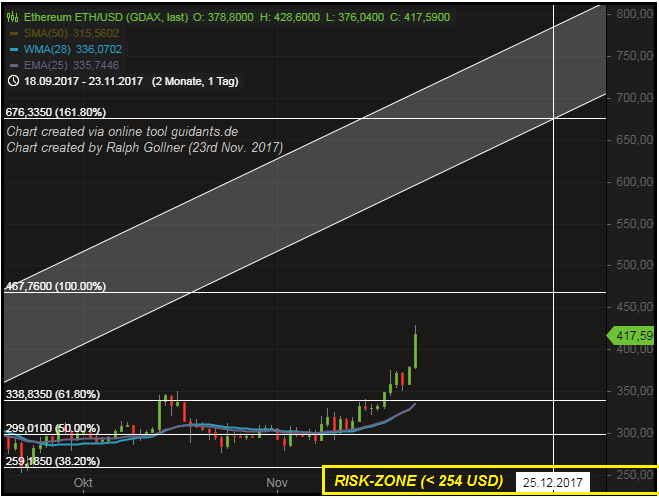
...execute themselves, based on incoming data from the network. The self-fulfilling nature of such applications allows them to run without reliability issues associated with human operators.
Ethereum has managed to achieve its success due to the implementation of the revolutionary technology of smart contracts, ...
Bitcoin (BTC/USD) & Fibonacci
(Status: 6. Okt. 2017)
Self-fulfilling Prophecy (?) und Fibonacci-Zahlen: Eine unendliche Zahlenreihe, die mit 0 und 1 beginnt. Jede weitere Zahl entspricht dabei der Summe der beiden vorangegangenen Zahlen. Damit lautet der Anfang der Zahlenreihe...
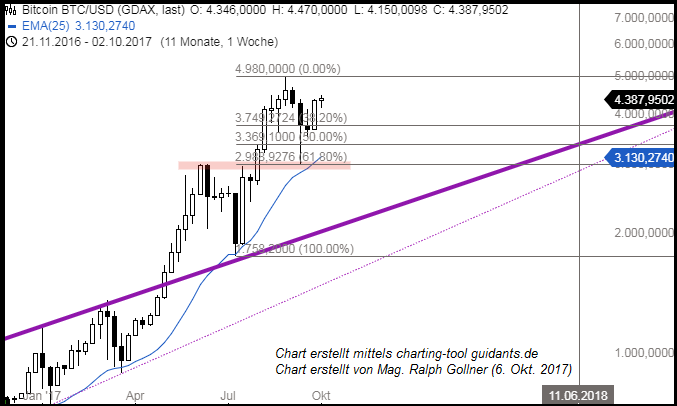
...0, 1, 1, 2, 3, 5, 8, 13, 21, 34, 55, 89 usw. Der Quotient von zwei aufeinanderfolgenden Zahlen (z.B. 55 und 89) läuft immer mehr gegen 0,618, je höher die Zahlen werden.
Reminder: In der Mathematik und in den Naturwissenschaften bezeichnet der Quotient ein Verhältnis von zwei Größen zueinander, also das ...
10fold = Bubble?
(what do you say 'bout China?)
No, the following chart is NOT Bitcoin and also not the GDP of China between the years 1990 and 2005. Both of which increased tenfold within different timeframes. Bitcoin rose from 500 USD to ca. 5,000 in a couple of some quarters; Nasdaq:
You can go on and now try to compare the development of the Nasdaq Stock-Index above (.com Bubble) to the rise of Bitcoin from a "similar level" of 500 up to 5,000 in the following chart (XX:NYXBT stands for the Bitcoin-price in USD):
Everything that is rising by 1,000% is not -by itself- a bubble! ...
Ethereum (ETH/USD)
Not only to me, it seems obvious that more of the largest corporations and biggest names are getting behind Ethereum. This is mostly due to the technological advantage that Ethereum has as one of the most widely used blockchain based technology platforms and...
...the widespread adoption of the Ethereum platform in general. Ethereum has come close a few weeks ago to Bitcoin, when ETH's overall value (referred to as Market Cap) was roughly 80% of Bitcoin.
Disclaimer: Ralph Gollner hereby discloses that he is directly and indirectly investing in Ethereum and Bitcoin. ...
BITCOIN up OR down (who knows...)
Bitcoin got a vote of confidence from Switzerland's legendary banking system (as per 12th July 2017). -) Falcon Private Bank said on 12th July 2017 it received approval from a Swiss regulator to offer bitcoin products. This was the first time the Swiss...
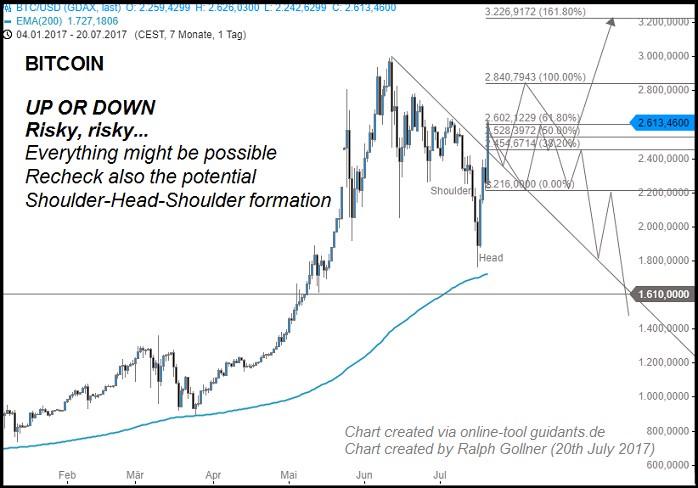
...regulator has done so. The decision could pave the way for other global regulators to approve bitcoin products.
More detailed info here: Switzerland's financial markets regulator has approved the first Swiss private bank for bitcoin asset management, potentially paving the way for other global ...
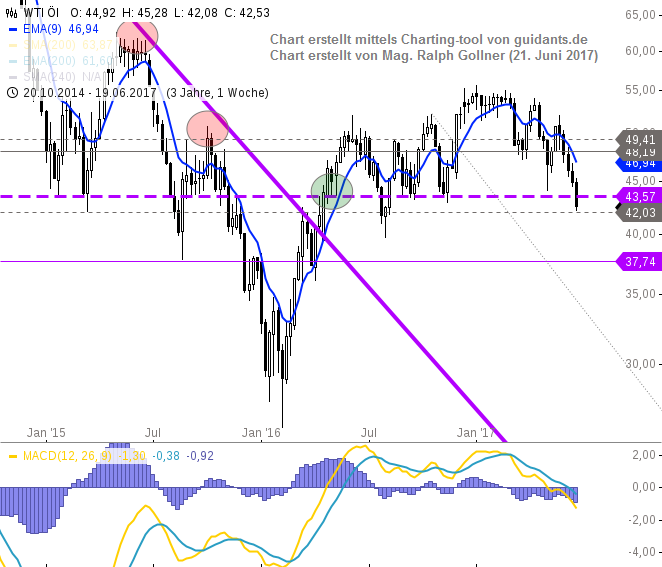
WTI Öl
Sofern WTI-Öl über einem Level von USD 40 verbleibt, kann man ruhig bleiben und es besteht kein Grund zur Panik. Sofern jedoch WTI Öl per Monatsende unter USD 40 notieren sollte, könnten Einige "Panik" und/oder Angst kriegen...
Oil (WTI-Crude), Long-Term (1978-2016)
WTI-Crude Oil hält sich über dem Level von 30,66 USD pro Fass (Möglichkeit zur Stabilisierung). Sollte der Pries jedoch unter die 30,66 USD-Marke -per Wochenschluss- sinken, könnte es wieder brenzlig werden (Status: 24. Feb. 2016).
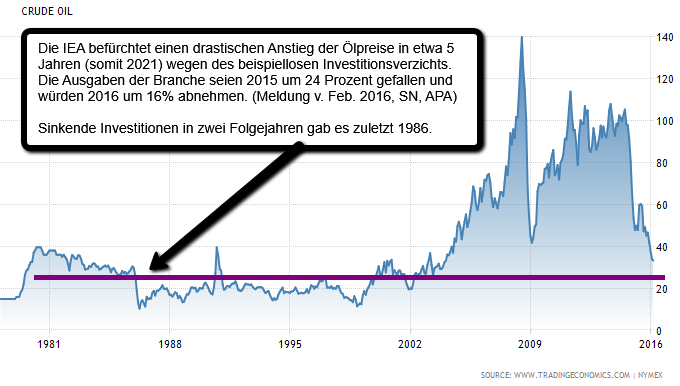
Oil (china demand/global supply), Status: Jan. 2016
EIA estimates that global oil inventories increased by 1.9 million b/d in 2015, marking the second consecutive year of inventory builds. Most important: DEMAND is still ok (my opinion), the extreme oversupply is the "problem".
 source: https://www.iea.org
This oversupply has contributed to oil prices reaching the lowest monthly average level since mid-2004. Inventories are forecast to rise by an additional 0.7 million b/d in 2016, before the global oil market becomes relatively balanced in 2017. source for text: https://www.eia.gov
...
Commodities Index (1981 - 2016)
From Wikipedia, the free encyclopedia: Thomson Reuters/Core Commodity CRB Index; Comment in "gold" by Clive Maund:
 The Thomson Reuters/Core Commodity CRB Index (TR/CC CRB) is a commodity futures price index. It was first calculated by Commodity Research Bureau, Inc. in 1957 and made its inaugural appearance in the 1958 CRB Commodity Year Book.
Currently the index is made up of 19 commodities as quoted on the NYMEX, CBOT, LME, CME and COMEX exchanges. These are sorted into 4 groups, each with different weightings. These groups are:
♦ Petroleum based ...
Kupfer / Dr. Copper (Sep. 2015)
Wenn Ärzte schlechte Nachrichten überbringen müssen, haben sie stets zwei Möglichkeiten: die sanfte oder die harte Tour. Beides hat manchmal seine Vorteile. Dr. Copper hat sich nun gerade mal wieder für die harte Variante entschieden. Schnell und heftig überbrachte er seine Botschaft die letzten Monate (Status Aug. 2015).
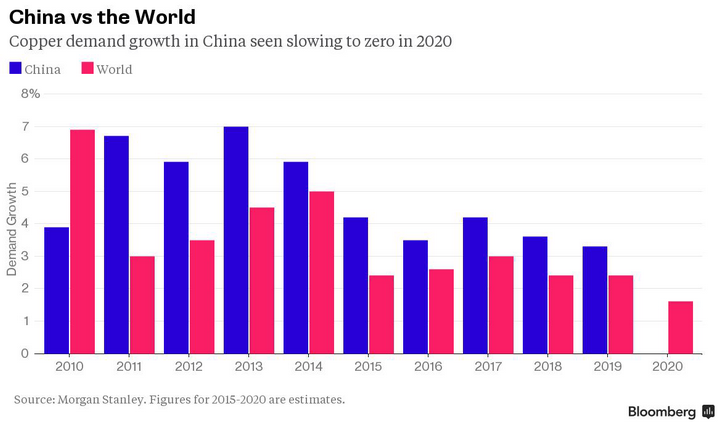
Bei Dr. Copper handelt es sich jedoch nicht um einen Mediziner. Vielmehr wird so am Finanzmarkt oft der Kupferpreis bezeichnet. Denn dieser gilt als wichtiges Instrument, um den Gesundheitszustand der Weltkonjunktur zu diagnostizieren.
...
Related Articles
Gold Ratios
There are two gold and silver miners indices frequently referred to: Philadelphia Gold and Silver miners index with ticker ^XAU (data since Dec 19, 1983) and the AMEX Unhedged Gold Bugs Index with ticker ^HUI (data since Jun 04, 1996).
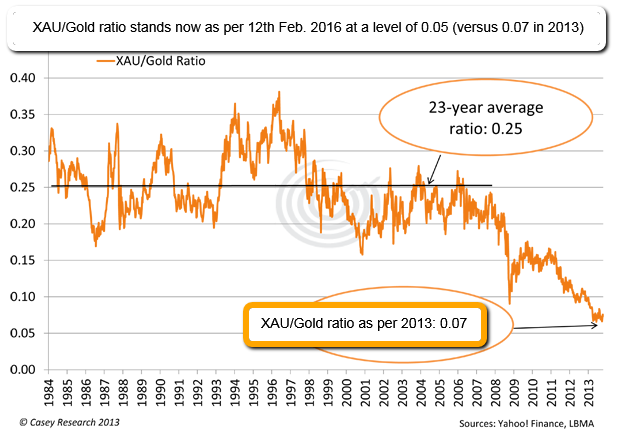 The Philadelphia Gold & Silver Index (XAU) is ...
Silber (2003 - April 2016)
Silber profitiert Marktbeobachtern zufolge von einer Wiederbelebung der Industrienachfrage insbesondere in China. Und mehr als die Hälfte der Nachfrage nach dem „Edelmetall des kleinen Mannes“ stammt aus diesem Bereich.
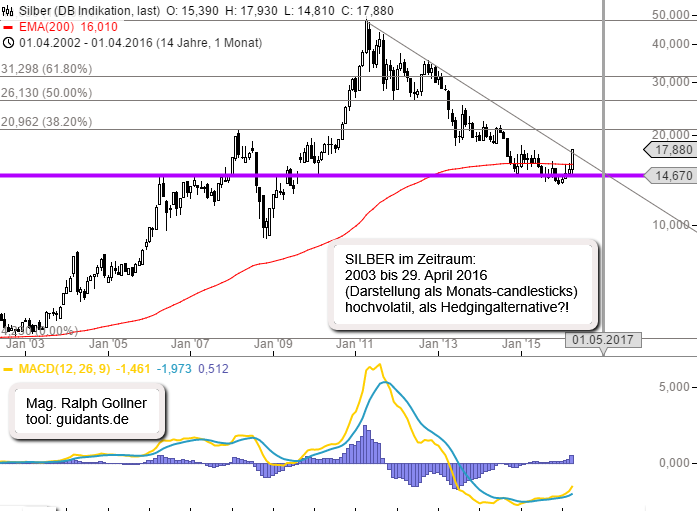
Silber wird beispielsweise in Legierungen, ...
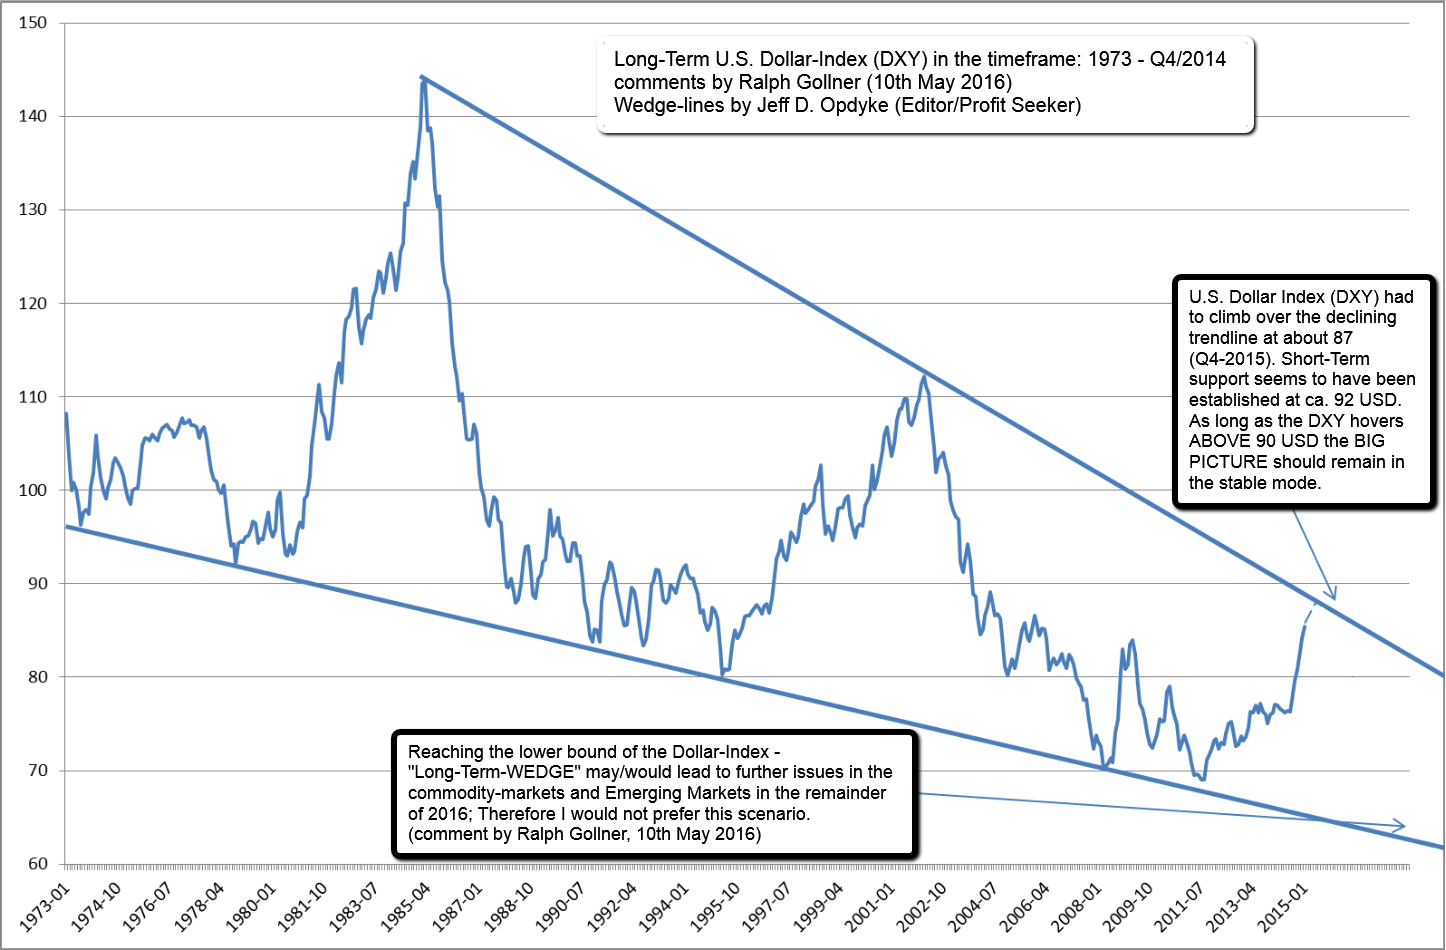
U.S. Dollar Index (DXY, 1973 - 2015)
To stock market technicians, the Long-Term Chart below is the mother of all "descending wedge" patterns. It's the U.S. Dollar Index, as measured and reported monthly by the Treasury Department, going back more than four decades.
 Please click for the BIG ...
Oil (WTI)
Die durch den Fracking-Boom in den USA mitausgelösten Überkapazitäten bei der Ölproduktion belasteten seit Sommer 2014 massiv den Ölpreis. Zuletzt führten Förderkürzungen aber wieder zu einer Stabilisierung.
So sind die Rohöllagerbestände in den USA sind in der vergangenen Woche ...
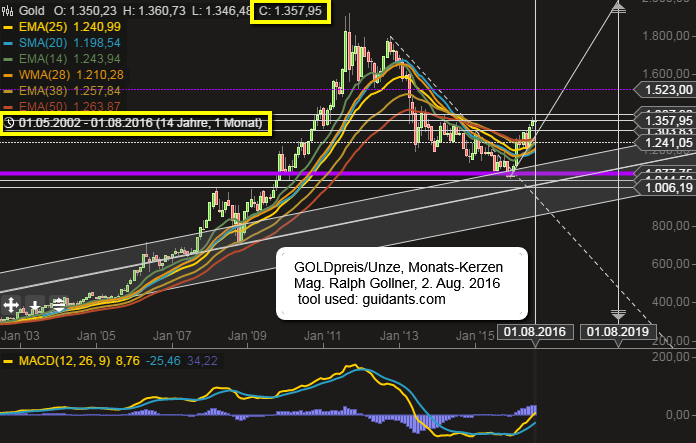
Gold (2003 - Aug. 2016)
Solange der Goldpreis über 1.300 USD, bzw. zumindest 1.241 USD notiert, bzw. gar weiter ansteigt, erscheint GOLD in Zeiten wie diesen (Unsicherheit durch Geopolitik, Notenbankpolitik) eine sinnvolle Ergänzung.
USDJPY (1972 - 3rd Aug. 2016)
For the most part, as goes the Yen over the past several years, so goes the carry trade - and risk-on assets. For example, the relationship between the Yen and equities has been very tight (on an inverse basis) over the recent years.
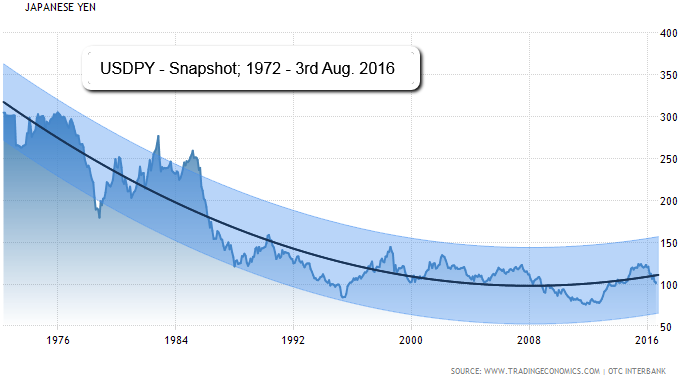
The relationship between ...
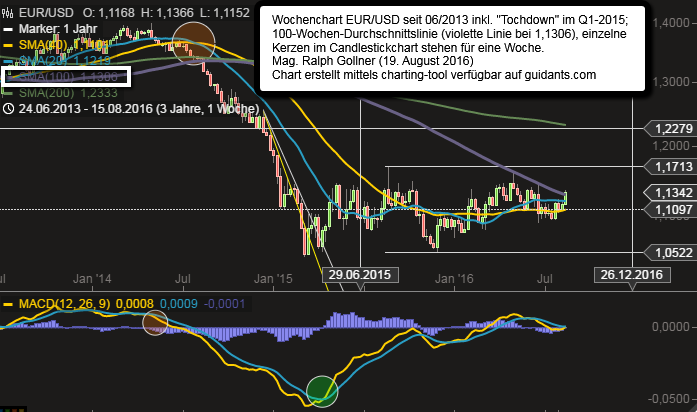
EUR/USD > 1,10 (Aug. 2016)
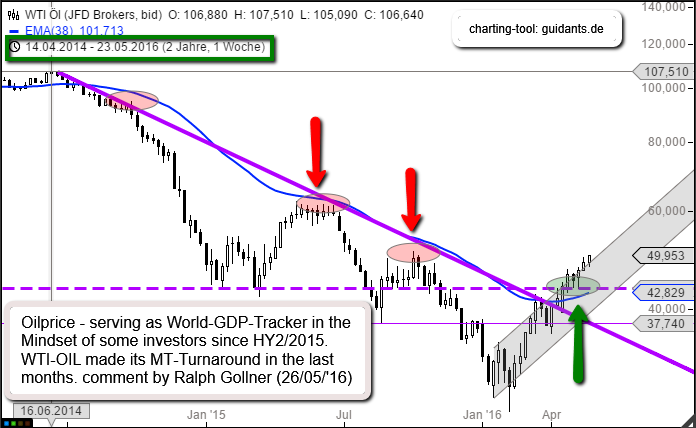
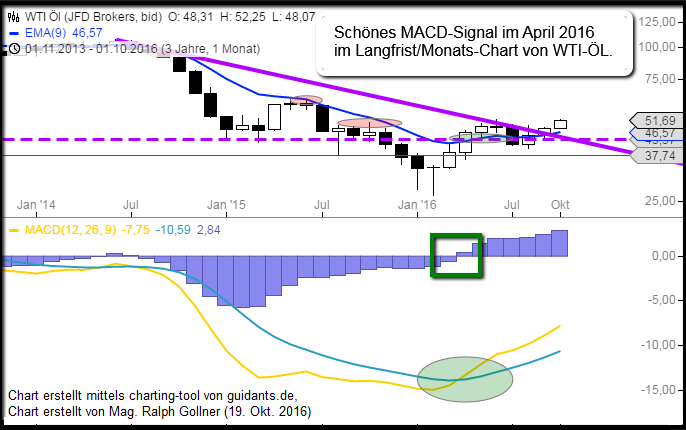
WTI-Öl (MACD-Signal im April 2016)
Monatschart
U.S. Dollar Index (DXY) above magic 100-level
The dollar rolled higher versus major rivals following upbeat data on durable goods orders and maintained gains after minutes of the Federal Reserve's November policy meeting...
...reinforced expectations for a December rate increase. The U.S. ...
10year US, 2year US (study on FX-impact)
Very theoretic, but good to think about it; most recent yield steepness observed (rising since several weeks already). For information purposes: Shaded areas indicate U.S. recessions in the last decades.
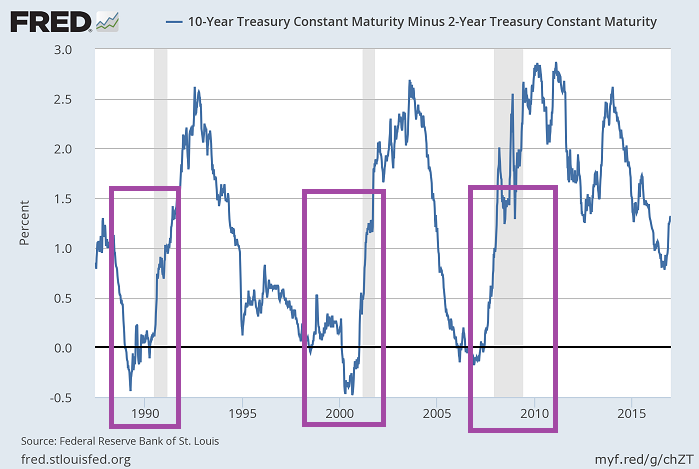
Important to know also, that from a rising ...
Cryptocurrencies (Bitcoin, etc.)
Just for Info; HIGH (!!) RISK; At approximately 10:20 a.m. Eastern time on Thursday (2nd March 2017), the price of Bitcoin climbed to USD 1,241.30 which was an all-time high for the digital currency. At the same time, the spot price of gold sat...
...
PPP (EUR/USD) - "fair" Value?
Die Frage stellt sich, ob und wie sich die aktuelle Inflationsdifferenz USA/Euroland auf den Kursverlauf des Euro/Dollar auswirken wird. Hier kommt die Realzinsdifferenz ins Spiel, die sowohl die Zins- als auch die Inflationsdifferenzberücksichtigt.
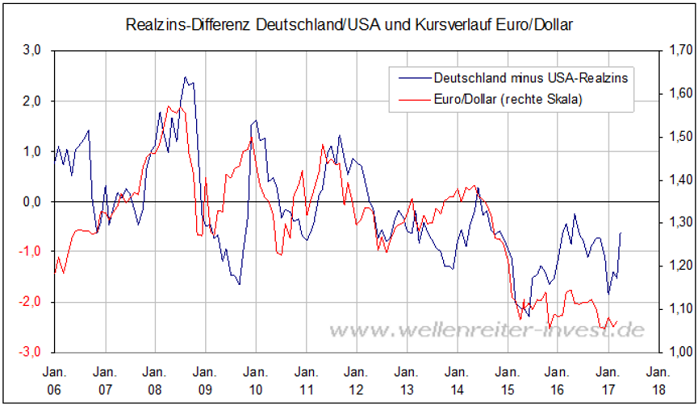
Gerechnet ...
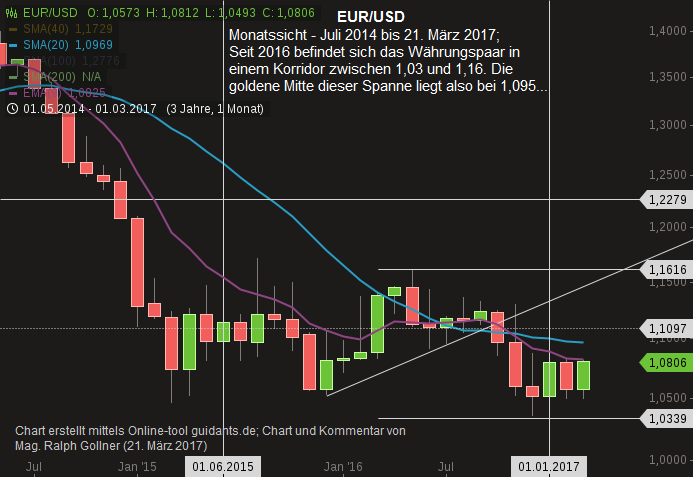
EUR/USD-Snapshot (März 2017)
Folgend einem Interviewduell zwischen den französischen Präsidentschaftskandidaten und den möglichen Gerüchten bzgl. eines möglichen (!) Auslaufens der expansiven EZB-Notenbankpolitik erstarkt der Euro wieder etwas...
Bitcoin versus Gold ("Global Market Cap")
The last time I mentioned Bitcoin on my site (6th March 2017), the price of Bitcoin climbed to USD 1,241. Some hours ago, Bitcoin passed the USD 2,000 level. Just for Info; HIGH (!!) RISK !
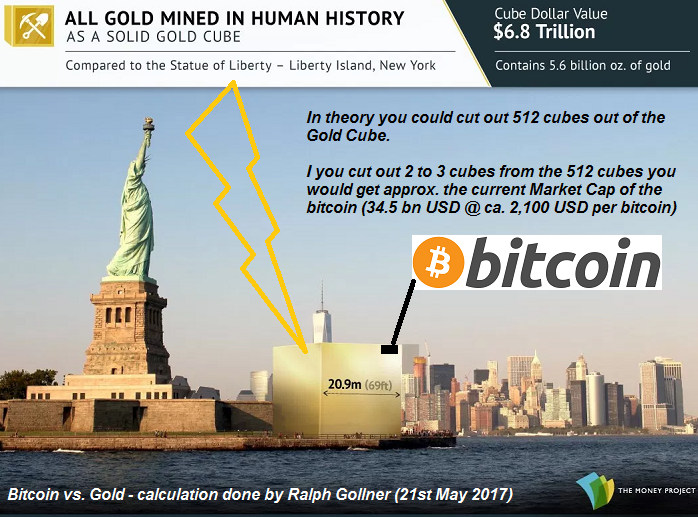
Disclaimer/Disclosure: Ralph Gollner hereby declares, that ...
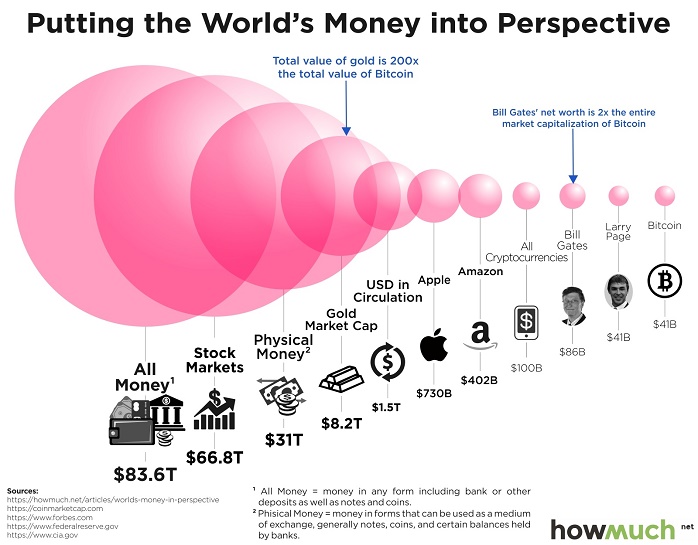
This chart should put the size of bitcoin in perspective
Intro: Bill Gates's net worth still beats bitcoin's entire market cap; HowMuch.net on 21st June 2017 put things into perspective and demonstrated that for all the buzz and excitement bitcoin has generated, it still has a long way to...
 ...
...
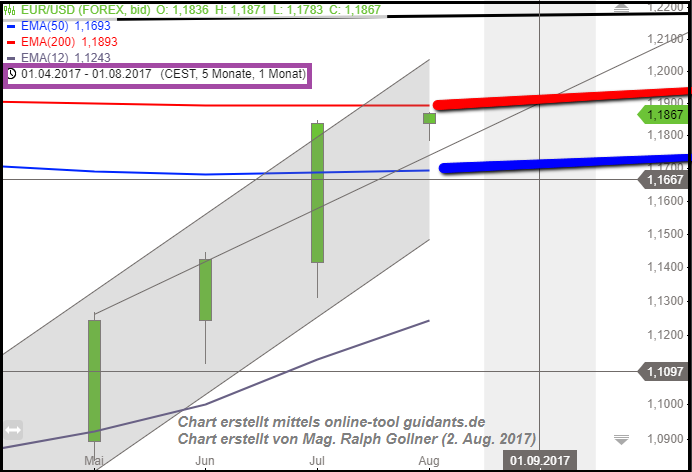
EUR/USD in der Nähe von 1,19
Folgend der sehr langfristigen Durchschnittslinie auf Monatsbasis (EMA 200) befindet sich nun der Euro versus USD in einer spannenden technischen Region ("extreme resistance" zw. 1,185 bis 1,215).
link:
It's all about the "Euro" ?
www.zerohedge.com/news/2017-08-02
Bitcoin (BTC/USD) und wie es nun weitergeht (?)
Reine Charbeschau ohne zusätzliche fundamentalen Begründungen, Erklärungen oder sonstigen Kommentaren. Hier nur der Chart, in welchem ja eigentlich alle zukünftigen Information "per heute" enthalten sein sollten:
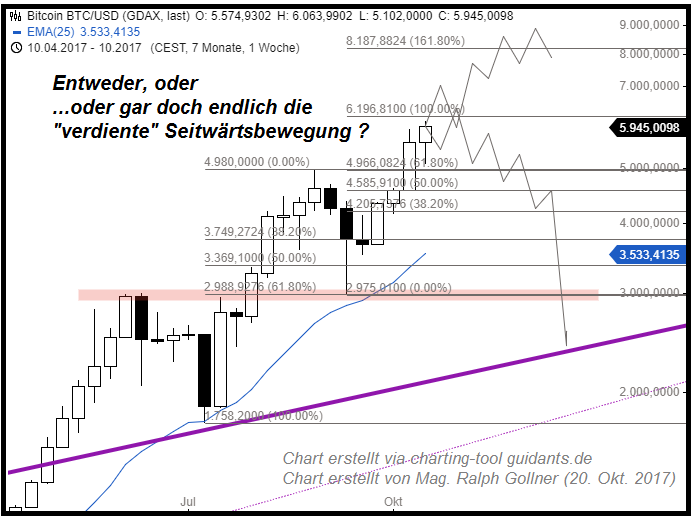
Ewas kryptische Sätze in ...
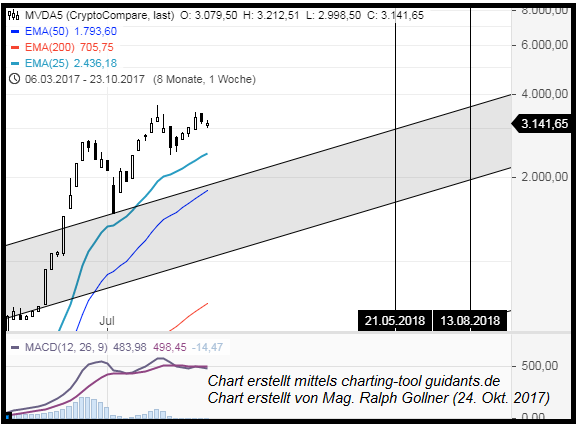
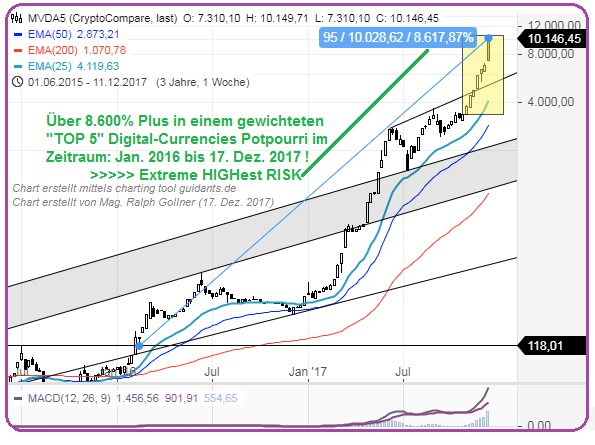
MVIS CryptoCompare Digital Assets 5 Index
The MVIS CryptoCompare Digital Assets 5 Index is a modified market cap-weighted index which tracks the performance of the 5 largest and most liquid digital assets. Most demanding size and liquidity screenings are applied to potential index...
...
EUR/USD
nach der Mario Draghi-Rede
Es tobt wohl ein "Fight" im EUR/USD zwischen der "fairen" Kaufkraftparität, welche (weit) über Kursen von 1,20 steht - einerseits und dem Druck auf den Euribor(s) andererseits. Aktuell herrscht wieder kurzfristig etwas...
...mehr Druck auf den Euro, nachdem ...
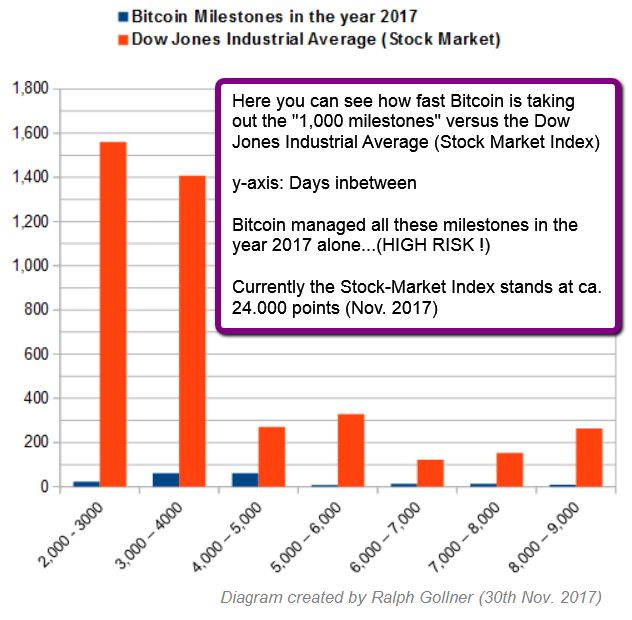
Milestones Bitcoin VERSUS Dow Jones Ind. Average
(Status: 30th Nov. 2017)
Here to wrap up, how many days it took the Dow Jones Industrial Average AND the Bitcoin (in the year 2017 alone) to reach another milestone (round numbers like 1k): The cryptocurrency was breaking through...
...
Bitcoin Market Value vs. some other sectors
Below the following table you will find the %-indications, what bitcoin would roughly equal as a percentage of the total value of the given sectors. The market sizes were taken from the "Money Project":
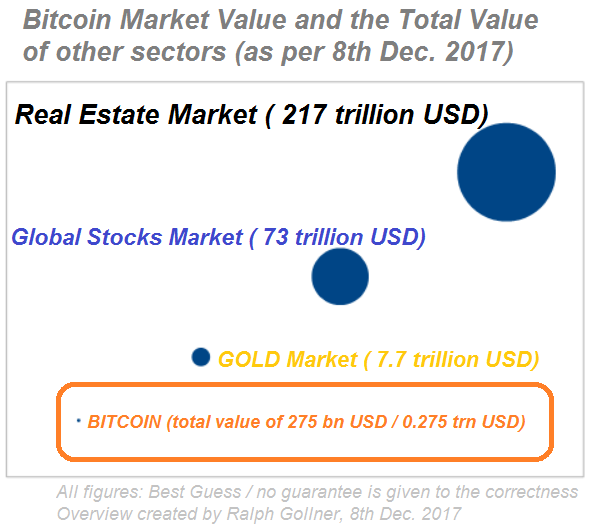
As mentioned here are the %-numbers:
♦ ...
MVIS CryptoCompare Digital Assets 5 Index
The MVIS CryptoCompare Digital Assets 5 Index is a modified market cap-weighted index which tracks the performance of the 5 largest and most liquid digital assets. Most demanding size and liquidity screenings are applied to potential index...
...
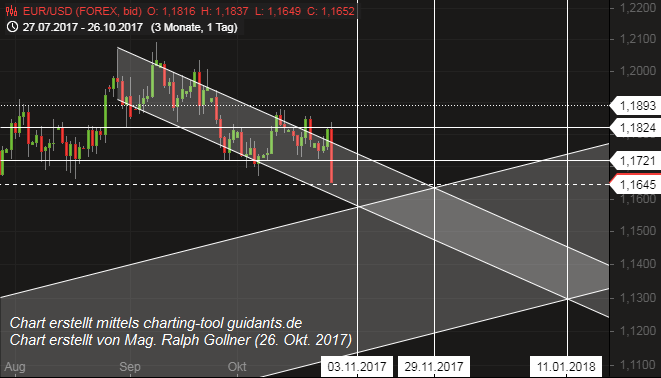
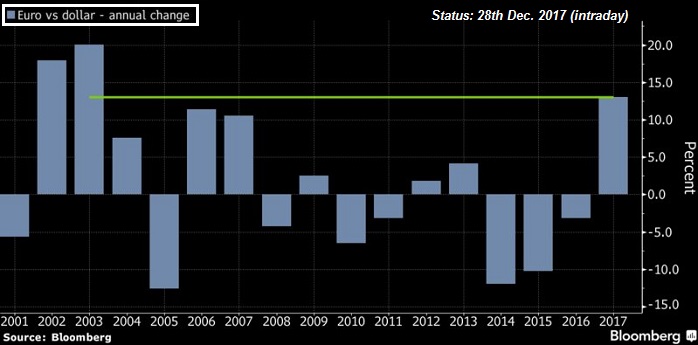
EUR/USD in the year 2017
The Bloomberg dollar index is on track for an annual decline of ca. 8.2%, though it has pared its drop from the more than 10% seen early in September. The dollar had surged to a 14-year high on 3rd January, including a 2017 low for EUR/USD at 1.0341. The Euro...
...
Bticoin (still > SMA200-daily)
"[Cryptocurrencies] are unlikely to disappear completely and could easily survive in varying forms and shapes among players who desire greater decentralization, peer-to-peer networks and anonymity, even as the latter is under threat," the report said, adding...
...
Bitcoin Mining Costs (potential floor?)
My calculations - derived from the sources given in the links below:
A Minimum Price for 1 Bitcoin (Intermediate time-frame) of ca. USD 7,500
(Status: 21st April 2018)
Searching for an intermediate floor for the Bitcoin-price may lead ones research to the ...
A study back-test for the cost of production proposed to >>>
value the digital currency bitcoin.
("Input costs")
Results from both conventional regression (and vector autoregression/VAR) models show that the marginal cost of production plays an important role in explaining bitcoin...
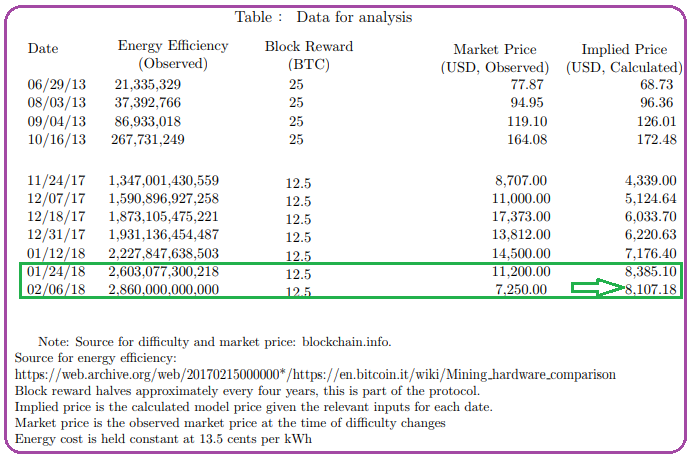
...


