Related Categories
Articles
Dow Jones (Election Year Seasonality)
According to the 2021 Dimensional Funds report, the market has been favorable overall in 20 of the 24 election years from 1928 to 2020, only showing negative returns four times. When you further examine the years between elections,...
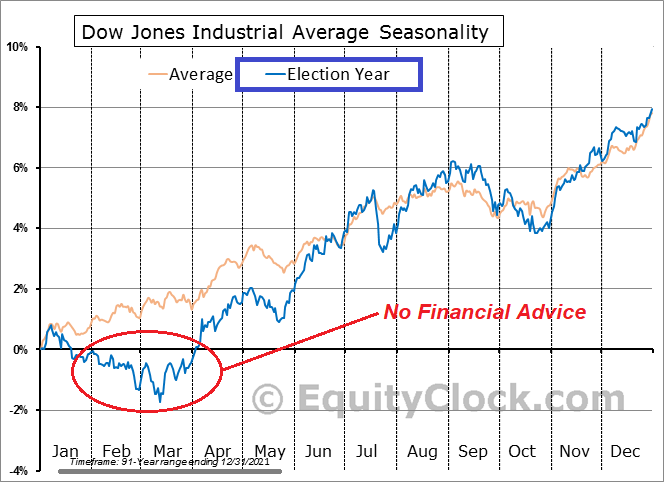
...however, it becomes apparent that year three of a president's term is usually the strongest year for the market, followed by year four.
This "Presidential Election Cycle Theory" was initially put forth by Yale Hirsch, the Stock Trader's Almanac creator. It was furthered by Pepperdine professor Marshall Nickles, ...
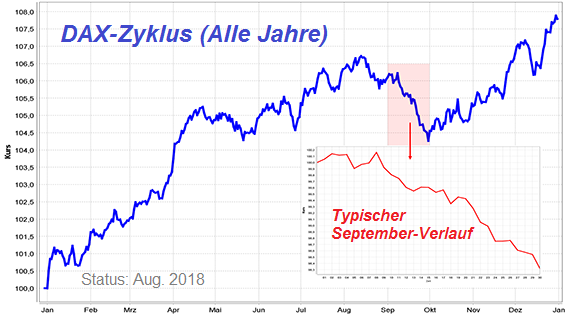
Seasonality in an U.S. Midterm-Election year
Let's remember, as bad as things may seem, statistics in on the side of investors. The average midterm year – like this one – is typically down as of 5th October. It finishes, however, up 6% on average. Further good...
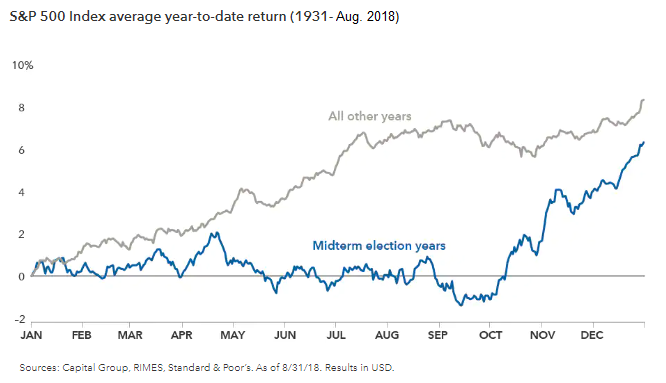
...prospects (Spoiler: statistics only): More often than not, markets bounce back strongly after U.S. elections are over! The silver lining for investors is that after these bouts of volatility, markets tend to rebound strongly in subsequent months. As we saw in the earlier chart, markets typically rally shortly after midterm ...
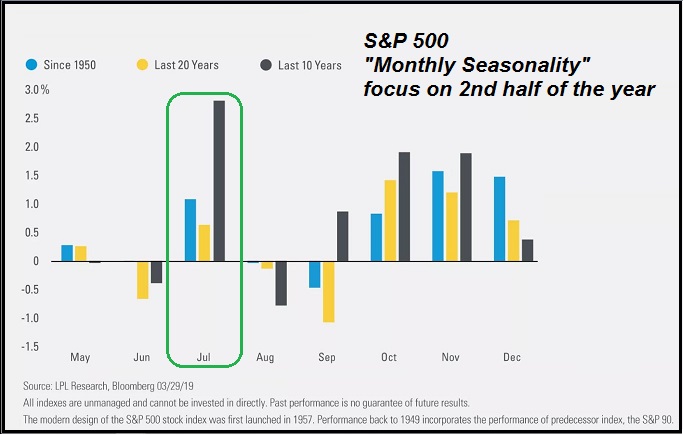
Bald beginnt das 2. Halbjahr
(Stichwort: Monat-Juli Saisonalität, bzw. 1. Monat im Quartal-Effekt)
Ich bin recht guter Dinge, wenn ich jedoch auch eher schon länger auf das Q4-2019 schiele. Aber dennoch: Ein starker Start in das Q3-2019 wäre doch auch passend zum heissen Sommer in Europa :-)
A propos Quartals-Start; Hier ein Posting aus historischer Sicht, wie stark das erste Monat eines Quartals denn so ist:
www.private-investment.at/posts/view/1238
LG Ralph
Saisonalität: Der Charme des 1. Monats im Quartal
Der 1. Monat eines Quartals liefert deutlich bessere Ergebnisse als der zweite und dritte Monat! Beim DAX wären aus einer Anfangsinvestition von 1 EURO - jeweils angelegt im 1. Monat eines...
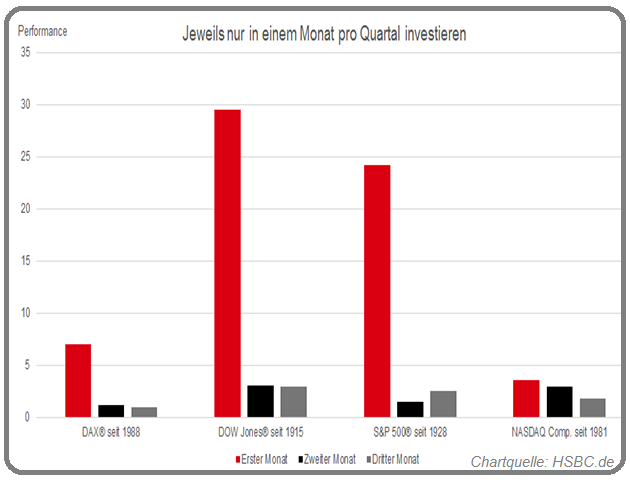
... jeden Quartals seit 1988 - 6,97 EURO geworden, während eine Investition immer nur im 2. Monat eines Quartals über die letzten 30 Jahre nur ein schmales Kursplus erzielt hätte und ein Engagement ausschließlich im dritten Monat des Quartals Anlegern sogar Verluste beschert hätte.
Kombinierte Strategie: 1. Monat + gesamtes Q4
Ein ...
Seasonality
April (U.S. Stock Markets)
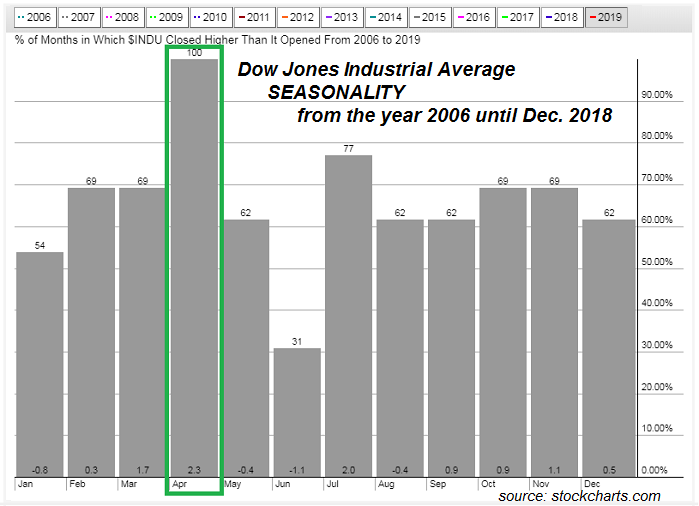
S&P 500 in the month of April-Statistics (period: 2013 - 2018)
----------------------------------------------------------------------------------
year 2018 +0.55%
2017 +1.11%
2016 +0.42%
2015 +0.86%
2014 +0.53%
2013 +1.81%
link (monthly stats for S&P 500 >> 1950 - 2018):
www.moneychimp.com/features/monthly
Tough Q4-2018
Well, after severe losses in Q4-2018, the US-Stock Markets face an interesting year 2019. Here one can see, how the US-Small Caps thrived in the year after such a downfall:
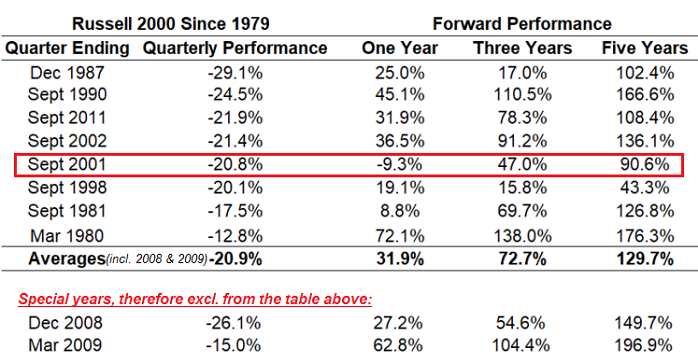
Everything seems possible!
(I marked the year 2001, since I still believe that the markets were extremely overvalued in the years 2000 and 2001)
link:
DAX-Seasonality (Intrayear-summer-DRAWDOWNS)
SELL IN MAY Phasen seit dem Jahr 2000 in %; Wie weit fällt der DAX von einem markanten Hoch, welches nach dem 1. Mai des jeweiligen Jahre ausgebildet wurde:
2000: -10 %
2001: -44 %
2002: -50 %
2003: -10 %
2004: -11 %
2005: -7,2 %
2006: -14 %
2007: -11 %
2008: -44 %
2009: -12 %
2010: -11 %
2011: -34 %
2012: -14 %
2013: -10 %
2014: -17 %
2015: -24 %
2016: -12 %
2017: -8,4 %
Alle Jahre wieder
(so war's auch im Jahr 2018 - ein "double-digt-drawdown-year")
Kursanomalien
("Hier eine Neue")
Hier eine Anomalie, welche wohl so an den Märkten noch nicht so stark verbreitet ist und Anlegern deshalb einen entsprechend hohen Nutzwert bringen könnte: In den so genannten Zwischenwahljahren (die "Halbzeitwahl" zwischen...
...den Präsidentschaftswahlen in USA hat dieses Mal am 6. November stattgefunden) sind die Kurse beim Dow Jones zwischen dem 1. November und dem 31. März des Folgejahres seit dem Jahr 1942 (!) nur ein einziges Mal (2002/03 mit Minus 4,8 %) gefallen.
In 95 Prozent aller Jahre brachten diese vier Monate eine positive Performance ...
S&P 500 (US-Midterm elections)
Status: 5./6. November 2018
In den kommenden Tagen und Wochen werden wir mitverfolgen können, ob die US-Midterm elections den US-Aktienmärkten den nötigen Schub für einen bullishen Verlauf folgend der klassischen Saisonalität geben...
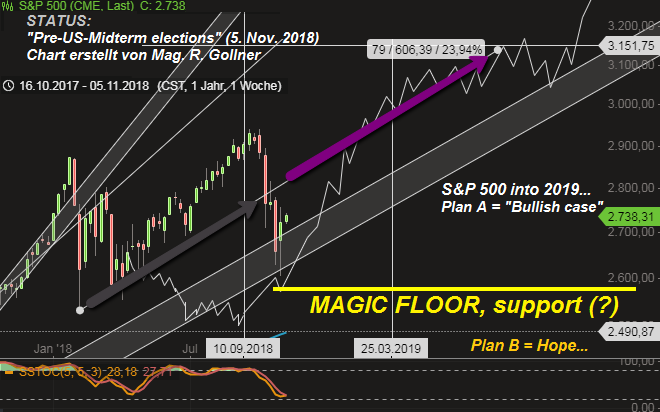
...können, oder es gar -doch- zu einem (nachhaltigen?) Bruch der (von mir) eingezeichneten Unterstützungszone um ca. 2.580 Punkten kommen sollte. Ein extrem bearishes Szenario erscheint MIR zwar extrem unwahrscheinlich per Status-Quo, dennoch sind die globalen Handelskrieg-Ängste nicht zu unterschätzen...
Sollte jedoch in ...
Seasonality
Final 2 months of the year
Since 1980, stocks tend to surge into the new year. The Dow and Nasdaq lead, each gaining about 3.4 % in the two-month stretch to close out the year. The S&P jumps about 3 percent, trading positively 74 % of the time. Among the top performing...
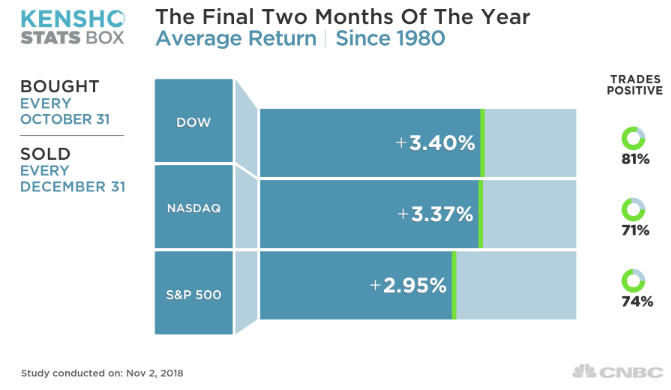
...sectors in the final two months of the year, the S&P Industrials sector leads, gaining 4.6 %, a positive trade 83 % of the time. The Materials and Consumer Discretionary sectors log gains of nearly 4 % each, trading positively better than 70 % of the time.
As a reminder >> Here you have the 31st ...
Seasonality Q4
(let's recheck the statistics for the ongoing/upcoming Q4-2018)
From a closing-level of ca. 2,900 points in the broad US-Stock Market Index S&P 500 a rise of ca. 4.75% until the end of the year would mean a closing-level > 3,000 points as per December-end 2018.
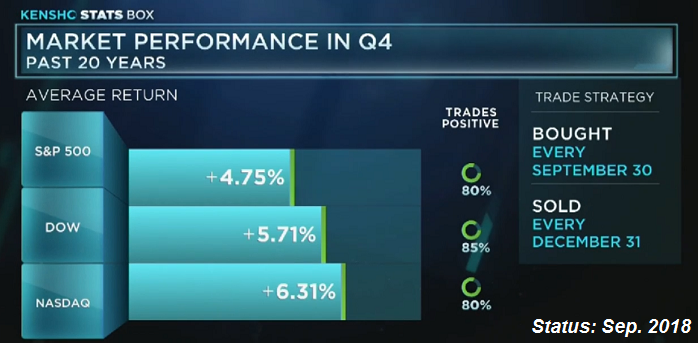
Let's see
Cheers Ralph
Upcoming October (2018)
German DAX & US-Stock Market
Historically speaking, the Dow Jones Industrial Average rises an average of 0.6% over the month of October, a move that makes October the seventh-best of the year. Over the past 67 years, October has been...

DAX-Statistik
Quelle Prime Quants GbR und Deutsche Bank (X-markets)
(www.prime-quants.de)
...positive for the blue-chip average 40 times and negative in 27 times. The S&P 500 typically rises 0.9% over the month, which is also good enough for seventh place, based on historical averages. The benchmark index has the same ratio of ...
Das saisonale Preisverhalten beim Dax
Unter einer saisonalen Preistendenz versteht man die Neigung eines Marktes, sich im jahreszeitlichen Rhythmus in eine konkrete Richtung zu bewegen. Vergleichbar mit den vier Jahreszeiten, wo z.B. Im Sommer mit erhöhten Temperaturen gerechnet...
...werden kann - die jedoch nicht in jedem Jahr so auftreten müssen - weist z.B. der Dax in bestimmten Monaten eine erhöhte Wahrscheinlichkeit für steigende und in wieder anderen Zeiträumen eine höhere Häufigkeit an fallenden Kursen auf. Am besten greifbar wird dieses Prinzip durch saisonale Charts. Diese ...
3rd Sep. until 30th November
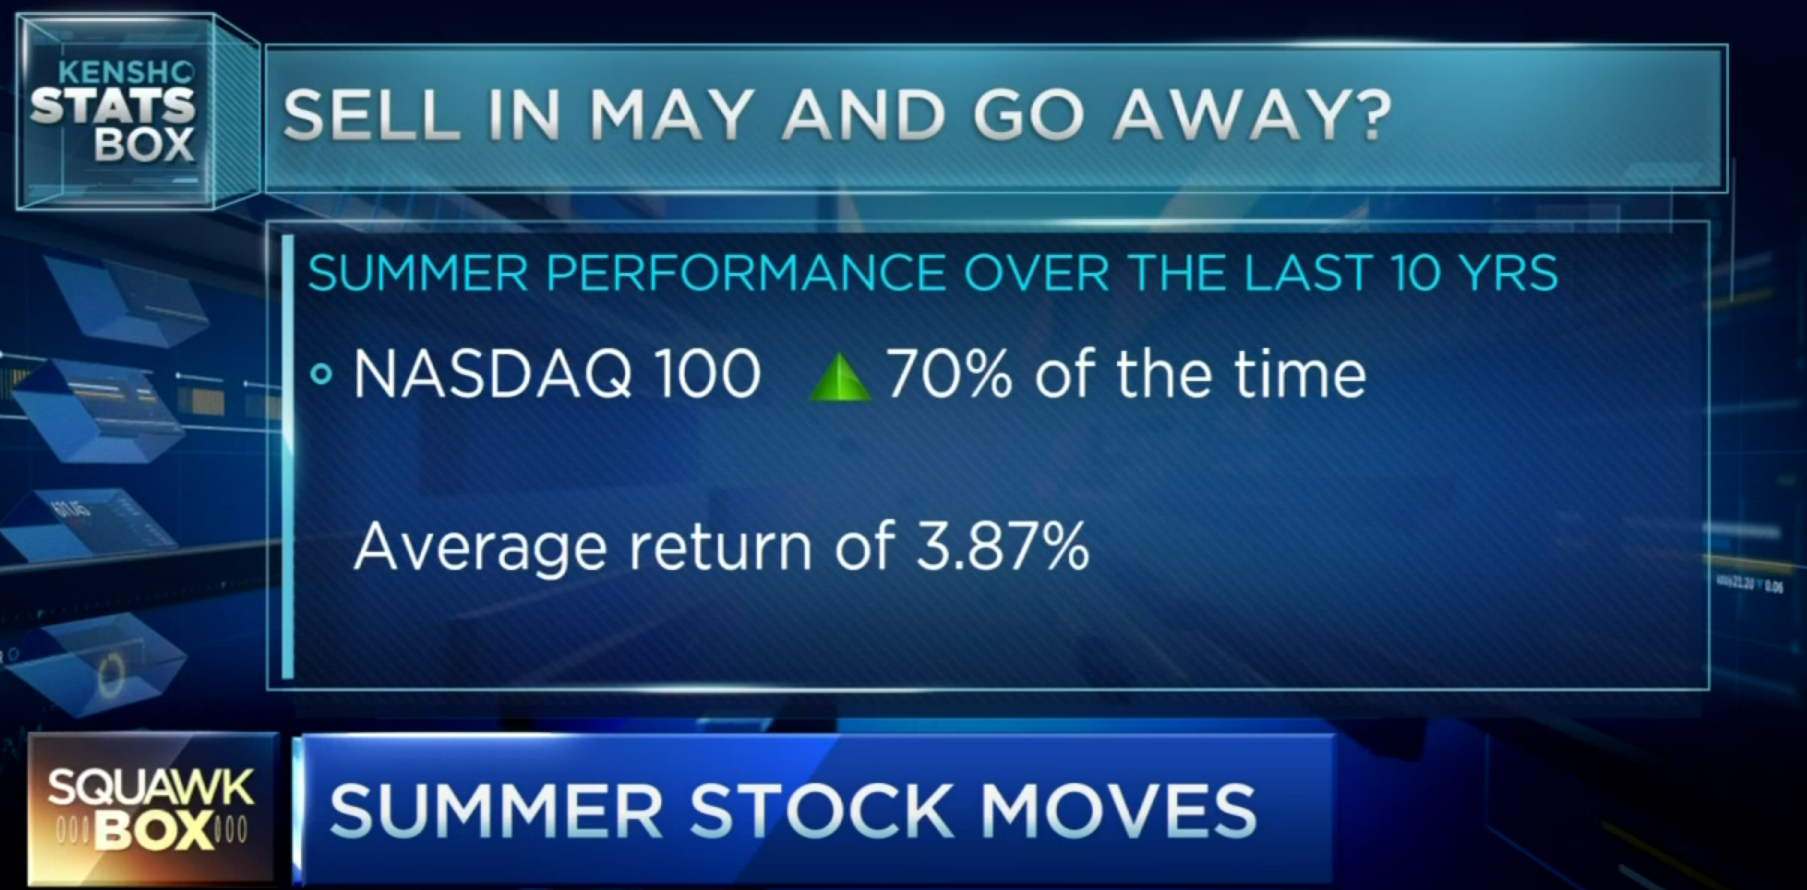
Over the past decade, the one-month period from Tuesday's close (21st Aug. 2018) has been among the strongest for equities, according to analysts at Bespoke Investment Group. "We're (now) entering a period of the calendar year that has...
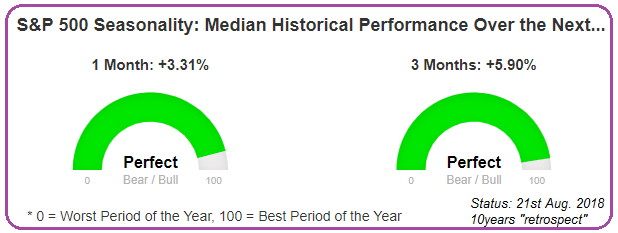
...been exceptionally bullish for the S&P 500 over the last 10 years. Over the next month (September), the S&P 500 has posted a median gain of 3.31%, which gets a 'perfect' rating when looking at all one-month periods of the year," said Justin Walters, co-founder of Bespoke, in a report.
The S&P 500's performance over ...
Midterm-elections
in Nov. 2018 (& the Stock-Market, Fin. Markets)
The eye-catching stats: in the 12 months following every midterm ballot since 1945, the S&P 500 has posted average returns of 15%. What a Midterm-election may mean for the markets: Even if the Democrats regain the House in...
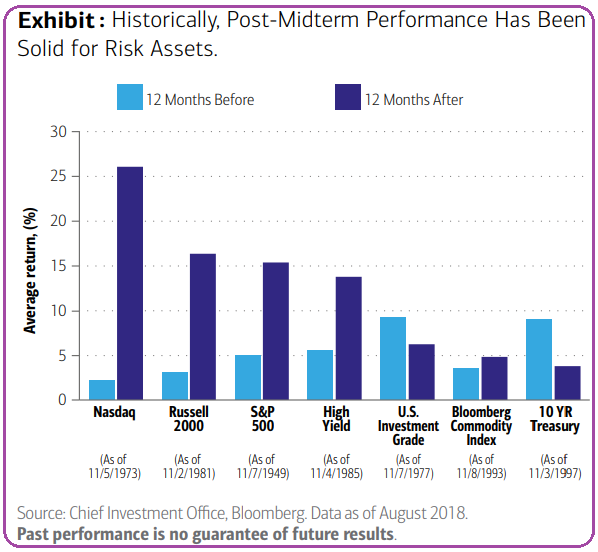
...November 2018, the implications (in the opinion of Merrill Lynch) for equities might hardly be dire. And supportive of the general post-midterm positive performance of U.S. equities is the following: solid U.S. economic growth, robust earnings into 2019, and the favorable effects of corporate tax ...
DAX im August (Historie bis 2017)
Nun im August hat einer der schwächsten Monate im Jahresverlauf begonnen. In den vergangenen zehn Jahren fiel die Monatsbilanz sechs Mal negativ aus. Eine vergleichbar schlechte Quote weist nur der Juni auf. Die Durchschnittsperformance...
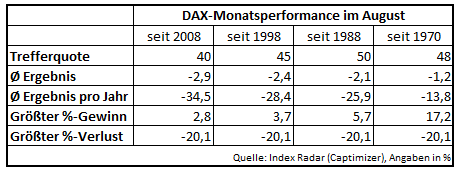
...liegt bei minus 2,9 %. Stärkere Gewinne sind eher selten: 2012 legte der DAX um gut zwei Prozent zu. Auch in der längerfristigen Historie entwickelte sich der DAX im Spätsommer meist enttäuschend, wie die Auswertung verdeutlicht.
Gerade mit Blick auf die Saisonalität könnte man als Anleger nun den Fokus auf ein ...
Magic Period Aug. 2018 - Year-End 2018
(?)
According to analysts at Bespoke Investment Group, if the market gains from April through July, stocks almost always finish out the year higher and despite Monday's weakness, it's looking good for the S&P 500 (today).
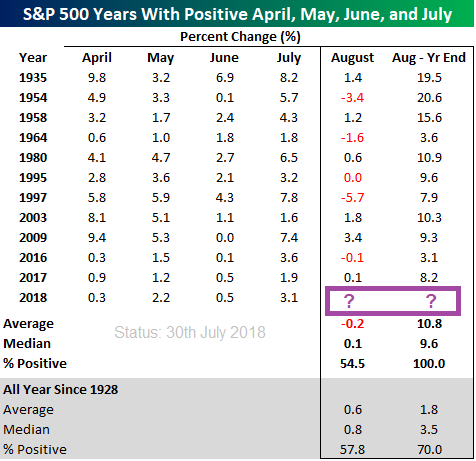
"[...] this will mark the fourth straight monthly gain for the S&P 500," said Paul Hickey, cofounder of Bespoke, in a note. Since 1928, there have been 12 years in which the market has risen from April to July and every time, stocks have finished higher at the end of the year, according to Bespoke.
link:
...
DAX & MDAX -Seasonality Strategie & Backtest
(1988 bis Mai 2018)
Das Phänomen der Jahresendrally gilt vor allem für die Börsenelite aus dem DAX. Wenn Anleger auch die Aspekte des "Size-effects" und der Seasonality zusammenführen, ergibt sich eine "saisonale MidCap_und_DAX-Strategie". Zu...
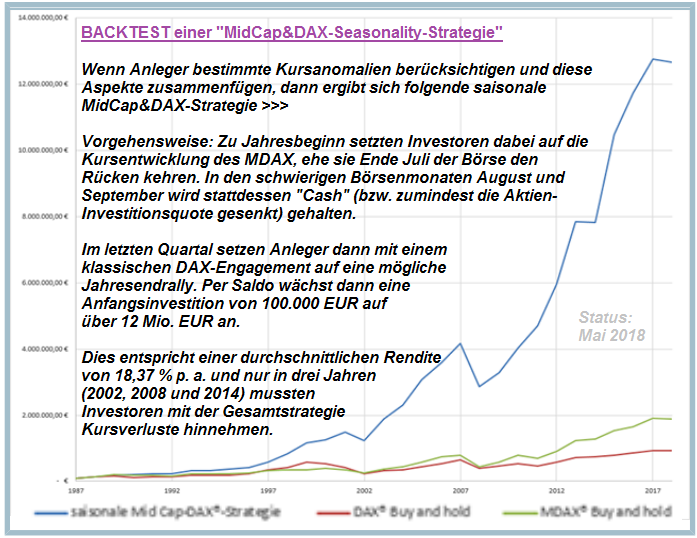
...Jahresbeginn setzten Investoren dabei auf die Kursentwicklung des MDAX, ehe sie Ende Juli der Börse den Rücken kehren.
In den schwierigen Börsenmonaten August und September wird stattdessen "Cash" gehalten. Im letzten Quartal setzen Anleger dann mit einem klassischen DAX-Engagement auf eine ...
DAX-Saisonalität
(Stay until July ?, somit: "No Sell in May & Go Away"?)
Die Saisonalität des deutschen Aktienmarktes seit 1974 ist ausgeprägt. Deutlich ist ein Haupttrend sichtbar, der Ende September begann, am 2. Mai ein erstes Hoch ausbildete und im Juli endete. Dazwischen war im Mittel...
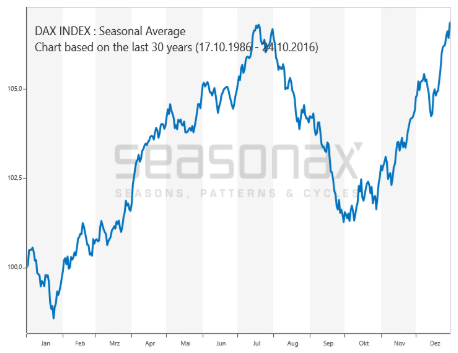
...kein Kursgewinn zu verzeichnen. Aber es gibt natürlich auch dazwischen Bewegungen. Schwach war der Markt z.B. vom 6. bis 21. Mai und von Ende Juli bis 30. September, dazwischen befand sich oft eine Aufwärtsbewegung. Man kennt sicher das bekannte "sell in May and go away".
Zusammengefaßt boten ...
"Have a Vision"
(Midterm-Election and S&P 500-Seasonality)
Nun, ich bin folgend der letzten Wochen etwas defensiver aufgestellt mit dem ECHT-Depot (Aktien-Investments hauptsächlich). Dies habe ich durch eine Reduktion der Aktienquote erreicht. Im folgenden Chart sieht man...
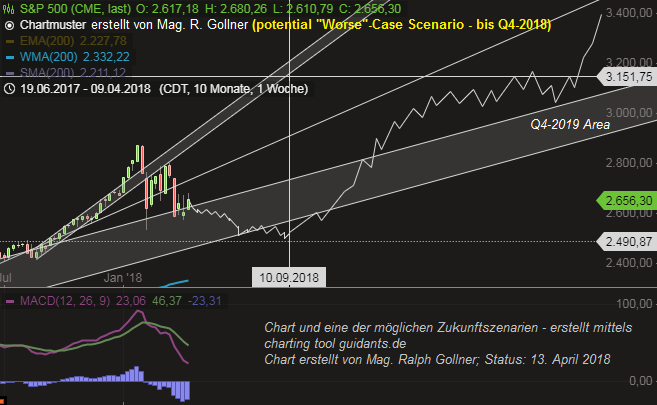
...(nur) EIN! mögliches "Worse Case-Scenario" im S&P 500 (möglicher Chartverlauf im Jahr 2018, danach 2019).
Dies heisst somit, dass bis Sep./Okt. 2018 "tote Hose" an den Märkten regieren würde. Nun ja, Geduld ist eine Tugend. Schaun mer mal, ob die Märkt andere Signale in den Sommermonaten geben...
link:
...
2nd Half of April (2018), "Dow-Seasonality"
Let's prepare ourselves (why not?) for a better 2nd half of the current month, being April 2018. I am -more precisely- speaking about the Dow Jones Ind. Average (& its 30 components). Please recheck its relative strength versus...
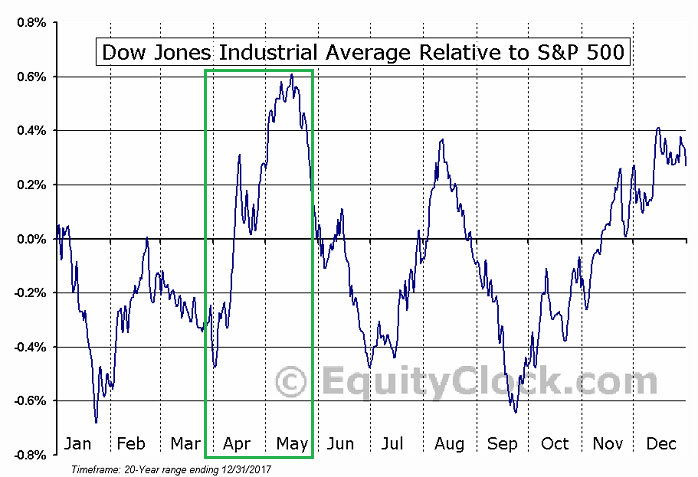
..."his broader" brother: the US-Stock Market Index S&P 500 (based on the historical 20-year range / Timeframe). Hint/The site: equityclock.com always had some nice "Seasonality-Charts", which i often rechecked during the last years.
Seasonal Anomaly
(TOM-Effect)
Lakonishok and Smidt (1988) coined the phrase the "turn-of-the-month effect" to describe the unusually high returns earned by DJIA equities over the four-day interval beginning with the last trading day of the month and ending three days later. Their...
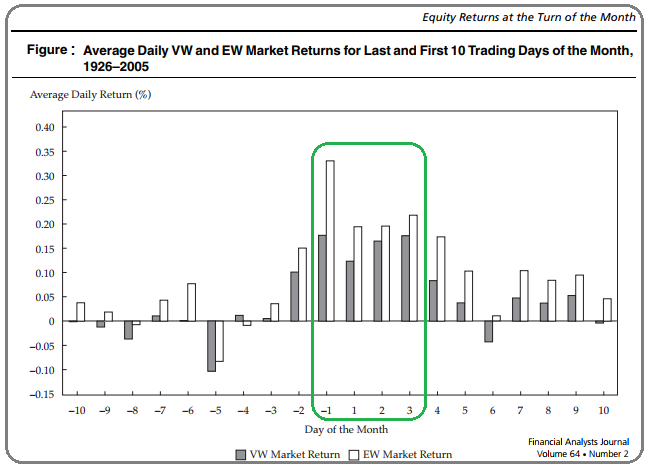
...study covered the years 1897–1986 (whereby DJIA stands for Dow Jones Industrial Average). John J. McConnell and Wei Xu found that the turn-of-the-month effect was pronounced in the two decades from 1987 - 2005 as well. So, when they combined their findings with those of Lakonishok and Smidt, the result ...
How important is January to the stock market?
(Stats-article from the year 2016)
Robert Sluymer, a technical analyst at RBC Capital Markets, noted that some consider the first trading day, week and month to be significant indicators of the year ahead. He looked back at the performance of...
...the Dow Jones Industrial Average and found that the first trading day has predicted the year's direction ca. 60 % of the time since the year 1901.
However, in the past 15 years, day one has been even more reliable, predicting the year's direction > 70% % of the time. The first week of trading ...
Kensho is back and helping us out !
Seasonality of European equities in Dec. (more specific: 2nd half of December). What to do from this Friday, 15th Dec. 2017 onwards? Historical check from the year 1990 onwards; Check out this short video:
Please look at this video...
Dec. 1st half versus Dec. 2nd half (Seasonality - History)
September (aaah)
For investors who are fearful of using market timing but still wish to maximize returns, the idea of sitting out September each year might sound like a strange idea to you, but might be a pretty good trade-off between simplicity and profit maximization. The two...
...ingredients that are required of investors are (A) a long-term perspective and (B) the willingness to act on 31st August and 30th September of every year, regardless of the headlines of the day and the present outlook for the market...
or maybe to just take off some salt from the plate (selling some ...
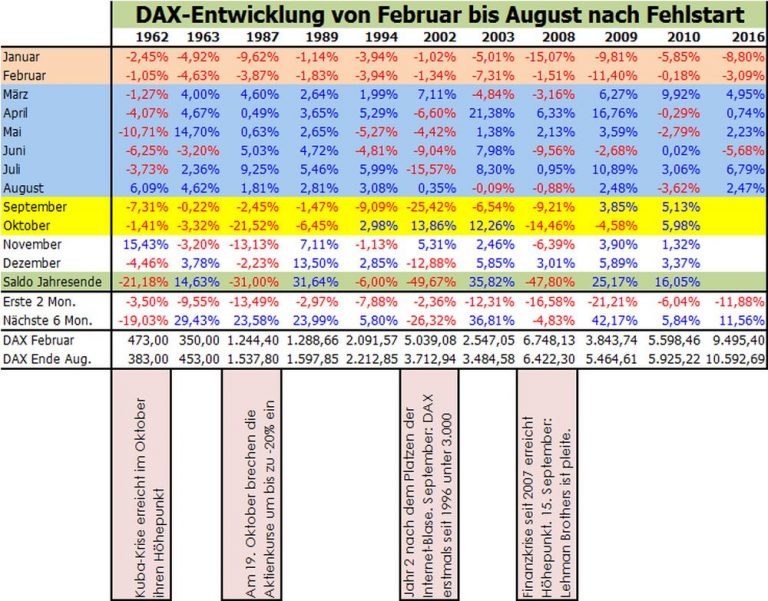
DAX-Saisonaltität (Backtest 1970 - 2017)
Mit dieser saisonalen Börsenstrategie konnte bisher (!) eine beachtliche Rendite erzielt werden und man konnte so auf einfache Art den DAX schlagen. Und das Beste, man musste dabei nur zwei Mal im Jahr handeln. Eine Rückrechnung...
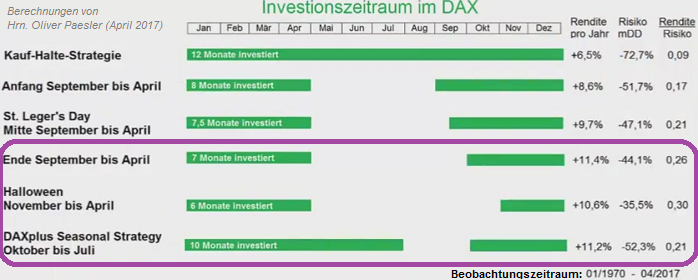
... dieser Anlagestrategie bis 1970 zeigt, dass damit im Durchschnit eine Rendite von mehr als 10% pro Jahr erzielt werden konnte. Der Benchmarkindex DAX kam im gleichen Zeitraum auf "nur" etwas mehr als 6% Rendite pro Jahr.
Wissenschaftlicher Zugang: Prof. Ben Jacobsen konnte in 2 umfangreichen Studien 2002 und ...
One phenomenon of note is the performance during
"Octobers of years ending in 7"
Is October of year 7 just one more statistical quirk, or is there information that investors need to protect themselves? Take a look at the results and judge...As you can see in the following Table,...
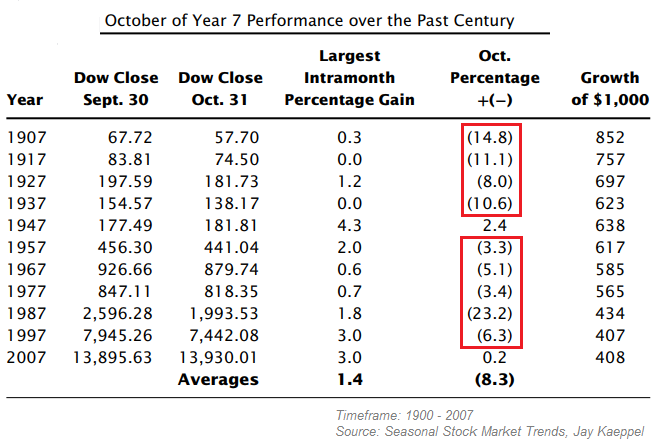
...the results for the Dow in Octobers of years ending in 7 have been pretty dismal.
It must be said that this is a fairly small sample size; likewise, most individuals will not be comfortable acting on some trend that occurs only once every decade and lasts just one month. Still, the numbers should be ...
Don't be fearful, but stay cautious !
July - December returns for years ending in 7 have been dismal; Dana Lyons, a partner with J. Lyons Fund Management, recently noted that the performance of the stock market in the second half of years ending in 7s has been among the most dismal:
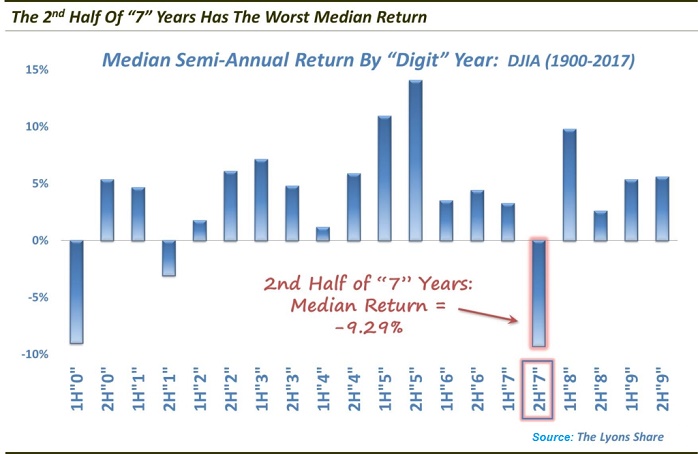
With the exception of 1927, it has literally been all downhill. In fact, "7" years have the worst July-December returns, reporting a median return of negative 9.29% (see diagram above).
"Other than the 1st half of year '0,' the median return of the 2nd half of year "7"s' is over 6% worse than any ...
Seasonality-Charts (DOW, DAX)
Der DAX, der DOW, aber auch Einzel-Aktien unterliegen häufig saisonalen Schwankungen. Es ist höchst interessant und lukrativ zu wissen, welche Monate für welche Aktie eher bessere Einstiegsmonate sind und welche man vielleicht meiden sollte.
 Quelle: www.stockstreet.de/saisonale-charts
Tatsächlich kann es sich gerade für mittelfristige Investments immer mal wieder lohnen einen Blick auf die saisonalen Muster zu werfen, um die besten Einstiegs- oder (wenn es doch sein muss?) Ausstiegsmonate zu definieren. Es klappt natürlich nicht jedes Mal, aber ab und zu ...
Sector Performance by Calendar Month
(focusing on April)
The Trading Calendar presents full-year and monthly cumulative performance profiles for the overall stock market (S&P 500 Index) based on its average daily behavior since 1950.
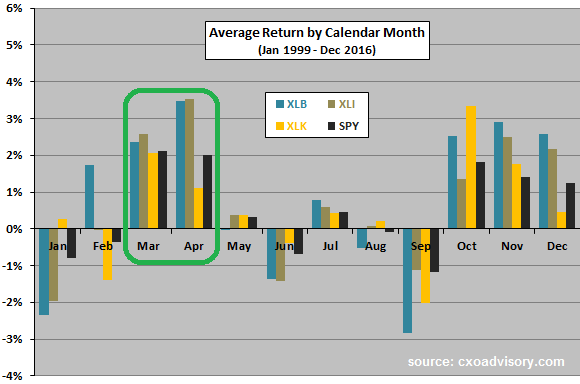
How much do the corresponding monthly behaviors of the various stock market sectors deviate from an overall market profile? To investigate, let's consider the 9 sectors defined by the Select Sector Standard & Poor's Depository Receipts (SPDR), all of which have trading data back to December 1998:
♦ Materials Select Sector SPDR (XLB)
♦ Energy Select Sector ...
Jan. & Feb. UP in the S&P 500
(Status: 7th March 2017)
This bullish stock signal has never been wrong - and the Signal is green since 1st March 2017! CFRA's Sam Stovall notes one interesting indicator got triggered by the last trading day of Feb. 2017.
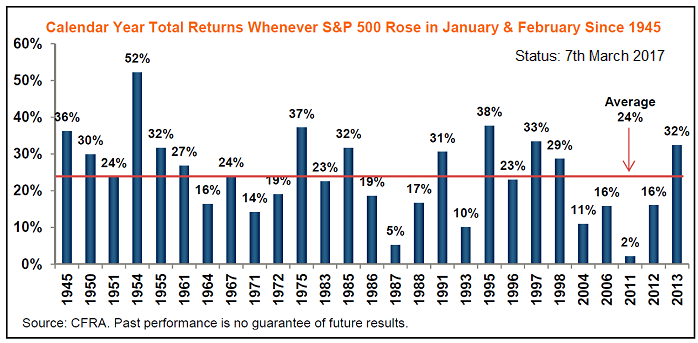
"If you need additional encouragement that a bear market is not just around the corner, history again offers some more virtual Valium," says Stovall. Since 1945, there have been 27 years when the S&P has achieved gains in January and February. The stock index then finished up for the year (on a total-return basis) in every one of those ...
Value stocks "often" sparkle
in a new president's first 100 days
On average, the so-called value premium is more than 10 times stronger in a president's first 100 days than the rest of the time. If you've ever wanted to tilt your portfolio toward value stocks, the next 75 days might be...
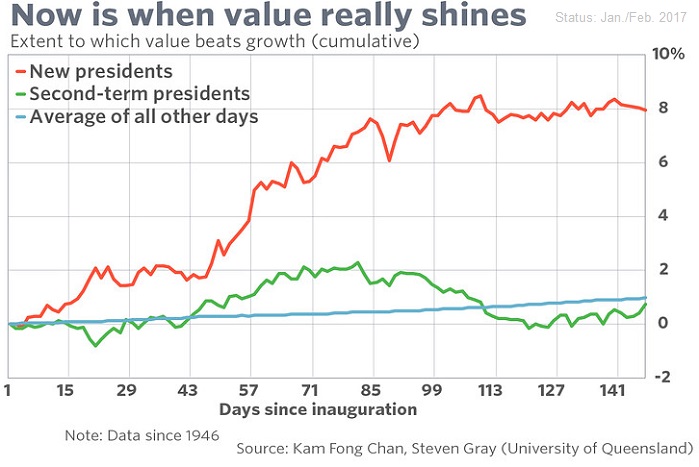
...your best chance over the next four - and maybe eight - years.
Value's historical advantage over growth is well known, of course. But a just-released study found this so-called value premium is especially strong in the first 100 days of a new president's term in office. In fact, the researchers ...
Dow Jones Ind. Average (Nov. - April - "nice" Season)
versus Mai - Oktober
Einmal pro Jahr erreicht der Aktienmarkt sein - aus statistischer Sicht - bevorzugtes Einstiegsfenster. Der folgende Chart zeigt den statistischen Durchschnittsverlauf des Dow Jones Index seit 1946:
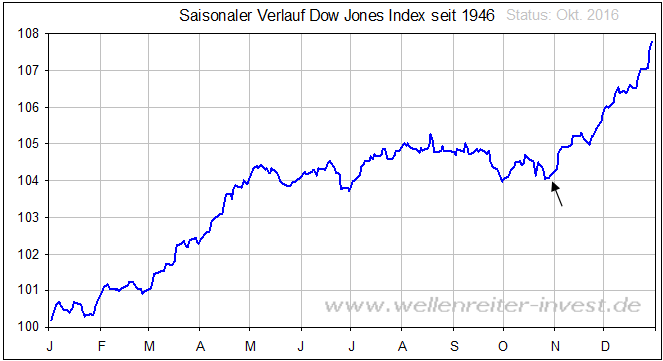
Das Fenster öffnet sich "relativ oft" Ende Oktober/ Anfang November. Es bietet sich an, das Börsenjahr in zwei Hälften zu teilen. Die Winterperiode umfasst die sechs Monate von November bis April, die Sommerperiode den Zeitraum von Mai bis Oktober. Die letztgenannte Periode endete vor ca. 3 Monaten, wir sind gerade ...
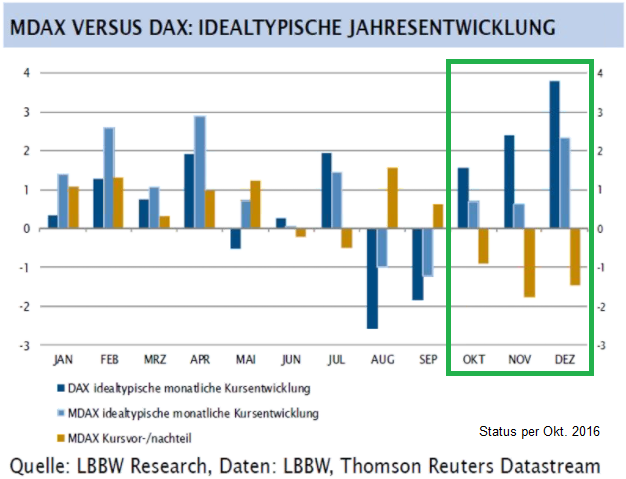
DAX-Aktien versus MDAX-Aktien(Q4-Fokus)
Es ist im folgenden Schaubild klar zu erkennen, dass es im Q4 beim DAX-Index zu einer Outperformance der DAX-Aktien gegenüber dem MDAX kommen kann. Theoretisch und aus der Historie heraus, die Praxis muss dies jedoch erst zeigen:
Last 12 weeks of the year (Dow Jones, S&P 500)
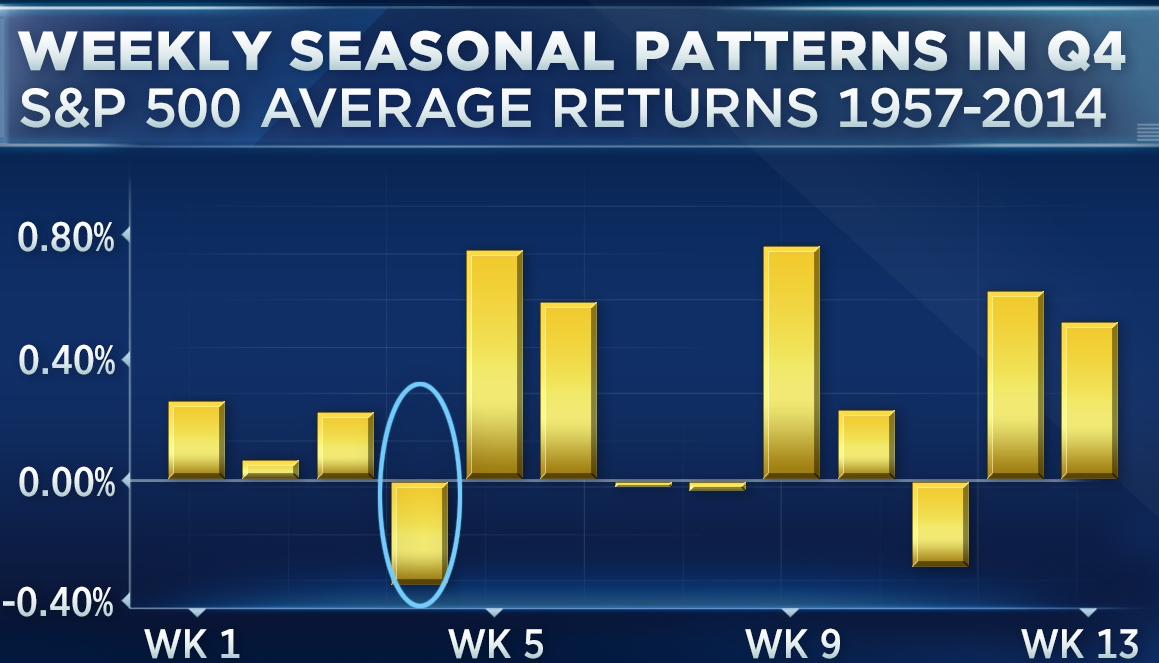
Using data going back to the creation of the S&P 500 in 1957, technical analyst John Kosar of Asbury Research found that "the fourth week of October, which is coming up soon, is seasonally the weakest of the entire fourth quarter."
 source: www.cnbc.com/2015/10/25/october-doldrums-history
Furthermore, the Dow Jones Industrial Average over the last 120 years has gained an average of 6.8% from its lowest October close through 31st December. On an annualized basis, that's equivalent to nearly 40%, or four times the stock market's long-term ...
DAX Sep. & Okt.
60er-Jahre bis inkl. 2015 (Historie)
Originalartikel von Andreas Sommer; Der gelernte Bankkaufmann war 10 Jahre Wertpapierberater bei einer Bank und hat über 30 Jahre Börsenerfahrung. In einer seiner Datenbanken wertet A. Sommer die Monats-Schlusskurse des...
...Performance-DAX seit dem Jahrgang 1960 aus. Falls man nun einwenden will, dass der deutsche Leitindex erst zum 1. Juli 1988 eingeführt wurde, dann hat man absolut Recht: Für die Zeit davor nutzt Herr Sommer zurückgerechnete Daten.
Gute Nachricht vorab: Der Oktober ist besser als sein Ruf. Tatsächlich ist er ...
US-election years (Pre-months)
If you want to get a feel for how the US presidential election will play out, then Byron Wien, Blackstone's vice chairman, has a suggestion: Look at stocks. Reminder: On the 8th Aug. 2016 the S&P 500 stood @ ca. 2,180 points.
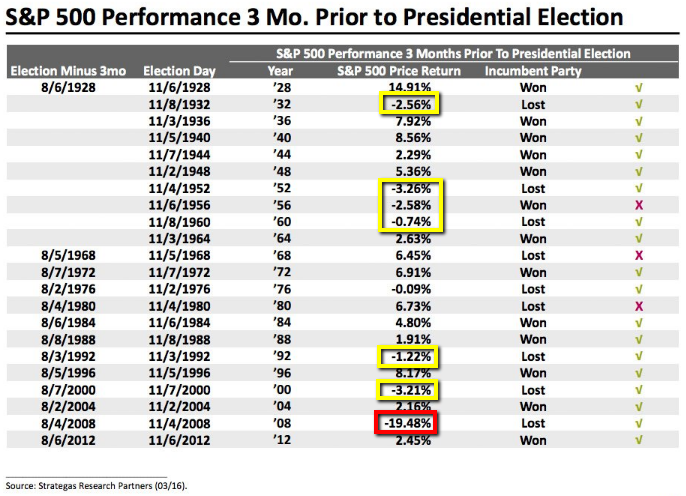
Since the 1920s, the incumbent party usually wins when market returns are high. But Wien cautioned that it doesn't work out perfectly, as shown in the blips in 1956, 1968, and 1980.
When the country prospers during an election year, then it is likely to favor the incumbent candidate, as voters feel good about current and future ...
US-Election year (June looks nicer than May...)
historical wrap-up
Does this year -being a presidential election year- provide reason to bet that the "sell-in-May-and-go-away" pattern will be any less pronounced than in other years. Maybe a historical wrap-up will help solving this question?
 source: http://www.marketwatch.com
The May-through-October period is the seasonally least favorable period for the stock market. During this period one year ago, for example, the S&P 500 SPX, fell 0.3%.. ut if this seasonal pattern is less pronounced in presidential election years, investors ...
April Seasonality (2016)
well, it doesn't really look that bad :-)
After a strong month of March (>6%), there may be reason to expect another solid return in April. Over the past 50 years, the S&P 500 Index has realized a gain in 70% of Aprils, averaging a return of 1.5%:

The average gain and the frequency of success is the strongest of the year. That being said, one must wonder that given the stellar return recorded in March 2016, will results for April be altered as stocks become exhausted. Since 1950, there have been 6 instances where March has recorded a gain greater than 5%.
...
March Seasonality (Dow Jones Ind. Average)
Especially over the last 20 years (also over 50 years), the month of March has been a quite good month for stock-investors (Status as per Dec. 2014):
 source: http://www.marketwatch.com
Seasonality/Integrated Oil & Gas Industry Seasonality
Basis is the timeframe/period 20 year-range ending 31st Dec. 2015;
Important, that the Oilprice, as underlying indicator for the industry, stays above - at least 27 USD - for a prolongued time...

Santa Claus Rally (one) definition
The stock market rallies at some point during December. This is the most commonly used definition, and the least precise...
above the daily updated EMA-"Melange" of the last quarter (Dow Jones Industrial Average)
And, without such precision, it is somehow pointless. (BUT) after all, the stock market rallies during every month of the year. One could just as easily talk about an Easter Bunny Rally — or talk about a Santa Claus Decline, since the stock market inevitably falls at some point near the end of the year.
Might this vague definition of the ...
Seasonality Dec./Q1-2016 possibilites (?)
Seasonality refers to particular time frames when stocks/sectors/indices are subjected to and influenced by recurring tendencies that produce patterns that are apparent in the investment valuation. (source: www.equityclock.com)
Tendencies can range from weather events (temperature in winter vs. summer, probability of inclement conditions, etc.) to calendar events (quarterly reporting expectations, announcements, etc.). The key is that the tendency is recurring and provides a sustainable probability of performing in a manner consistent to ...
Dow Jones Xmas-New Year Rally (History 1896 - 2014)

As one can see from the chart above, December’s average return is higher than that of many other months. Since 1896, when the Dow Jones Industrial Average was created, for example, the Dow has gained an average of 1.4% in December, in contrast to an average of 0.6% across all months.
But, given the wide variability in monthly returns, statisticians are unable at the 95% confidence level to conclude that this difference is statistically significant. It turns out, for example, that July’s average return is slightly higher than ...
Santa Claus Rally (different stock styles)
On average since 1927 (up 'till Dec. 2014), November and December have been consistently kind months to stocks across the board — growth and value, dividend payers and non-dividend stocks. (Michael Brush / marketwatch)

S&P 500 (last weeks of the year/Dec.)
Over the past 12 years, the S&P 500 has uniformly stayed positive for the final 30 trading days of the year, as Ryan Detrick, a Cincinnati-based portfolio manager and strategist, detailed:

source: http://ryandetrick.tumblr.com
Also, in 11 out of the 10 years BEFORE 2002 the December-Month was postive in the S&P 500, while the index was gaining 3% on average during these times (rececked via stockcharts.com)! As can be read out of these information, only 5 years out of the last 25 December-periods did not lead to gains in that month: 1996, 2002, ...

upfront / direct link: http://www.equityclock.com
Next week (starting 23rd Nov. 2015) is Thanksgiving in the US and investors should know about the equity market tendencies during this period. With less activity surrounding the Thanksgiving holiday on Thursday, stocks have a tendency of climbing. For the week itself, the S&P 500 index has gained 67.7% of the time since 1950, averaging a gain of 0.72%. The bulk of those gains come during the two days that bookend the holiday Thursday.
Therefore a possible strategy might be buying into late Tuesday OR intraday on Wednesday (25th Nov. ...
(bessere?) 6-Monatsperiode (histor. Auswertung US-Aktien)
Die Jahresendrally findet seit Jahrzehnten satt. Hier soll es nun nicht nur um die Jahresendrally von Oktober bis Jahresende gehen, sondern um den 6-Monatszeitraum von Oktober/November bis März/April. Diesem Halbjahr wird nachgesagt, dass es das beste des Jahres ist. Wer in diesen 6 Monaten investiert ist, kann im Prinzip von Mai bis Oktober Urlaub machen.
Die Outperformance des Winterhalbjahres gegenüber dem Sommerhalbjahr ist nicht nur von der Jahresendrally getrieben. Nach den besten 3 Monaten des Jahres folgt meist ein sehr ...
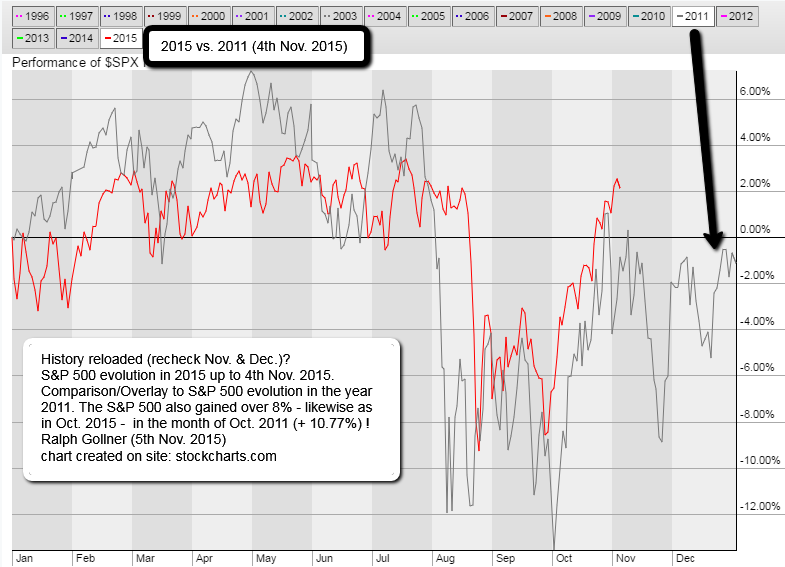
S&P 500 2011 versus 2015 (4th Nov. 2015)
Last 2 months of the year / SANTA RALLY
 Since the 31st Dec. 1945 the S&P 500 rallied in over 77% of the time in the final two months of the year to reach an average gain of 3% in that short period. These odds are pretty good i may say. To put this into perspective: If you were to invest every year in a 10year-period, you would gain in 7 years out of 10 (and in 3 years you may lose, if you only pick the index; If you are a good stock-picker you may be able to avoid a possible fall in the index/versus an ETF-Holder).
As one may know from the articles I have posted in the past one can even ...
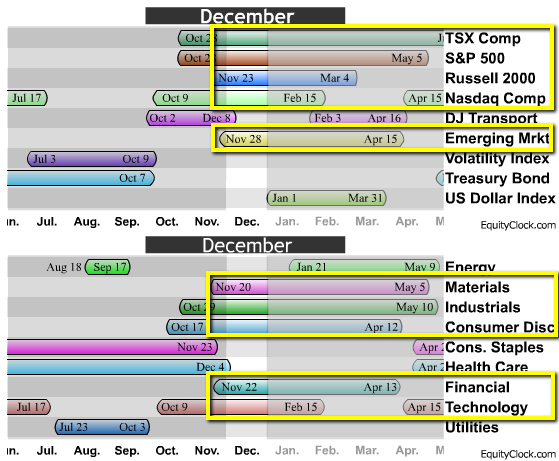
Sector Seasonalities (refocus Oct. up to June)
Following the history of seasonalities up to May 2012 (15yrs-history) each market-sector has its "season" to stay LONG (buy & hold stocks) or short ( = "better reduce ones exposure in equities of these sectors during that period").
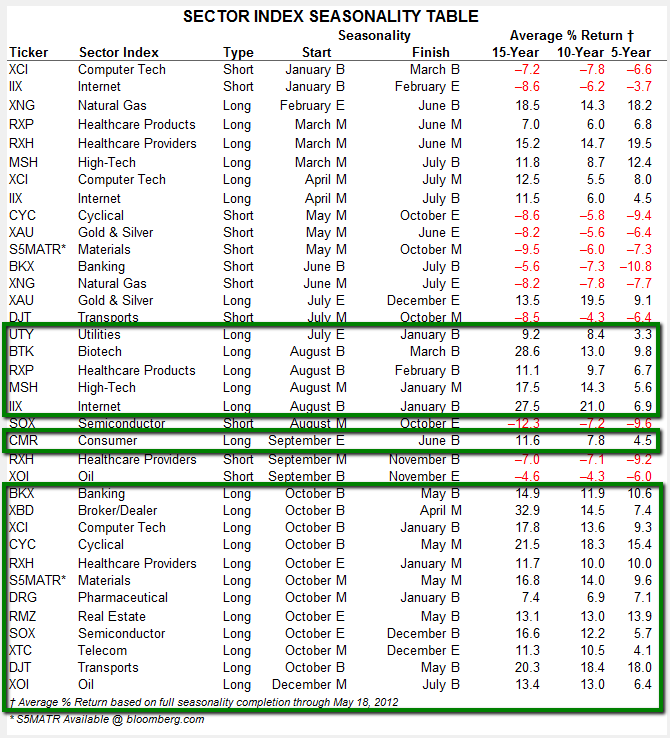
"History does not repeat itself but it may rhyme" (Mark Twain); data source: https://www.fidelity.com
My personal ranking from October up to June:
SOX Semiconductor (LONG up to December)
XTC Telecom (L up to December)
XCI Computer Tech (L up to January)
IIX Internet (L up to January)
RXH Healthcare Providers (L up to ...
The best six months for stocks is ?
Odds are that the Halloween Indicator may be especially good for the stock market this year. But before starting this article (source: marketwatch.com), take a look at the history in the S&P 500 period: 1950 up to the year 2010.

It is obvious, that there is "some kind" of seasonality here (in the graph/created by chartofthe day.com). Encouraging news, since the Halloween Indicator carries decent odds of success. But when the stock market is riding a wave of momentum into Halloween — as it most definitely is this year (up to Oct. 22nd, 2015 "the ...
What follows a negative performance in the month of August in the S&P 500?
The S&P 500, together with the global financial markets being in turmoil for around one week already (staus as per 27th Aug. 2015 after market close) may end the month of August with a negative performance.
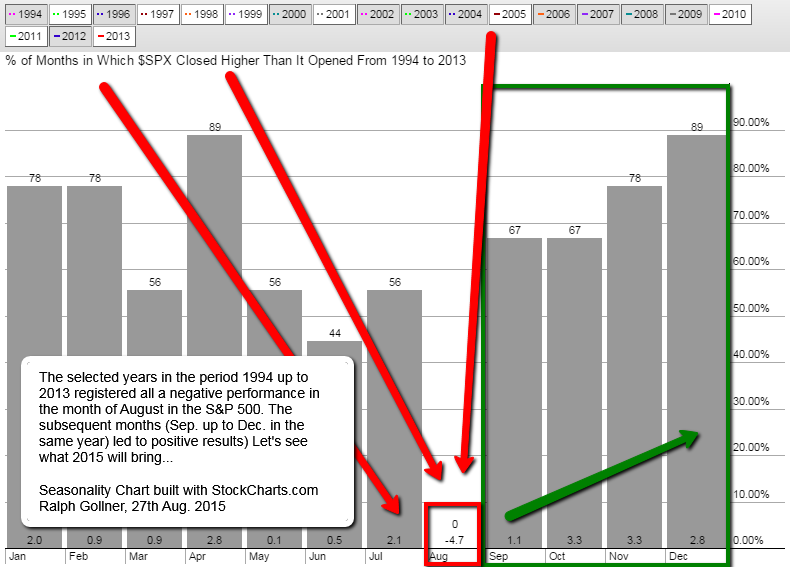
As the crucial months of September and October are upcoming one can also recheck the historical development of the remainder of the year following such a monthly drop in August as can be seen in the chart above.
The outlook may be not as negative as the current situation looks like in the SPX. The outlook ...
Selected sectors starting their positive season later in Sep. or Oct. (Seasonality calculated up to 2008)
source: http://www.seasonalcharts.de
Seasonality / July for 3 selected BIOTECH-stocks (as per 13th July 2015)
monthly gain(loss)/average Statistics as per equityclock.com (as per June 2015),
**20 years-history (only 4years-cycle years used: 1995, 1999, 2003, 2007, 2011), source: stockcharts.com
**xy% probability = % of months in which each stock closed higher than it opened from in the respective years
| Biotech Company |
Price* as per | **July | **August | **September | Average Gain & Gain Frequency in July according to equityclock.com history 1994 - 2014 |
|---|---|---|---|---|---|
| Celgene | 120.78 | +2.2% (40% prob.) |
+10.7% (100% ... |
Are Monthly Seasonals Real? (A Three Century Perspective)
statistics over the period 1693 to 2009
In 2012, Ben Jacobsen and Cherry Y. Zhang from Massey University (New Zealand) wrote very interesting articles. Compiling available data since 1693 in 108 countries, they claim that not only the discrepancy between Summer and Winter is as old as stock data, but that it can be observed worldwide and has increased in the last decades.
Over 300 years of UK stock returns reveal that well-known monthly seasonals are sample specific. For instance, the January effect only emerges around 1830, which ...
statistics over the period 2005 to 2014 (as per May 2015)
check out the whole video here on CNBC: http://video.cnbc.com
Related Articles
9er-Jahre
im Dow Jones Industrial Average
2019 ist ein sogenanntes Vorwahljahr in den USA, das sich innerhalb des 4jährigen US-Wahlzyklus durch einen dynamischen Start ins Jahr ausgezeichnet hat. Dafür bringt die zweite Jahreshälfte folgend historischer Saisonalität keine...
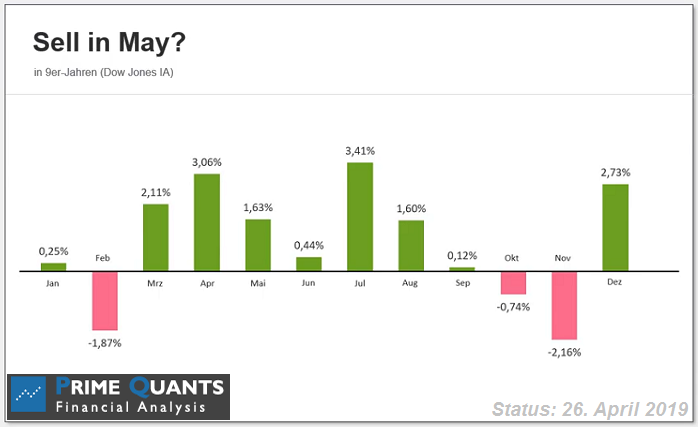
...weiteren ...
Oktober 2018
(vor der Tür)
In den letzten 20 Jahren gab es in 16 Jahren einen positiven Oktober für den deutschen Aktienmarkt (DAX). Schauen wir mal, was der Oktober 2018 so bereit hält..
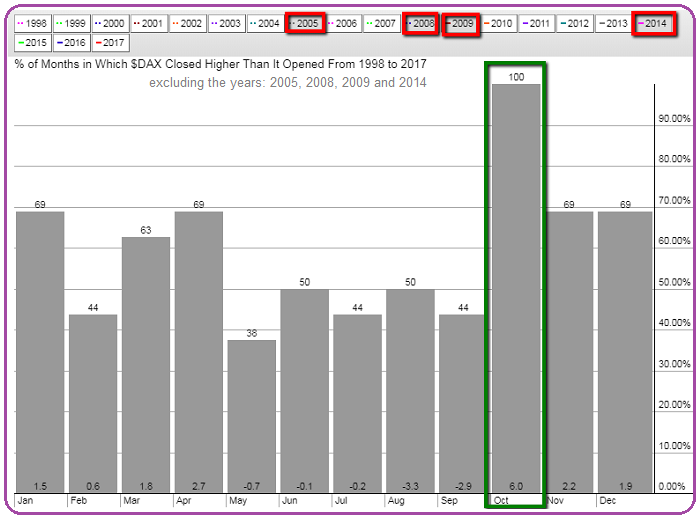
LG Ralph
"Neuer Leitspruch für DAXSeasonality Fans"
Sell end of May - BUT (only) >>> come back in October
Analyse ausgearbeitet, bzw. beschrieben: von Jörg Scherer (Leiter Technische Analyse bei HSBC Deutschland); Beim DAX hat das HSBC-Team rund um J. Scherer diese Börsenregel im Zeitraum vom...
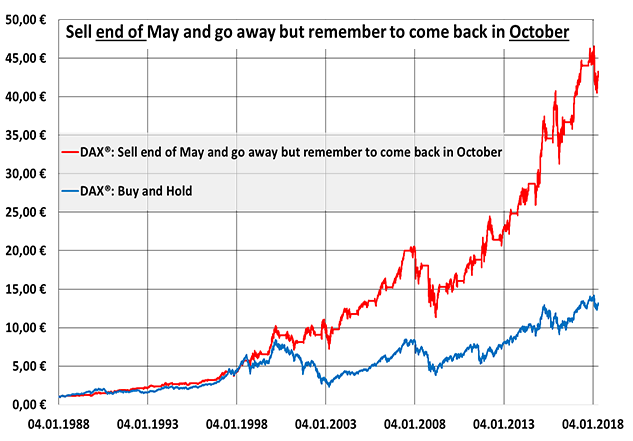
...
Jeremy Siegel and the TOM-effect
There is no one single day of every month that's always ideal for buying or selling. However, there is a tendency for stocks to rise at the turn of a month (TOM). This tendency is mostly related to periodic new money flows directed toward...
...mutual funds ...
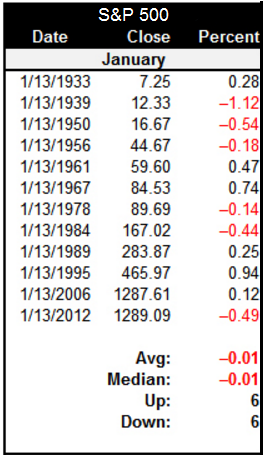
No Fear, my Dear...
A reason to be scared is exactly what stock-market investors don't need right now. It is Friday the 13th...In the following table you see the historical stock-market performance on Fridays if they fall on the 13th of a January. No need to hide!
source: ...
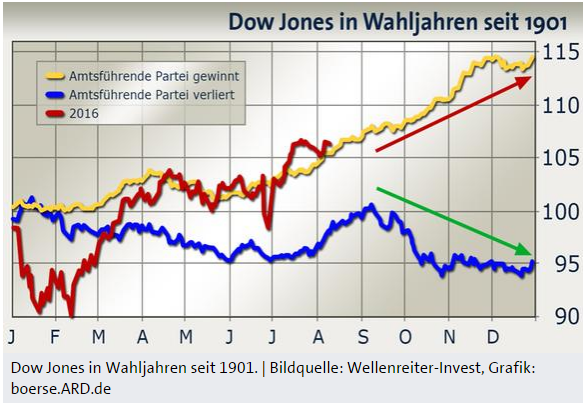
Dow Jones Industrial Average in Wahljahren seit 1901
In der Vergangenheit war es so, dass ein Wahlsieg der amtsführenden Partei - in diesem Fall der Demokratischen Partei - rückblickend meist einen positiven Aktienmarktverlauf induzierte, so der Börsen-Dienst "Wellenreiter-Invest":
Ganz ...
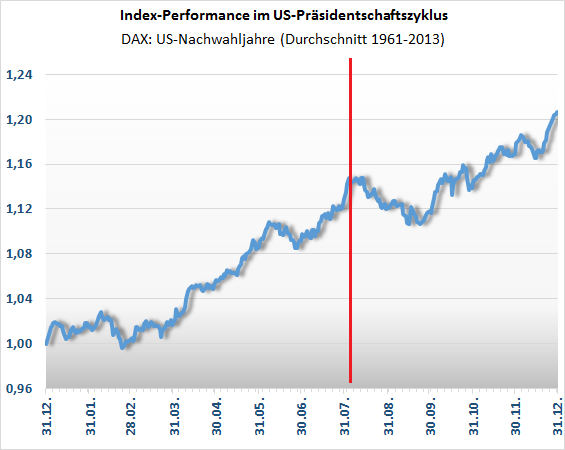
Election year (staying invested until -LATEST- 31st Dec. 2016)
Be careful: in 2008 this idea did not work ;-)
Price data for the S&P 500 Index was compiled and averaged on a weekly basis over the period from 1942 to 2003. Analyses of these data suggest that a potentially lucrative investment ...
Seasonality for 2016 ? (2011 vs. 2015...)
History does repeat itself, it rhymes more than expected...(at least 2015 versus 2011). In hindsight (Spoiler: Bias) the evolution looks reasonable in the light of the first FED-rate-hike after several years in Dec. 2015!
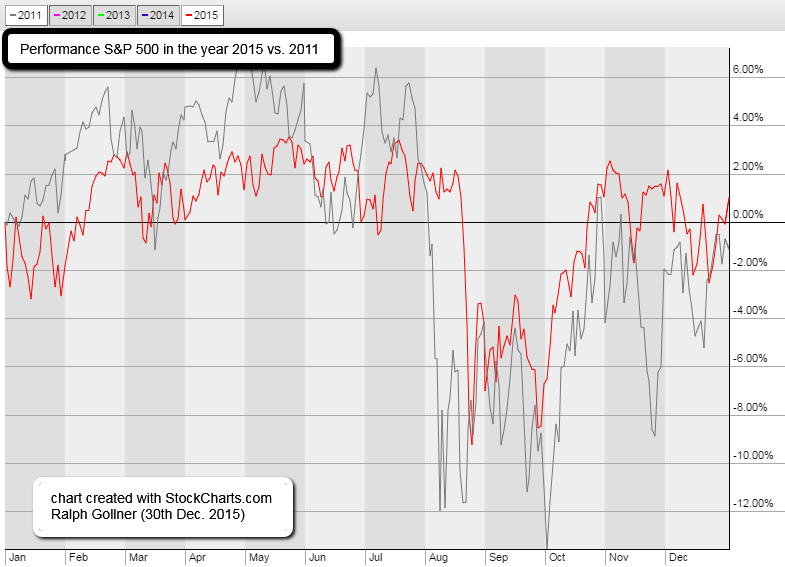
Let us hope, that 2016 ...
US-Election year (2016)
In presidential election years, the S&P 500 has posted an average return of 6.5% versus 7.9% in all years. Excluding 2008, presidential election years going back to 1960 have seen an average return of 9.1% versus 8.8% for all years.

Sam Stovall, U.S. equity ...
S&P 500 possibility for Year-End-Rally?
Before making any conclusion take a look @ the DJ-Transportation-Index and see (wait?), IF the daily Index-close will reach a level ABOVE the EMA-200 line in the chart below:
As the chart is updated automatically on a daily basis - one should stay ...
Jahresendrally im Dow Jones Industrial Average (Historie seit dem Jahr 1900)
Ausarbeitung von guidants.de / Clemens Schmale
http://www.godmode-trader.de/artikel/was-bringt-die-jahresendrally,4359853
Die Jahresendrally gibt es fast schon so lange wie es den Dow Jones Industrial Average gibt. ...
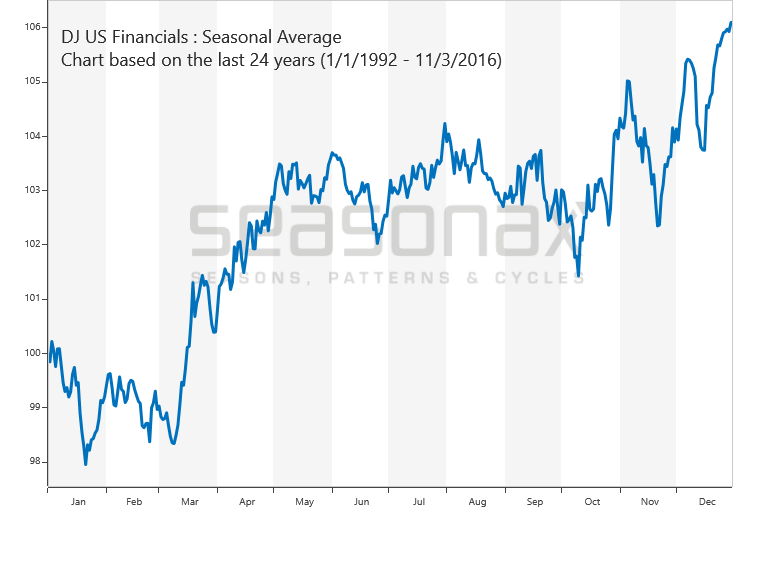
Banks (could) profit from Steepening Yield Curve
While short-term interest rates are set by the Federal Reserve, longer-term rates are determined by the market. A rise in longer-term yields is generally an indication of an improving economy.
Lower economic growth expectations generally result ...
Biotechnology Seasonality (always watch out for Mid-June and July !)


Finding interesting patterns in the Indian Stock market performance (rechecking the last years)
Please recheck the yearly performance-evolution in the Indian Stock Market. There seems to be an interesting pattern leading to a better performance in the 2nd half of the year - starting around ...
For every sector there is a season: Identifying opportune times to trade stock market sectors
Markets, sectors, and even individual stocks have shown a tendency to post annual highs and lows around the same time every year. This cycle is known as market seasonality. Like crops, stock sectors ...
DOW Jones Ind. Average - Jahrzehnte
last decade (updated weekly)
80er, 90er-Jahre
die 60er, 70er
die 40er, 50er
die 20er, 30er
die ersten 20 Jahre des letzten Jahrhunderts

Selten, aber möglich: Aktien könnten Dekade im Minus beenden (Artikel vom 10. Oktober 2005)
Mehr ...
Post vom 2. April 2007
In the section 4-Year Election Cycles SeasonalCharts.com examined a four-year instead of the typical one-year cycle. The chart shows the average course of prices over a total four-year period.
The four-year cycle is determined by the US presidential election. 2004 was an ...


