Related Categories
Related Articles
Articles
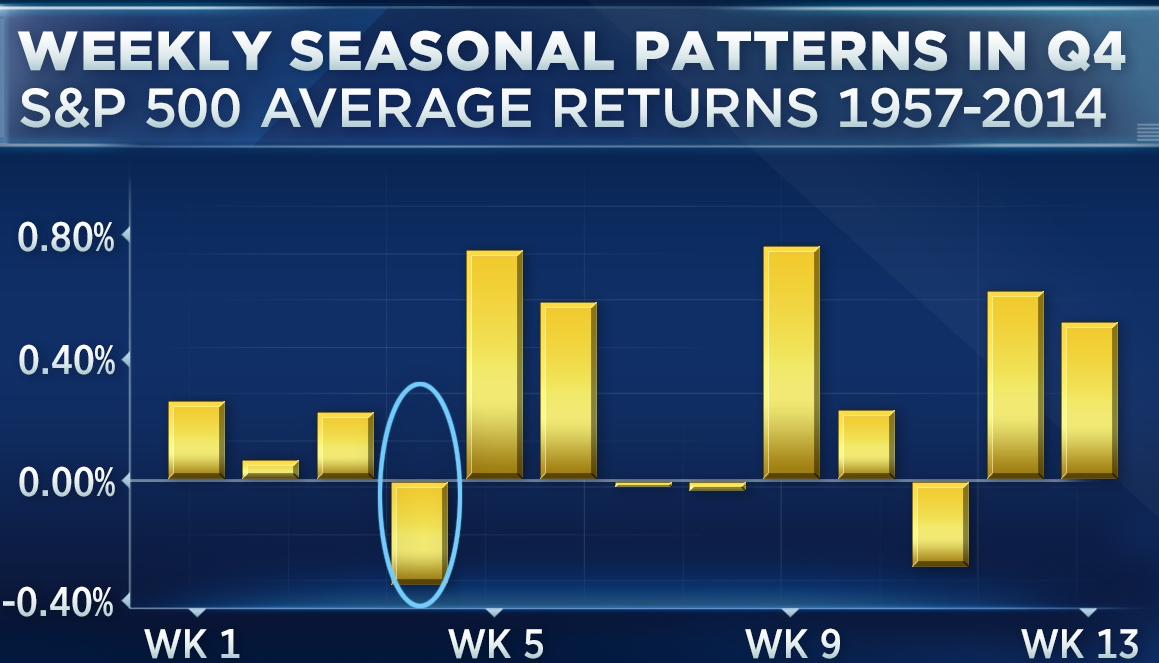
Last 12 weeks of the year (Dow Jones, S&P 500)
Using data going back to the creation of the S&P 500 in 1957, technical analyst John Kosar of Asbury Research found that "the fourth week of October, which is coming up soon, is seasonally the weakest of the entire fourth quarter."
 source: www.cnbc.com/2015/10/25/october-doldrums-history
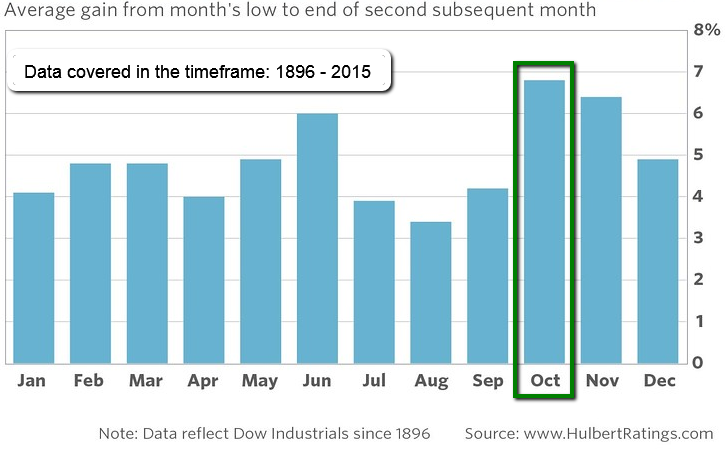
Furthermore, the Dow Jones Industrial Average over the last 120 years has gained an average of 6.8% from its lowest October close through 31st December. On an annualized basis, that's equivalent to nearly 40%, or four times the stock market's long-term average.
To be sure, the exact day of October's low is different every year, and is only known after the fact. It might be, for example, that the low for the current October has already been registered; but it's also possible that it is yet to come. So it’s unrealistic to assume that investors could have captured the entire amount of the 6.8% average return from October's low.
If one still wants to make a "best guess", one may assume a sharp correction in the last week of October down to a Dow Jones-level of ca. 17,200 points followed then by a possible 6.8%-rally up to 18,400 as per New Years' eve (just a guess anyway...).
There is something unique about October's low. This became evident when Mark Hulbert contrasted the gain from October's low to the comparable gain for each other month of the calendar. As you can see from the following chart, the gain following October’s low is the largest of all 12 months.
One has to bear in mind that all these statistics are based on historical averages, and there is no guarantee that any weakness will be followed by a strong year-end rally. Still, it's worth remembering that October weakness is not, in and of itself, something to be afraid of.
link to original article www.marketwatch.com


