Related Categories
Related Articles
Articles
Seasonality in an U.S. Midterm-Election year
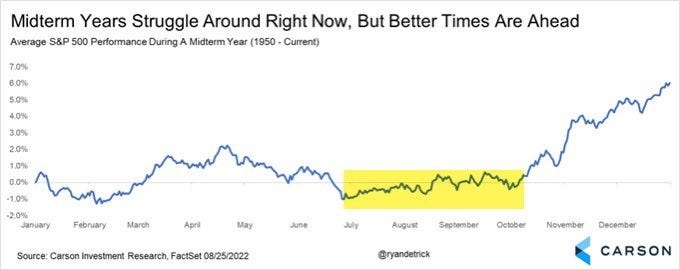
Let's remember, as bad as things may seem, statistics in on the side of investors. The average midterm year – like this one – is typically down as of 5th October. It finishes, however, up 6% on average. Further good...
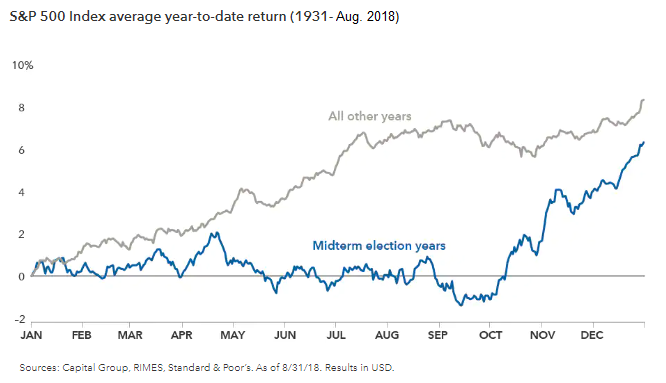
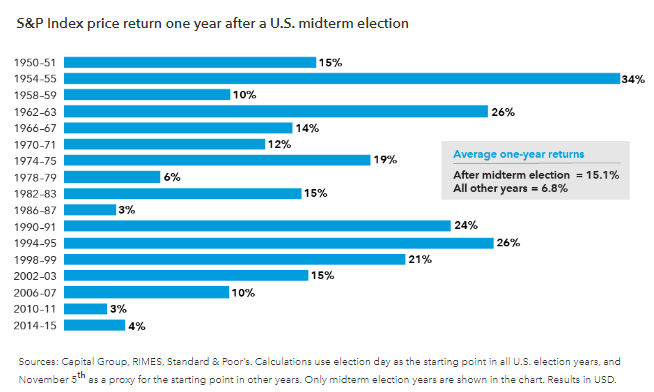
...prospects (Spoiler: statistics only): More often than not, markets bounce back strongly after U.S. elections are over! The silver lining for investors is that after these bouts of volatility, markets tend to rebound strongly in subsequent months. As we saw in the earlier chart, markets typically rally shortly after midterm elections. History shows that this isn't usually a short term blip either, as above-average returns are typical for the full year following the election cycle.
Since 1950, the average 1-year return following a midterm election is 15.1%, more than double that of all other years during a similar period (covering the period 1949 until 2018):
So, let's wrap up the whole story: The deep DIP during the summer months is fulfilled, once Q3 reaches its end. From October onwards we could then expect better times - if we trust statistics...
NO FINANCIAL ADVICE
link:


