Related Categories
Related Articles
Articles
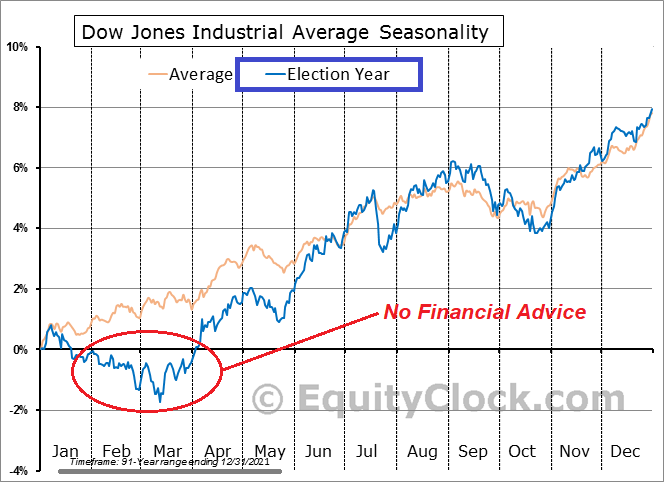
Dow Jones (Election Year Seasonality)
According to the 2021 Dimensional Funds report, the market has been favorable overall in 20 of the 24 election years from 1928 to 2020, only showing negative returns four times. When you further examine the years between elections,...
...however, it becomes apparent that year three of a president's term is usually the strongest year for the market, followed by year four.
This "Presidential Election Cycle Theory" was initially put forth by Yale Hirsch, the Stock Trader's Almanac creator. It was furthered by Pepperdine professor Marshall Nickles, in a paper called "Presidential Elections and Stock Market Cycles," which presented data showing that one profitable strategy would be to invest on October 1 of the second year of a presidential term, and sell on 31st December of year four (which in "our case" would be the 31st December 2024...).
In this respect, remember also the stock market performance from 1st October 2022 until now...(WoW).
Election Year Stock Market Returns
Here are the market results for the S&P 500 for every election year since 1980:
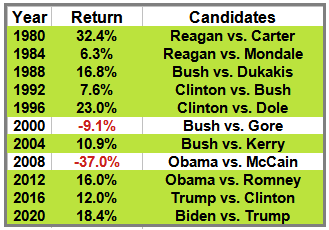
data source: Dimensional. "Matrix Book 2021"
Last, but not least, some more granular insight and observation:
3 months before the election eventually takes place, the US-stock market (Dow Jones) normally takes on (more) steam - especially concentrated in the 6 to 10 weeks - timeframe before the election "night" is on.
Once, the election is over the stock market prices are gaining another 2 weeks lateron. From that point onwards the market normally tends to go sideways for several weeks.
Just Seasonality - NO FINANCIAL ADVICE
cheers Ralph
link: https://www.thebalancemoney.com/presidential-elections
Book recommendation (in German): Das Börsenbuch (Börsenzyklen, etc.) T. Müller, A. Coels (2014)


