Related Categories
Articles
Nikkei 225
(Ichimoku-Status as per 28th May 2020)
The Ichimoku Kinko Hyo indicator was originally developed by a Japanese newspaper writer to combine various technical strategies into a single indicator that could be easily implemented and interpreted. In Japanese, "ichimoku" translates...
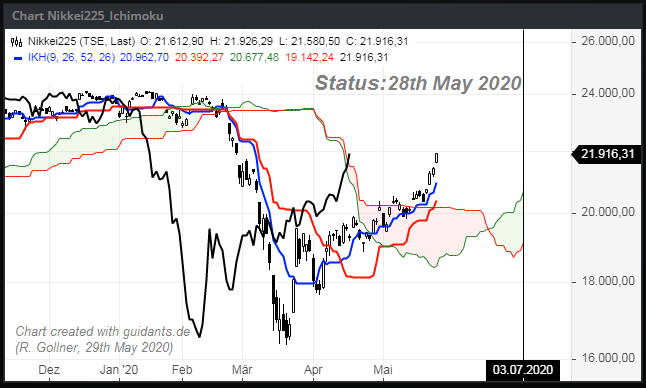
..."one look" meaning traders only have to take one look at the chart to determine momentum, support, and resistance.
The Ichimoku indicator is best used in conjunction with other forms of technical analysis despite its goal of being an all-in-one indicator.
Some more details: Ihe indicator is ...
Nikkei (Langfristchart)
Seit 2014 ist der japanische Index wieder relativ bullish unterwegs. Es galt im Jahr 2013: "Totgesagte leben länger". Das trifft unbedingt auf den Nikkei 225 zu. Nachdem Anleger wegen der zähen Deflation in Japan mit einer schrumpfenden Wirtschaftsleistung und...
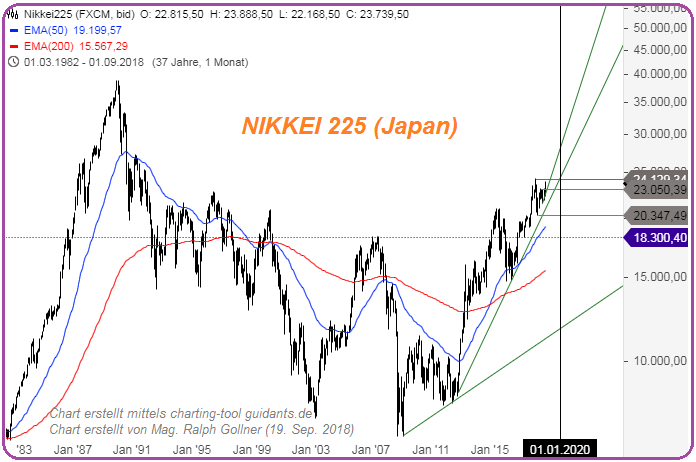
...mit fallenden Preisen viele Jahre lang keinen Pfifferling auf japanische Aktien gegeben hatten und der Leitindex im Land vier Jahre lang nur seitwärts gelaufen war, drehte die Stimmung Anfang 2013: Der Nikkei kletterte innert zwölf Monaten bis zum Jahresende 2013 um 60 Prozent!
link:
NIKKEI
26-Jahres-Hoch
Unter den großen Börsen der Welt hält die in Tokio eine Sonderstellung: Während Leitindizes wie der Dow Jones in den USA, der "Footsie" in London oder auch der deutsche DAX in den vergangenen Monaten neue Rekorde aufstellen und deutlich höher stehen...
...als in den Jahren zuvor, liegt die große Zeit der japanischen Indizes lange zurück. So stammt das Allzeithoch des Nikkei bei fast 39.000 Punkten aus dem Jahr 1989.
Danach ging es zunächst deutlich bergab und schließlich mehr oder weniger seitwärts. Doch möglicherweise ist diese Ära bald vorbei. In den letzten ...
Related Articles
South Africa (since 1900 one of the world's most successful equity markets)
Today, South Africa has 90% of the world's platinum, 80% of its manganese, 75% of its chrome and 41% of its gold, as weel as vital deposits of diamonds, vanadium, and coal. As per 2015, South Africa is the largest ...
Standard Deviations SMA 200 versus the US-Indices lies in 2015 @ max. ca. 4
(DAX only 3SD-difference as per 3rd Oct. 2015 = more room to correct?)
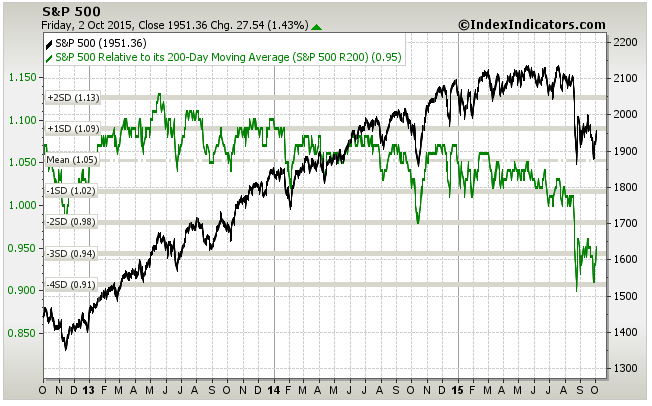
DAX (please click): http://www.indexindicators.com/charts/dax-vs-dax-200d-rsma-params-3y-x-x-x/
more data and current charts available for free ...
Thumbs up (DAX > SMA 200-daily)
Let us REFOCUS on the 200-daily Moving Average...as long as the Index stays above 11.111 points, or at least 11k the index looks stable. Still, there lies a gap around 10,5k - who knows if (and/or when) it will be closed?
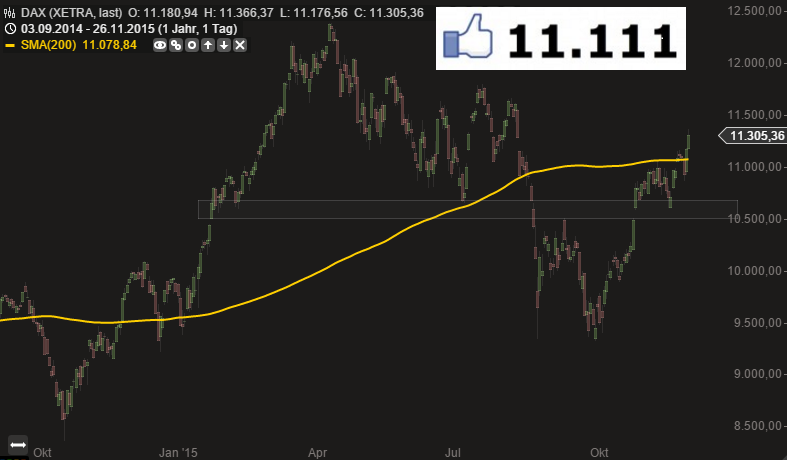
Chart was created with the ...
World GDP / "World-Stock-Market"
It remains most important to keep the idea of worldwide diversification in mind, as global growth remains most of the time positive yoy (see Figure 1):

Too often one can see that private investors are concentrating their investments in one region, sometimes ...
CECE-Index (in EUR), Anfang Dez. 2015
Der CECE-EUR Index (Osteuropa-Phantasie) ist auf einem Vier-Jahres-Tief, wie Stefan Mayriedl per boerse-online anmerkt.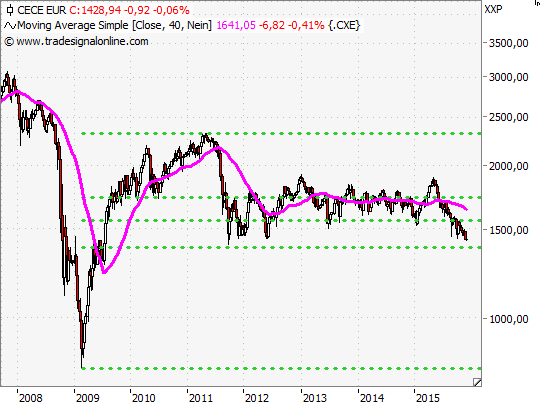 Quelle: http://www.boerse-online.de
Osteuropäsiche Aktien sind im Moment völlig out (Q4-2015, Anfang Dez.). Der bekannte ...
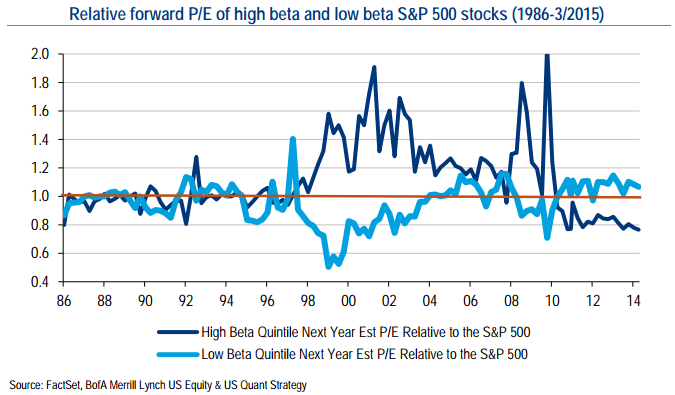
US-Stocks (Valuation-History up to 2015)
S&P 500 und der WTI-Ölpreis (Korrelation auf 26-Jahres-Hoch)
Die Korrelation zwischen Öl (Sorte WTI) und dem S&P 500 bewegte sich im Januar 2016 auf einem Niveau, welches in den letzten 26 Jahren nicht mehr erreicht worden ist.
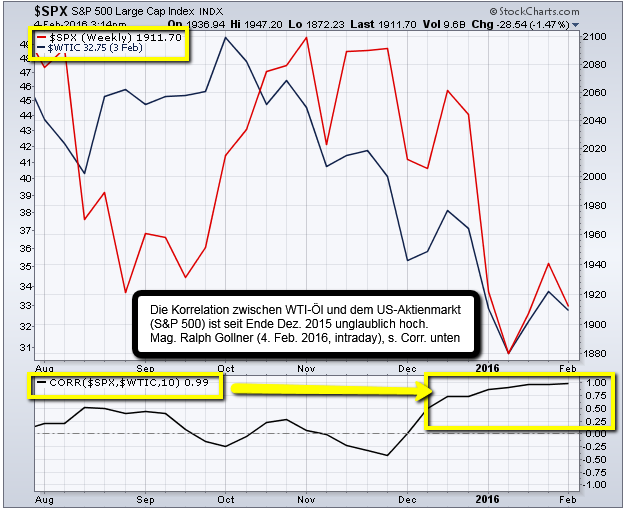
Die Korrelation im Jänner 2016 hat ca. 0,97 betragen, höher als ...
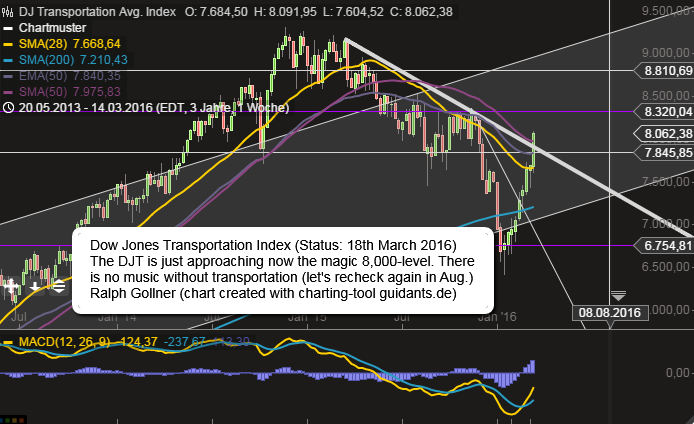
Dow Jones Transportation Index
In April 2015, "private-investment.at" looked at the DJT-Index and remarked, that is was of utmost importance to follow the Index and its fight with the SMA50-line (weekly). The Index lost, broke through and found an intermediate bottom some weeks ago:
Golden Cross April 2016 (Dow Jones IA)
Bullish Crossover Moving Average 50days/200 days
A bullish ‘golden cross’ chart pattern has appeared in the Dow Jones Industrial Average, and this one may have a better shot of working out for investors than the one that failed just four months ago.

...
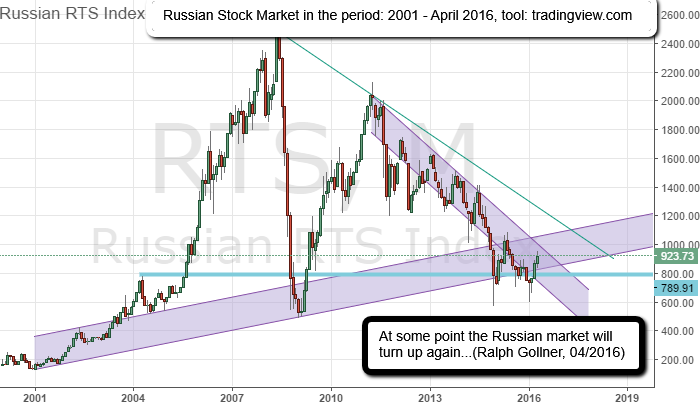
Russischer Aktienmarkt (RDX-USD, RTS)
Bewertung (CAPE), Langfrist-Chart
Der russische Aktienmarkt wurde, final mit dem Ölpreis-Absturz im Jahr 2015, die letzten Jahre tief ins Minus gedrückt:
Als ATX-Investor ist man sich dessen besonders bewusst, da teilweise doch eine Korrelation zwischen ...
S&P 500 "the 50s"
Although we tend to think of the 1950’s as "Happy Days" made up of greasers and hot rods, the "Fifties" were not all peaceful and roses. The 1950’s began with the "Cold War" between the United States and the Soviet Union...
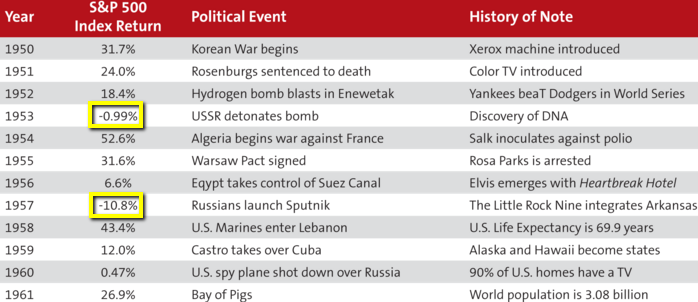
...as clashes between communism and capitalism ...
S&P 500 ("the odds")
Aktien (US-Aktien) steigen im langfristigen Bild die überwiegende Mehrheit der Zeit. Meine Berechnung (unter Verwendung von Daten von NYU Stern) hat ergeben, dass in 66 der letzten 88 Jahre der S&P 500 positive Jahre hatte. 73% positive Jahre!
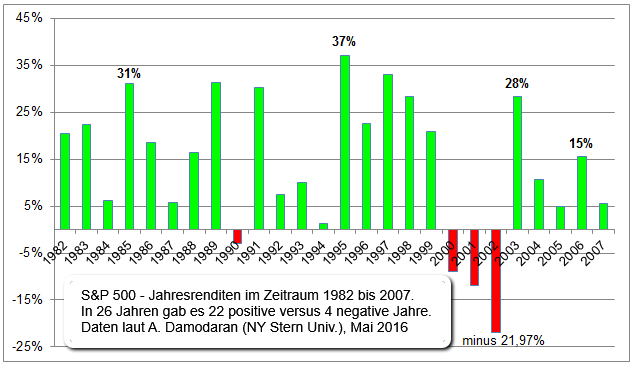
Wenn man also in die ...
SDAX (German Small Caps)
Mit mehr als 9.300 Punkten hat der SDax sich zum renditeträchtigsten Index in der deutschen Börsenlandschaft emporgeschwungen. Dax, MDax und TecDax notieren zum Teil deutlich unter ihren hist. Höchstständen, der SDax stand zeit seiner Geschichte noch nie so hoch.
...
Dow Jones Industrial Average (Pre-Brexit-Voting)
The famous Dow Jones (DJIA/Dow Jones Industrial Average) has been buidling up momentum lately (again), since the widely known Index broke its 200-Day Simple Moving Average (but also the Exponential Moving Average and the WMA):
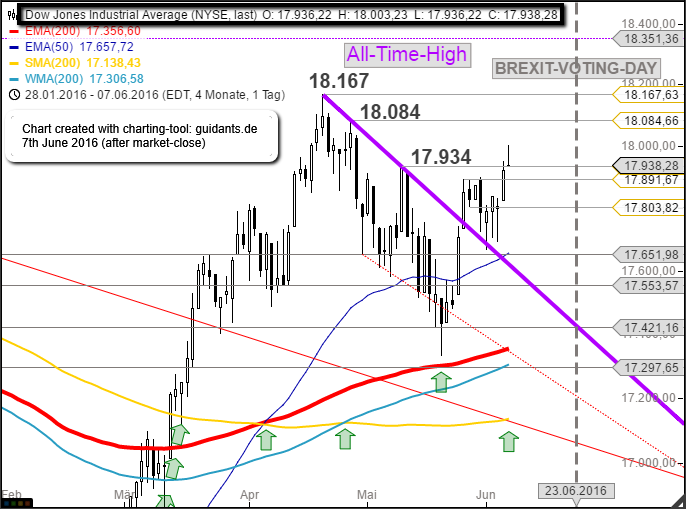
Stay cautious!
Investors in European stocks are fearful - since the Brexit-voting will take place on the 23rd June 2016 with unknown consequences.
DAX-Rollercoaster (03/2012-06/2016)
Geschüttelt, nicht gerührt...Folgend dem BREXIT-Voting gingen kfr. mal alle Sicherungen durch. Derzeit wird am Versuch einer Stabilisierung im Bereich 9.100 bis 9.800 Punkte gearbeitet - RISKY!
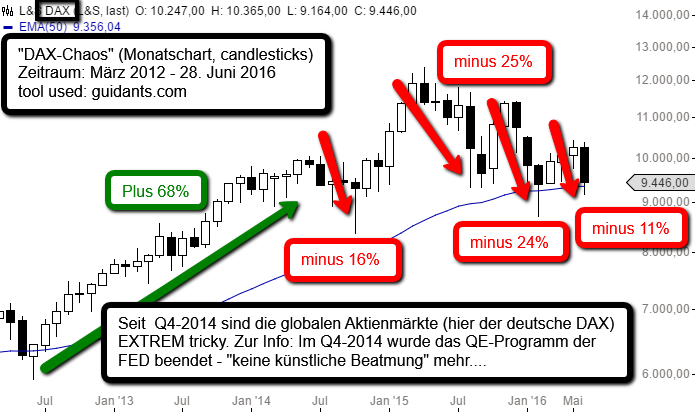
DAX-Betrachtung (Bild oben) wurde kommentiert von Mag. Ralph ...
S&P 500 reached an All-time high weekly close!
Record highs around the corner? "Close" doesn't even come close to describing it. The S&P 500 rose as high as 2,131.71 on Friday (8th July 2016), its highest level in nearly a year, as it surged 1.5 percent...
DAILY updated/weekly updated ...
Dow Jones Industrial Average (2. Halbjahr 2016)
"Alles ist möglich"
Im Nov. wird ein neuer US-Präsident gewählt. Wie könnte es bis zum Jahresende mit dem Dow Jones Ind. Average weitergehen? Mit dem Wahltermin im Hinterkopf kann ich mir einen Schlangenpfad bis Silvester vorstellen:
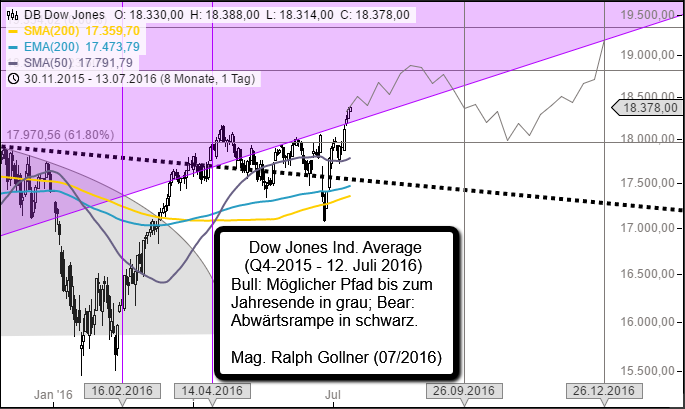 Chart ...
Dow Jones Industrial Average (Renko-Chart)
July 2011 - July 2016
Developed in the 18th century in Japan to trade rice, Renko charting is a trend following technique. Lateron Renko-Charts were found useful in trading any other financial instrument, like stocks for instance.
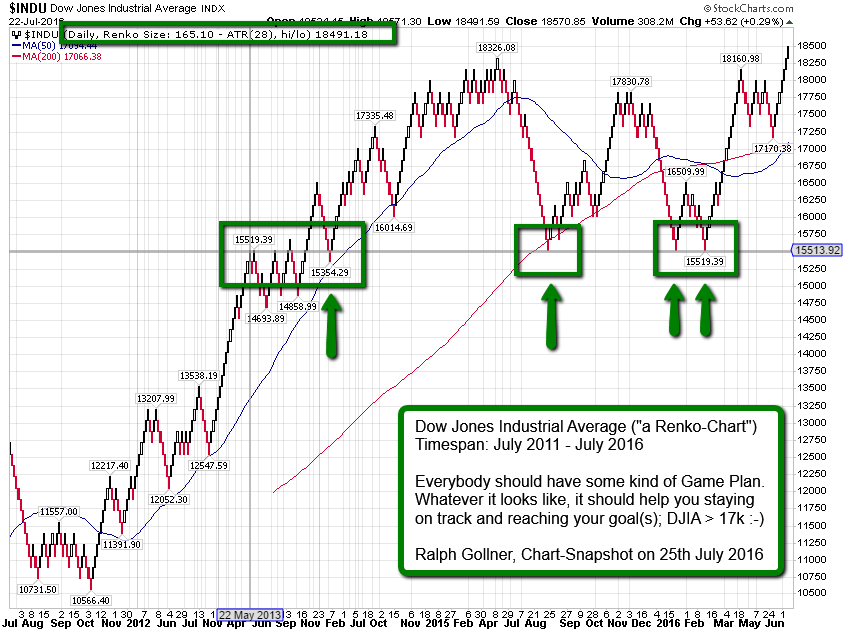
It is excellent ...
EmergingMarkets-Debt-Index
Investor appetite for emerging-market bonds has pushed buying in debt-oriented funds tied to those regions to records. Net inflows to funds that buy EM-bonds reached an all-time high in the week through 20th July.

Roughly USD 14 billion has poured into ...
Choosing the "best" Benchmark
S&P 600 maybe?
An ETF on the S&P SmallCap 600 provides diversified exposure to U.S. small-cap stocks. The S&P SmallCap 600 Index is well diversified by sector and security with the highest exposure to financials, industrials and information technology.
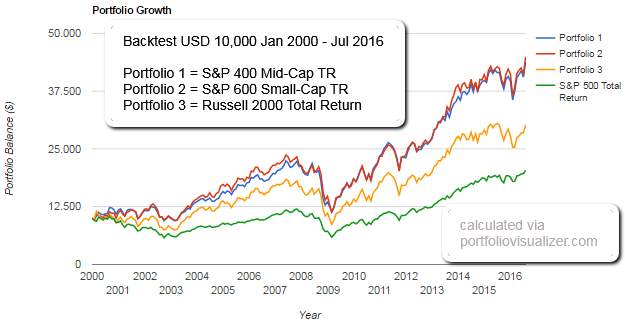
Although ...
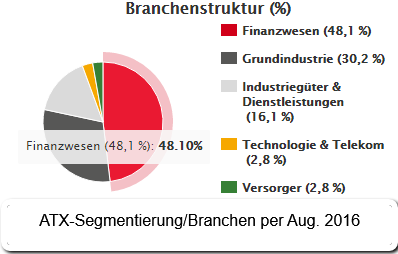
ATX (Back in the game?)
Der österreichische Aktienindex, kurz ATX, ist relativ volatil, weil er denn auch zyklische Branchen schwer gewichtet hat. So ist beinahe die Hälfte des Index mit Finanzdienstleistern oder Industrieunternehmen bestückt, wie z.B. Banken oder Versicherungsunternehmen.
...
S&P 500 (Volume by Price)
Let's hope, the volume is coming back in the next few weeks and the Volume-pulling (see red bricks on the left) levels between 2,070 and 2,120 are giving Support - if EVER-NEEDED? Let'see (Reminder: US-Election on 8th Nov. '16)
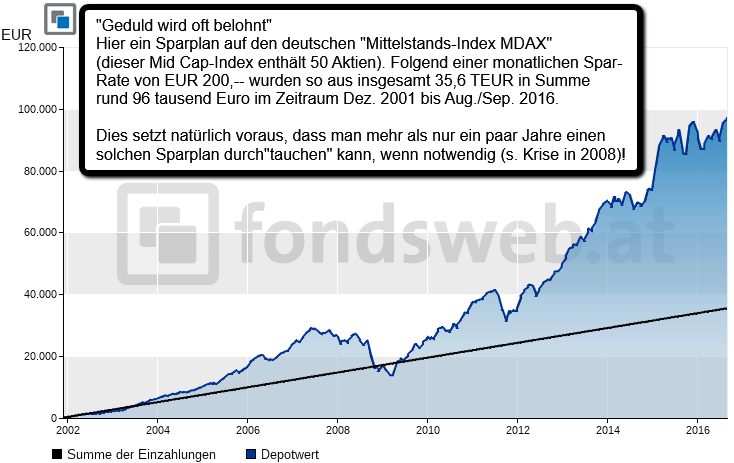
MDAX ( "2002 - 2016" )
Bei meinen Recherche nach den langfristig interessanten Möglichkeiten im Bereich Geldanlage kommen mir immer wieder Sparpläne unter. Das Problem ist hier jedoch oft, dass der interessierte Anleger teilweise garnicht versteht, was hinter dem Sparplan eigentlich steht.
...
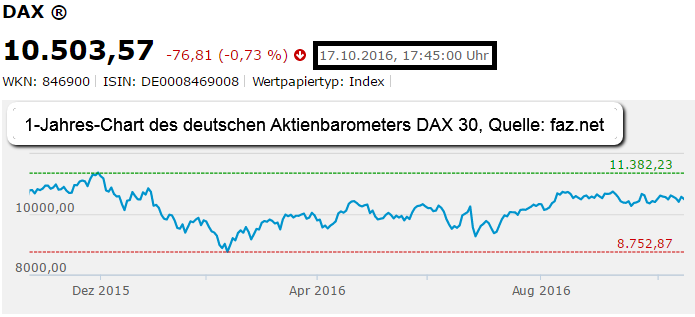
DAX 30 zwischen 8.700 und 11.400 Punkten
Seit Okt. 2015 schwankt der deutsche Aktienindex DAX in einem Korridor von ca. 2.600 Punkten. Sowohl die Themen "China-Unsicherheiten" im Q1-2016, sowie das Brexit-Voting im Juni 2016 fallen in diesen Zeitraum/Demarkationslinie: ca. 10.000 Punkte.
...
Zickzack-Börsen seit Feb. 2015
(Status: 4. Nov. 2016)
Seit Feb. 2015 stocken die globalen Leitbörsen der Welt. Zwischendurch haben jedoch einige Teilbörsen (wie der brasilianische BOVISPA) durchstarten können. Warren Buffet hatte insbesondere in 2015 einige Probleme!
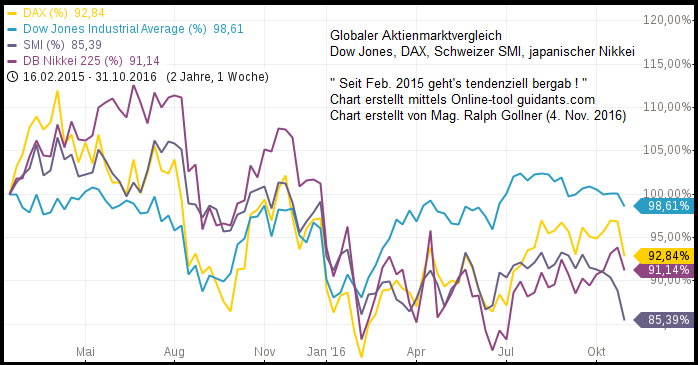 Im folgenden Schaubild ...
XLF (Financial Sector ETF)
(Nov. 2012 - 18th Nov. 2016)
The Financial Select Sector SPDR Fund tracks an index of S&P 500 financial stocks, weighted by market cap. XLF offers liquid exposure to the heavyweights in the US Financials segment. Check out the breakout this month:
Its cap-weighted ...
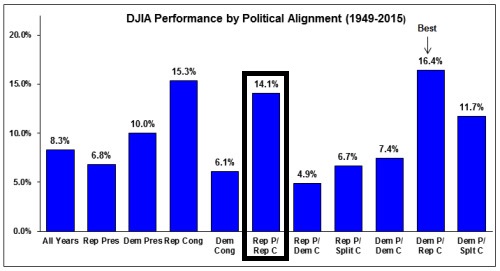
Dow Jones Ind. Average (Rep./Democr. President)
Data presented in the chart below begins in 1949 with the first full presidential term following WWII to focus on the modern era. First looking at just the historical performance of the DJIA under Democratic and Republican Presidents...
S&P 500-TR vs. DAX-Performance-Index (SPX vs. DAX)
Im den folgenden Chart sieht man einen Vergleich über 2 Jahre - und zwar zwischen dem S&P 500 TR (Total Return-Index, also inkl. Dividenden) und dem DAX-Performance-Index (ebenfalls inkl. Dividenden):
In folgendem Chart werden beide ...
Die "magische" 200-Tage-Linie
Die 200-Tage-Linie ist ein einfaches Mittel um Trends zu ermitteln und um Kauf- und Verkaufssignale zu erkennen. Die Methode gehört zu den bekanntesten und besticht durch ihre Einfachheit...
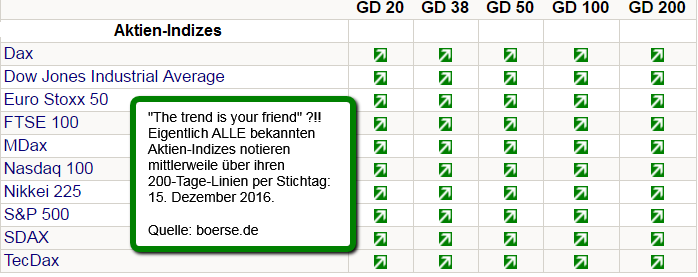
Die 200-Tage-Linie gehört zu den einfachsten und bekanntesten ...
5 years NASDAQ vs. DAX vs. M/DAX vs. ATX
One should compare apples with apples, but this is pretty hard. Just remember that each of the Indices is in local currencies. Examples: Nasdaq-stocks in USD, DAX in Euro, etc.
Still, here are the last years in retrospect
(MDAX vs. NASDAQ-Comp.)
MDAX ...
Magic 1,000 level in the S&P 100 Index
conquered as per weekly close (6th Jan. 2017)
We could wait and see if that level will also be defended as per month close of Jan. 2017. Furthermore the technological-oriented "sister" NASDAQ 100 (Tech-Index) also surpassed a psychological level: 5,000!
S&P 500 Rainbow Chart of the "90s"

Always remember: Keep the market as stupid and simple as it can be...Developed by Mel Widner and originally described in the July 1997 issue of Technical Analysis of Stocks and Commodities magazine, the Rainbow Charts indicator is a trend-following one. The ...
Famous Investors, Economists &
the Dow Jones IA
Michael Batnick analyzed the birth dates of the most important investors of all time. Without further ado, the most important investors of all time (up to the maximum birth year of 1941) are stated in following Dow Jones-Chart:
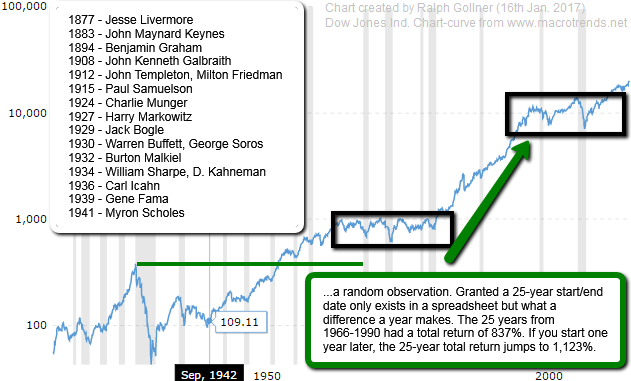
But this is an ...
S&P 500 Rendite, DJIA seit 1896
(...bis 20.000 Punkte per 01/2017)
Der Dow Jones Industrial Average (aka DOW) ist ein preisgewichter Index und besteht nur aus 30 Werten. Der marktbreite Index ist eher der S&P 500 (kapitalgewichtet), welchen ich zur Renditeberechnung herangezogen habe:
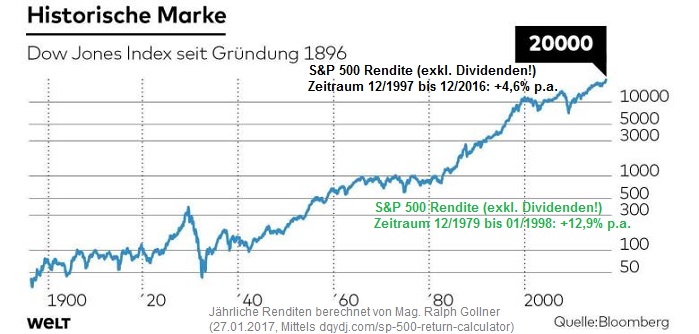
Die ...
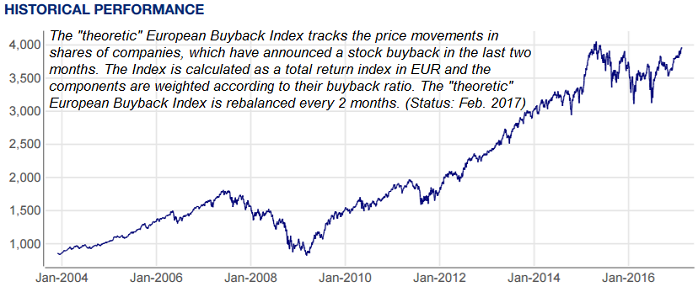
Aktienrückkäufe: Wenn Firmen sich selbst kaufen
Buy-back-Programme erhöhen den Gewinn je Aktie für Anleger. Dennoch sollten die Motive immer kritisch hinterfragt werden. Manche Unternehmen sorgen für einen Kursanstieg, indem sie eigene Aktien von den Aktionären zurückkaufen. Achtung: Doch...
 ...
...
Rising Trading Volume (US-Stock Markets)
Dow Jones, S&P 500
UNTIL Oct. 2016 the US-stock market has been marked by declining trading volumes in the last years. The trading volumes story is a somewhat complex. Some argued that it was a sign of "low confirmation," meaning investors didn't...
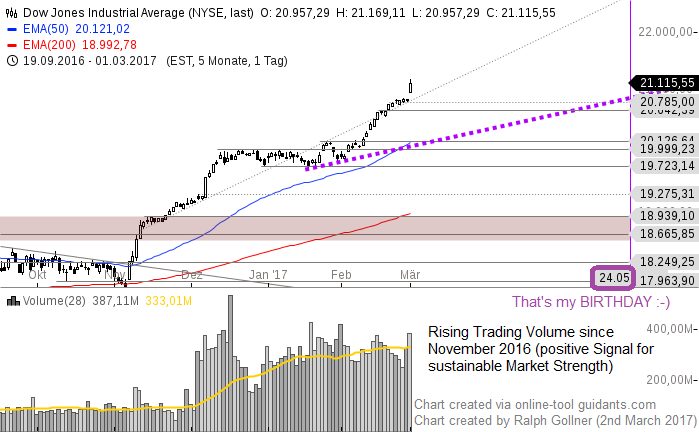
...
S&P 500 (Under the hood)
All cylinders firing at the same time? (cylinders being here ALL the big sectors of the economy); Definition: The S&P 500 stands for the Standard and Poor's 500. It is a stock market index that tracks the 500 most widely held...

...stocks on the New York Stock ...
TecDAX (magic 2k, Risiko 12% darunter ?)
TecDAX, der würdige(re) Nachfolger vom Chaos-Index "NEMAX 50", oder Neuer-Markt. Hier versammeln sich die 30 größten deutschen Technologiewerte. Durch die sog. 35/35-Regel wird zweimal jährlich jeweils zum März und September die Zusammensetzung...
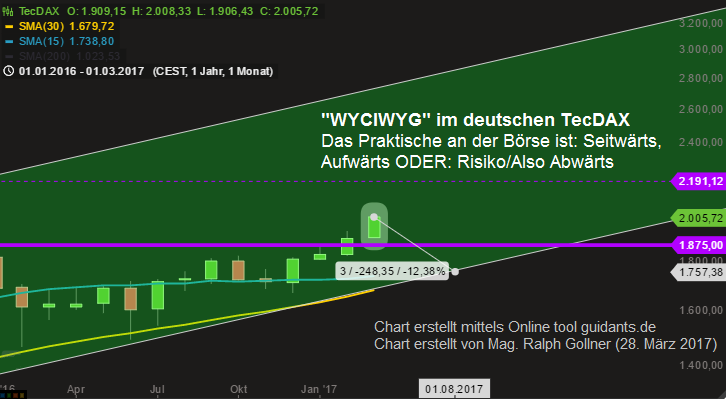
...
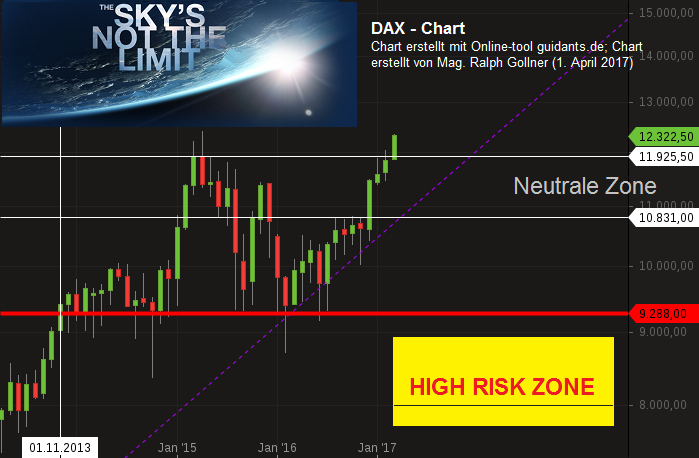
DAX - Sky(high), Neutral, Or Risk-Zone (?)
Eigentlich müsste man das folgende Chartbild nicht kommentieren. Es sollte selbsterklärend sein! Im Hintergrund sollte man sich wohl -zumindest- auch die Bewertungskennzahlen KGV, KUV, KBV ansehen (auch im historischen Vergleich) !
great ...
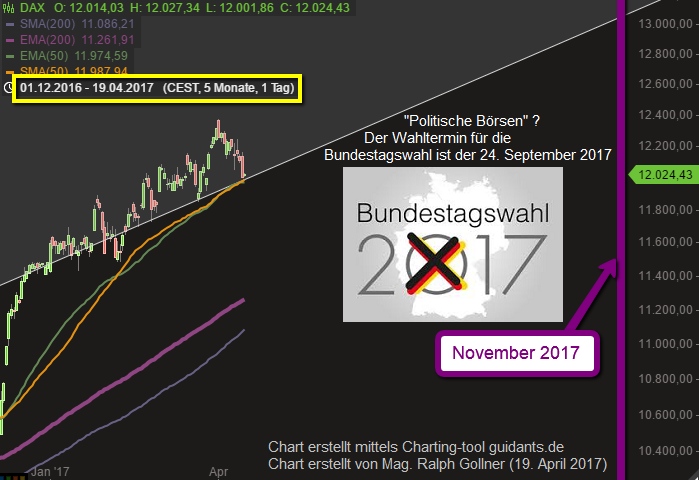
DAX vor dem Sommer im Wahljahr 2017
Die 200-Tage-Durchschnittslinien sind noch in sicherer Ferne und könnten -im Notfall- als (letzte) Unterstützung dienen. Soweit sollte es aber doch nicht kommen - sofern dieses Wahljahr glimpflich verläuft...
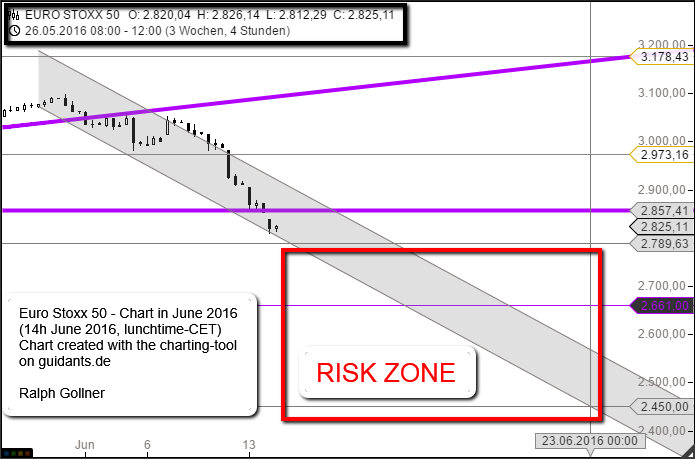
EuroStoxx 50
(April 1992 - April 2017)
oder: "Nichts ist unmöglich"
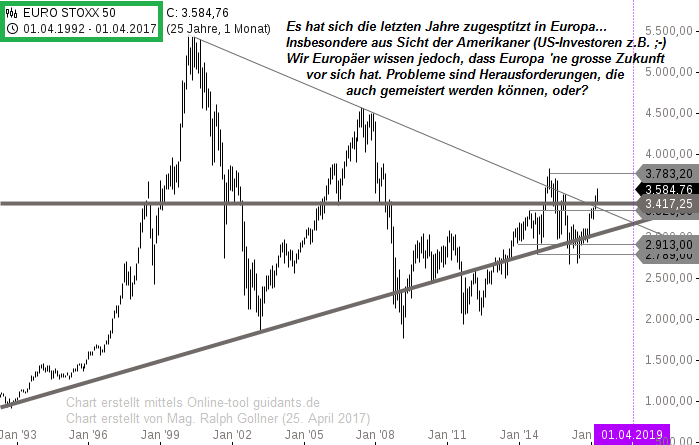
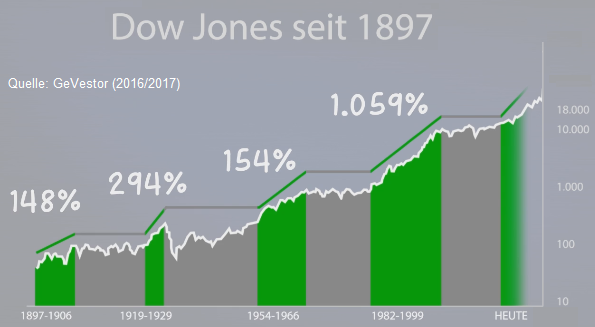
Im Dow Jones Industrial Average gibt es seit 1897 eine Abfolge von Bullenmärkten und temporärem Seitwärtsgeschiebe (bzw. Bärenmärkten, die tlw. gar 17 Jahre angehalten haben). Spannender UP-RollerCoaster-Ride seit Gründung des Dow Jones Industrial Average im 19. ...
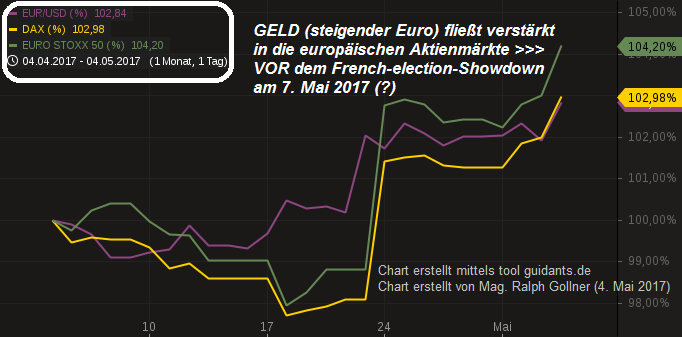
Euro steigt, Europas Aktienmärkte steigen
(04/2017 - 4. Mai 2017)
Parallel zum steigenden Euro (EUR/USD-Währungspaar) - mittlerweile bei ca. 1,095 EUR/USD - steigen auch Europas Aktienmärkte (z.B. Spanien - Index bei ca. 11.000 Punkten), Euro Stoxx 50 > 3.650 Punkte, DAX > 12.500 Punkte...
 ...
...
US-Market and Non-US (Rest of World)
US-Markets had their final hooray in the tailwind-environment of Mr. Trump (election-month November 2016). Maybe it's time for the Rest of the world to start their Stock-Market Gains? sustainable Gains?
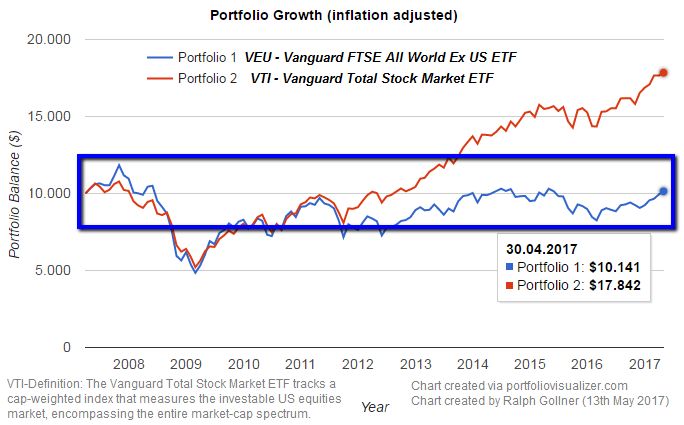
Well, I used the two different ETFs "VEU and VTI" ...
S&P 500 Global Exposure (IT-Sector)
Sill, the S&P 500 relies highly on the domestic economy (being the United States). But recheck the IT-Sector, but also the companies from the Industrial Sector, which have a relevant portion of their sales abroad.
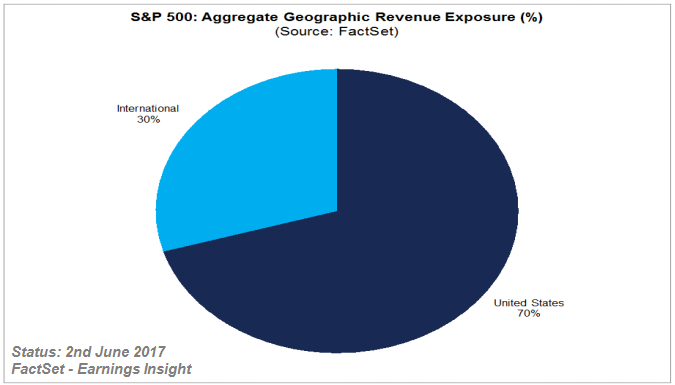
The ongoing global recovery is especially ...
Dow Jones Utility Average
A bullish signal in U.S. stocks is being issued by an indicator that few investors ever focus on: the Dow Jones Utility Average. That's because this benchmark which was created 88 years ago, in 1929, is thought to be a leading indicator...
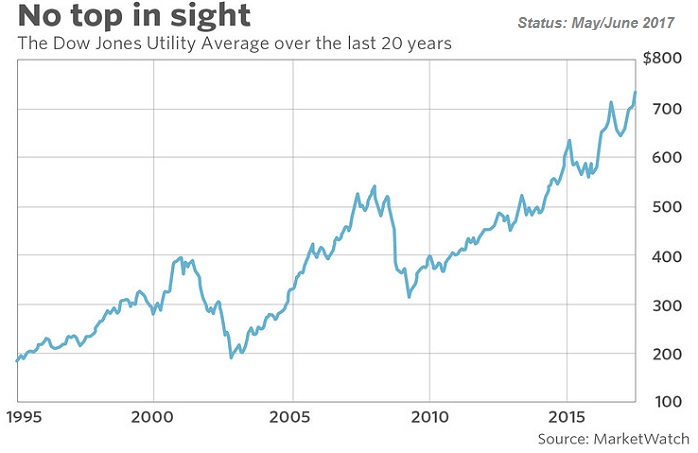
...of tops and bottoms in ...
Nasdaq Composite (Momentum-Catch up)
If there is a trend and the Index and its components are gaining momentum then "everything is possible". Remember the crazy Momentum in the final years of the 90s (last century):
In the following period, including the Financial Crisis Breakdown in the ...
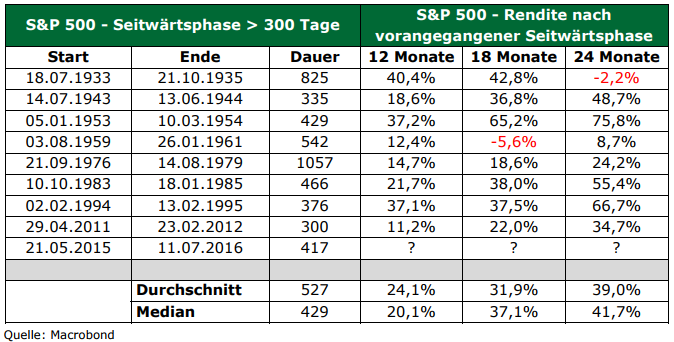
S&P 500 Seitwärtsphasen ( > 300 Tage)
Am 11. Juli 2016 stand der Index bei ca. 2.137 Punkten. Würde nun der Index am Ende einer Seitwärtsperiode so stark ansteigen, wie bisher, würde der S&P 500 im Juli 2018 bei ca. 2.970 Punkten stehen (siehe Durchschnitt lt. Schaubild)...
 ...
...
S&P 500 @ magic 2,400 - level
The broad US-Stock Market (S&P 500) is currently at an interesting level near 2,400 points. Furthermore also two weekly Moving Averages are crossing this level soon > relevant decision may be upcoming...
In following chart one can clearly see, that an ...
The MSCI Emerging Markets Index
The "EM-Index" captures large and mid cap representation across 24 Emerging Markets (EM) countries*. With 845 constituents (as per July 2017), the index covers approximately 85% of the free float-adjusted market capitalization in each country.
*EM countries ...
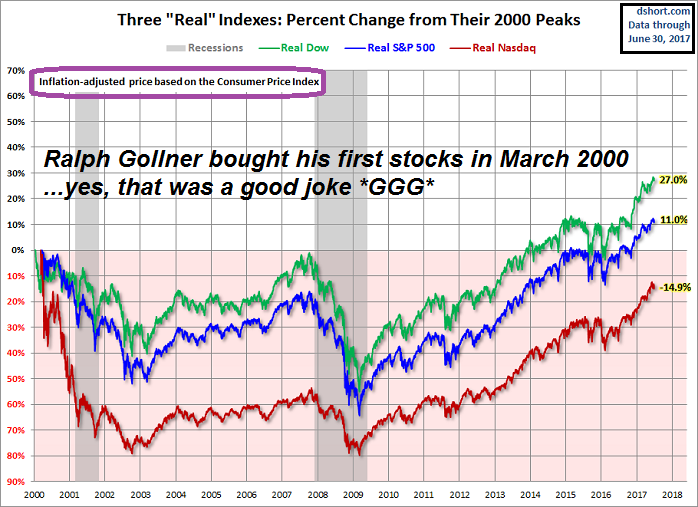
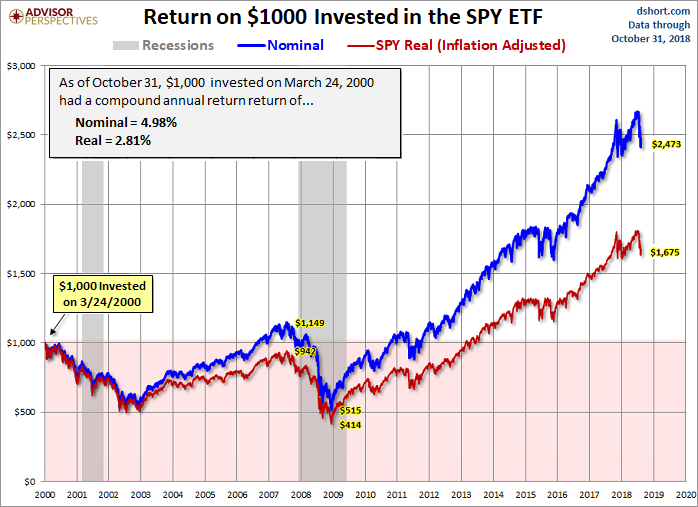
"Real Indexes" from the year 2000 onwards
(Status: June 2017)
The following chart requires little explanation. Reminder: So far the 21st Century has not been especially kind to equity investors (in real terms!). Yes, markets do bounce back, but often in time frames that defy optimistic...
...
DOW - biggest contributors 2017
(year-to-date)
Over the previous two weeks the Dow Industrials has been diverging from most other Indices and particularly the Dow Transports. An important part of the divergence has been the relative narrowness of the rally in the Dow.
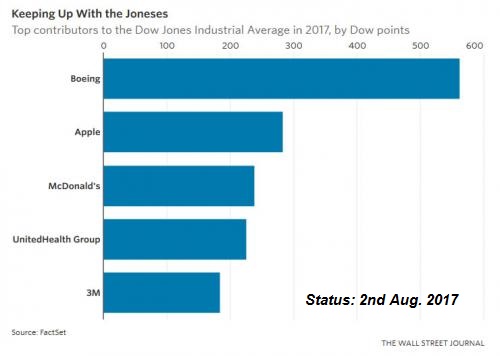
In the WSJ, Justin ...
Stocks versus Bonds
(last 2 years)
Stocks can fall faster and further than junk bonds, but they also offer the possibility of significant capital appreciation in the long term - here a comparison between the broad US-Stock Market & HY-Bonds (S&P 500 vs. Corp. High Yield Fund / "HY-Bonds").
...
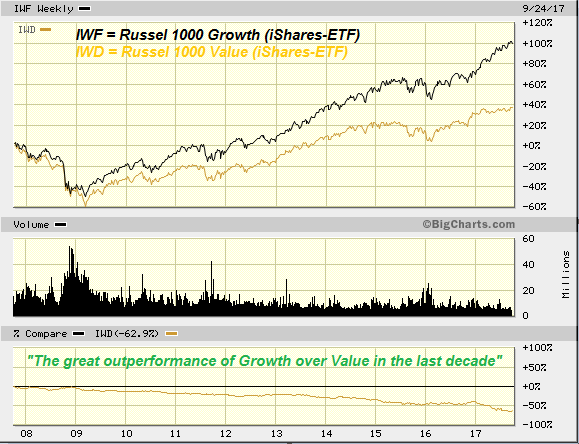
Value Investing Having Its Worst Run Since The Financial Crisis
Status: Aug/Sep. 2017
Over the past decade, the performance of U.S. growth stocks has been almost three times better (!) than that of value stocks. Index fund giant State Street Global Advisors calls it "the longest...
...
Dosenwachstum 2007 bis 2016
Dosenblase oder was? *lol*
Nun ja, man sollte sich Themen wie "Wachstumsreihen" spielerisch nähern. Reminder: Durch den Zinseszins kommt es bei einem Wachstum von ca. 8% p.a. zu einer Verdoppelung nach ca. 9 Jahren; Hier z.B. ein "Dosenwachstum":
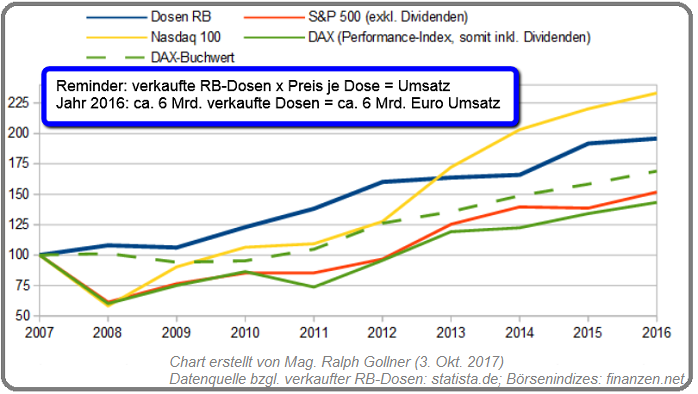
Zur Info: Im ...
30 years after historic stock market crash
(Oct. 1987)
This week will mark the 30th anniversary of the market crash of 1987, better known as Black Monday. On 19th Oct. of that year, financial markets around the world plunged into chaos. The Dow Jones industrial average plummeted 22.6 %,...
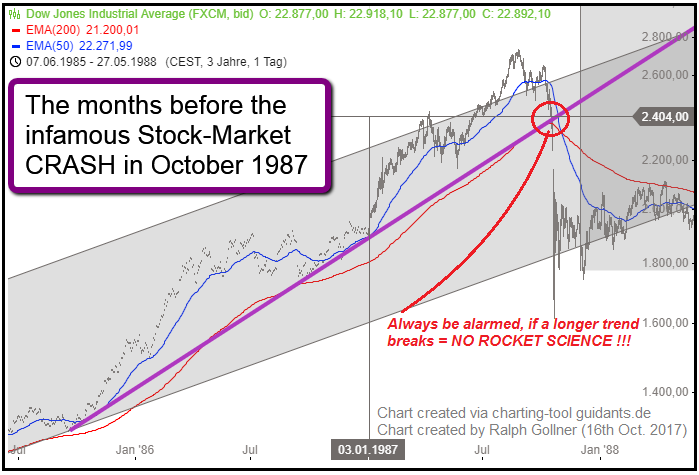
...
DAX und DOW seit dem Jahr 1999 (Status: Nov. 2017)
| Ergebnis seit Ende 1999: | DAX | DOW JONES |
| Gewinnjahre: | 13 | 12 |
| Verlustjahre: | 5 | 6 |
| Gewinnhäufigkeit: | 72,2% | 66,7% |
| durchschnittliche Gewinnhöhe: | +18,6% | +13,1% |
| durchschnittliche Verlusthöhe: | -25,3% | ... |
MDAX & Nasdaq-100 (2013 - Nov. 2017)
5-Jahreszeitraum
MDAX (Performance-Index, somit inkl. Dividenden) versus Nasdaq-100 sind beinahe im Gleichlauf emporgestiegen in den letzten 5 Jahren. Um ca. 140% ist der Technologie-Index Nasdaq-100 samt seinen 100 Aktien im...
...besagten Zeitraum ...
Dow Jones Transportation Average
(magic 9.5k)
Der DJ-Transportation Average (Index) sollte schön über dem 9.474er-level im Zeitraum der nächsten Monate verbleiben - Ansonsten wären Turbulenzen bei Notierungen unter dieser Marke wohl keine grossartige Überraschung...
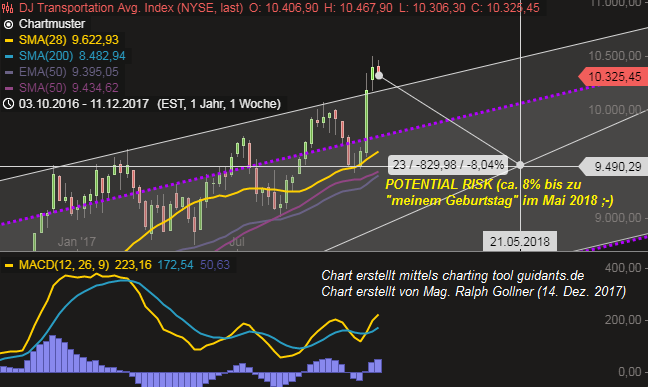
cheers Ralph ...
Dow Jones Transporation Average
(Fresh All-Time-High)
Developed more than 115 years ago, "Dow Theory" - created in part by Charles Dow, the founder of the Wall Street Journal - is considered the oldest stock market indicator that's still followed by a broad swath of the investing public.
It ...
"Öl-Index" (WTI-Ölpreis)
Abhängig vom Ölvorkommen und Förderung existieren in Abhängigkeit von der Qualität unterschiedliche Sorten. Die wichtigsten Sorten sind Brent Crude Oil (Europa), West Texas Intermediate WTI (Nordamerika), Oman Crude Oil (Asien) und...
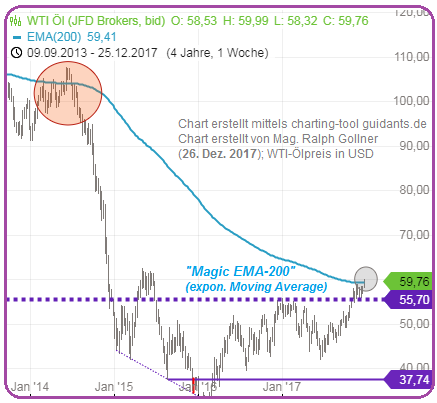
...Arab Light. Entscheidende ...
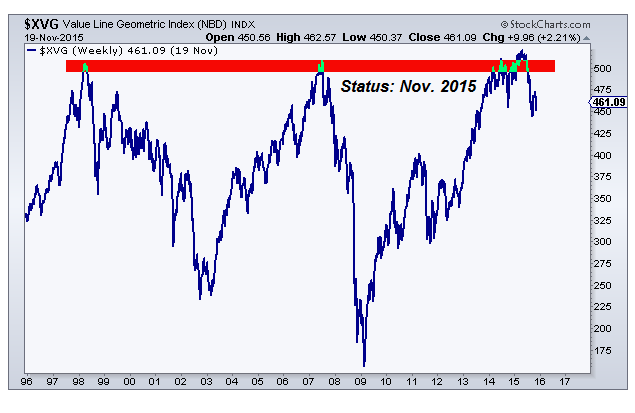
Value Line Geometric Index
All-Time-High
This index is great at providing insight into the current condition of the U.S. stock market: the Value Line Geometric Index (XVG). This index tracks the median move of stocks within the index using the assumption that each stock has an equal...
 ...
...
US 10Year Treasury-Yield vs. Dow Jones (Ind. Average)
According to Bill Gross, a famous long-term bond investor, yields are likely to climb to at least 2.7 percent by year-end 2018. The driving forces include global economic growth, the U.S. Federal Reserve raising its benchmark rate and...
 ...
...
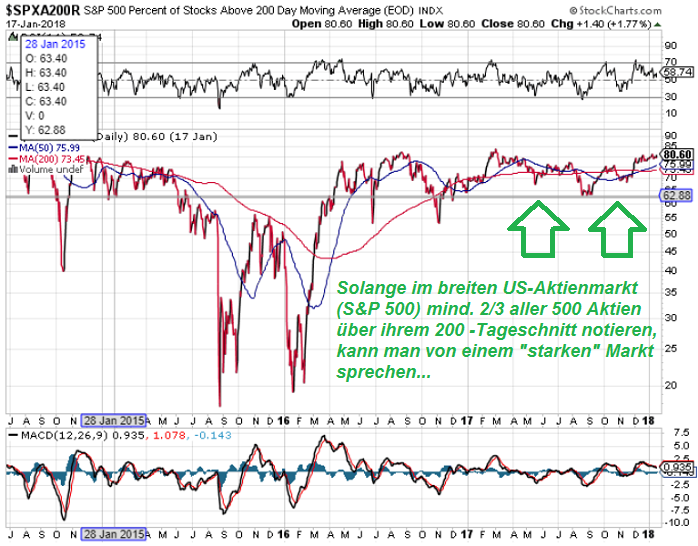
Stärke im US-Aktienmarkt (Aktien > 200-Day Moving Average)
S&P 500 "Marktstärke" laut finviz.com (Aktien > SMA 200-daily): 391 / 500 per Market-Closing am 18. Jan. 2018
391 von 500 Aktien liegen somit über ihrem jeweiligen 200-Tage-Durchschnitt = 78,2% (Stark, da > 75% Marktbreite)
Im ...
Euro Bund-Future
Die Anleihekurse des deutschen Staates lassen sich am Einfachsten am entsprechenden Bundesanleihen-Marktbarometer, dem Euro Bund-Future ablesen: Dieser notiert mittlerweile wieder unter einem "normalerweise maximalen" Niveau von 160 Punkten. 160 Punkte - das ist...
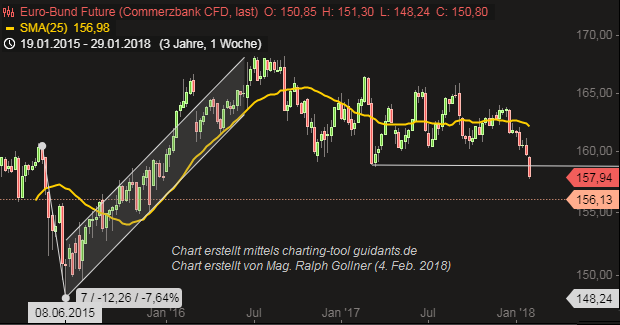
...nicht ...
The 200d Simple Moving Average (SMA)
"3 Standard Deviations above/below the SMA200-daily"
Upfront: Some days ago the Dow Jones Industrial-Average Index-level reached a level, which was in distance of 3 standard deviations from its 200-Day Moving Average (SMA-200). Then, suddenly the Index...
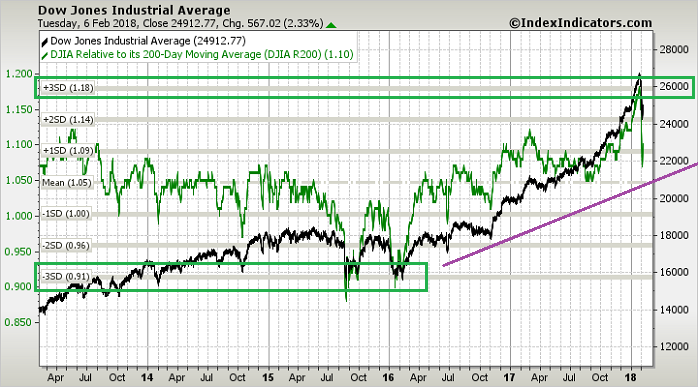 ...
...S&P 500 (Technicals, SMA200-daily)
The US-Stock Market showed a neat Intraday-Turnaround at the end of the trading-week. Therefore a positive sign was given within the last hours of friday's trading day - a signal which could lead to a positive trading week starting next Monday (?):
The ...
Bull Market Length (Definition)
Short reminder: from May to October 2011, the Standard & Poor's 500 Index fell 21.6 percent. Upfront: One may argue that the best starting date of a new bull market is when the prior bull-market highs are eclipsed. That is how how one gets a date like...
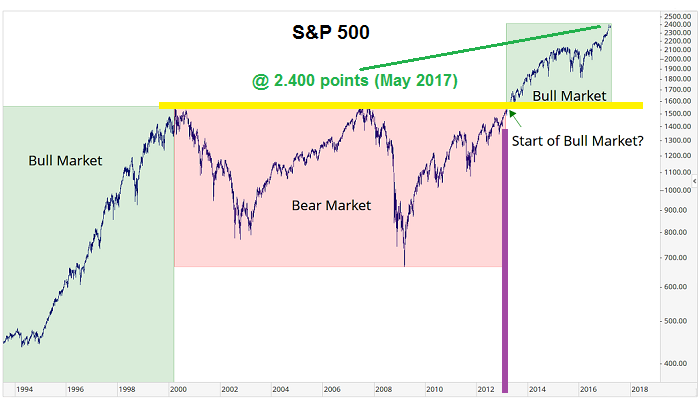
...
DAX
(April 2015 versus 13. März 2018)
Kurzer Recap ins Jahr 2015: Der Dax stieg damals bis zum 10. April 2015 auf 12.374 Punkte. Interessanter Vergleich zum heutigen Tag - an welchem das DAX-Aktienbarometer per Tagesschluss bei ca. 12.221 Punkten notiert. >> Macht saldiert ein knappes...
...
Hexensabbat (4 mal im Jahr)
Der "Hexensabbat" oder auch "dreifache Verfallstag" ist immer der dritte Freitag der Monate März, Juni, September und Dezember. Handelskontrakte wie Futures oder Optionen sind zeitlich begrenzt und verfallen in regelmäßigen Abständen. An den großen,...
...
US Technology-Index
(Dow Jones US Technology-Index)
The Dow Jones Technology Sector tracks a market-cap weighted index of U.S. technology companies. The Index is mainly driven by digital trends like: Internet of things, Internet Infrastructure, Chips (not to eat), Tech-R&D, etc.
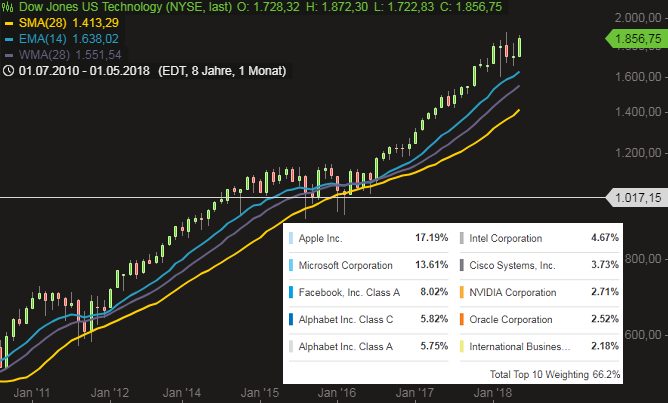
...
"Dow Jones Internet Commerce"-Index
Seit mehr als einem Jahrzehnt ist das Internet nicht mehr wegzudenken! Ebenso sollte wohl jeder erfahrene Investor wissen, dass das BIP oft gar zu 2/3 vom Privatkonsum getragen wird. Verbindet man nun diese beiden Gedankengänge, landet man beim...
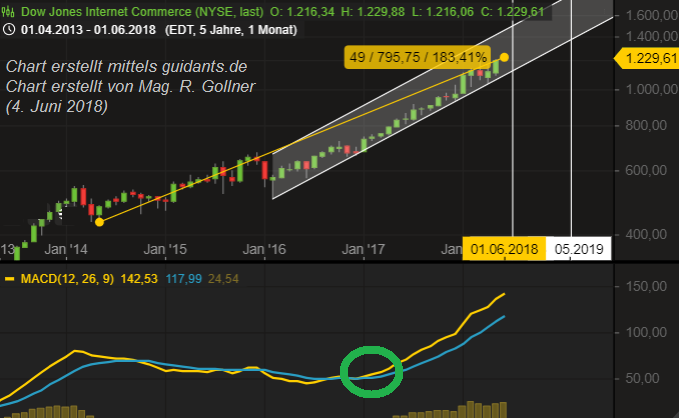
...
NASDAQ-monthly (EMAs)
Recheck the EMAs I applied in the chart above. They could serve as support levels in the upcoming quarters - if needed. We will have to wait and see. For the moment/what is left to say: "THE TREND IS OUR FRIEND"
DAX Kursindex - LANGFRISTIG (2007 - 2015)
(somit exklusive jährlicher Dividenden)
DAX-Kursindex level im April 2015: 6.339 Punkte
DAX-Kursindex level aktuell (25. Juni 2018): 5.625 Punkte
(Aktuell sind wir somit mehr als 10% unter dem Allzeithoch vom April 2015
DAX-Kursindex level im April ...
Status Quo
YEAR-TO-DATE Performance von Indizes
Viele Investmentfonds (auch) im Milliardenbereich stehen dieses Jahr im Minus mit ihrer Performance, haben somit (voerst) Kapital Ihrer Anleger vernichtet (Buchverlust vorerst). Noch ist aber erst Halbzeit in diesem Jahr. Insbesondere...
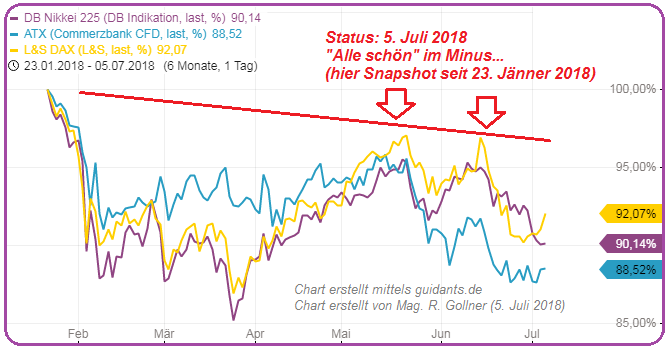
...ein ...
Dow Jones US Technology (Index)
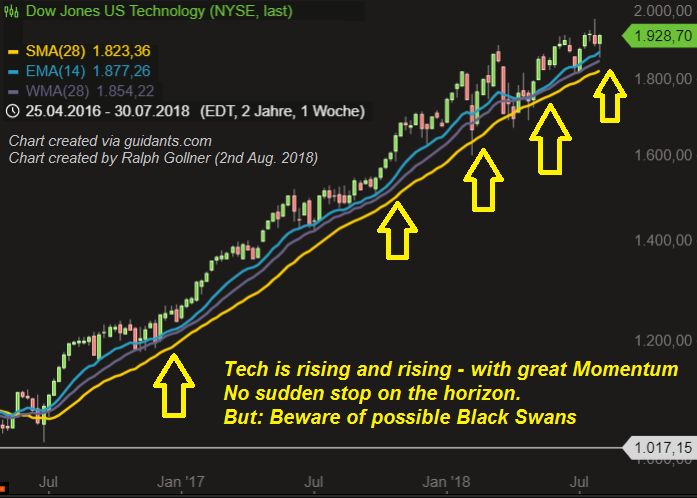
Fascinating strength in a strong-performing Market-Sector (Technology)
Dow Jones schließt heute bei > 26.000 Punkten
Der Dow Jones Industrial Average setzt sich (bekantermassen) aus 30 Werten zusammen. Folgend ein Auszug über die TOP 20 der letzten12 Monate. Wer nicht investiert war, hat wohl Einiges versäumt. Man sieht, sich zumindest den Dow...
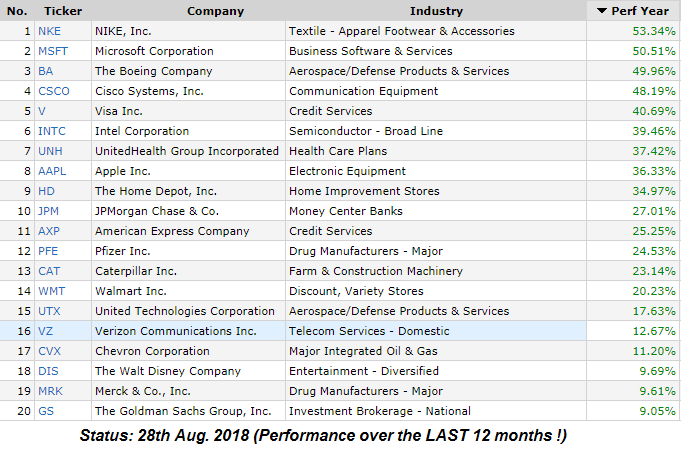
... Jones ...
The Decade of Low/NO RETURNS (2000 - 2013)
The media is so crazy about he rich Stocks-investors getting richer. From the year 2000 until 2013 mostly the Broker were becoming richer by collecting transactions fees from nervous investors.
Therfore one should never forget >> "Investing is ...
DAX, MDAX & SDAX
Von 120 Aktien in diesen drei Indizes haben den Handelstag nur 7 Notierungen im Minus geschlossen!
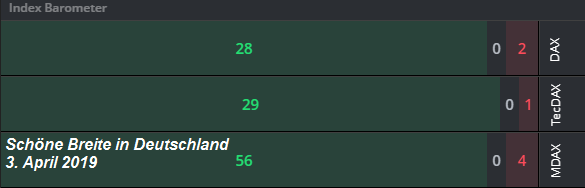
Alle Angaben ohne Gewähr
Das war "STARRK"
Warren Buffet and his
"easy decades"
aka: FAT TAILWIND
Kindergarden-Börse (easy Investing-periods) Die 50er und die 60er im letzten Jahrhundert waren die beiden ersten Dekaden, in welchen Warren Buffet seine Investmentkarriere starten durfte. Lucky shot i guess.
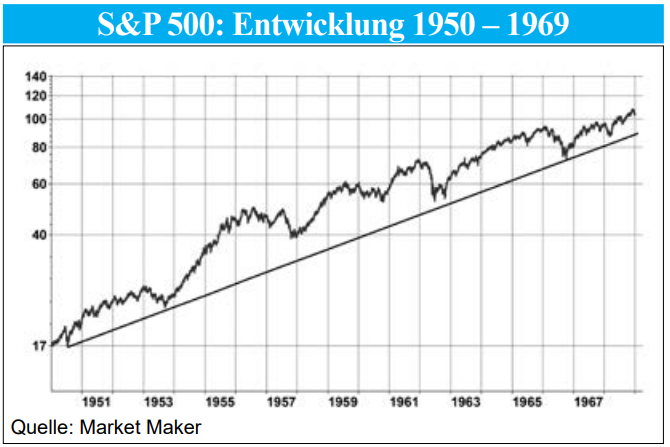
Aber spannend wird es nun ...
Dow Jones Ind. Average (4. Okt. 2019) &
Fibonacci
Was versteht man unter Fibonacci-Analyse?
Leonardo von Pisa, genannt "Fibonacci", einem italienischen Mathematiker aus dem 13. Jahrhundert, verdanken wir nicht nur die Einführung der indisch-arabischen Zahlen und...
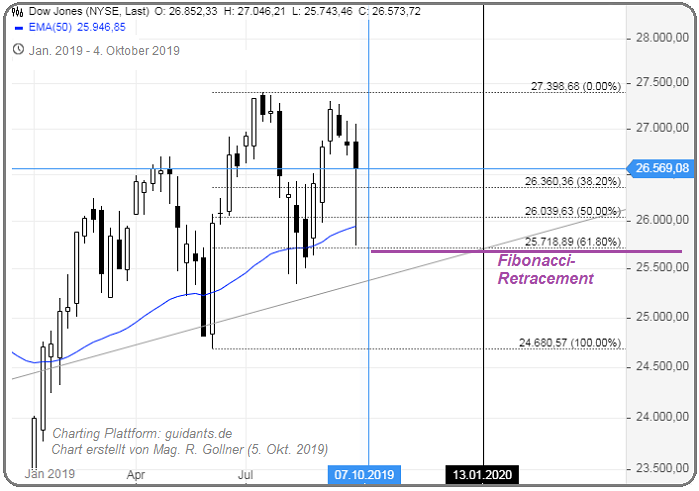
...die ihr zugrunde ...
The 200d Simple Moving Average (SMA)
"3 (or even 4) Standard Deviations above/below the SMA200-daily"
Upfront: Some days ago the S&P 500 reached a psychological level, which was near to its 200-Day Moving Average (SMA-200). So currently the "Mean" of that moving average is not far away:
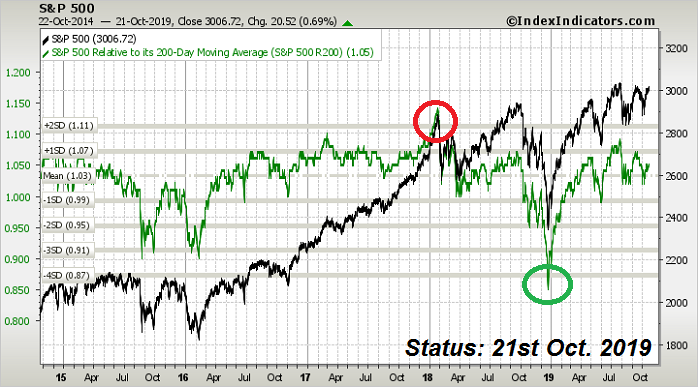
But ...
Momentum is on (Jan. 2020)
The S&P 500 is still on "some" fire. Since Mid-December 2019 the three indicators "Market Momentum, Stock Price Strength & Stock Price Breadth" are on fire (see CNN Fear&Greed-Index, all 3 indicators on fire "Extreme Greed")!
If the S&P 500 can hold the ...
S&P 500, Nasdaq-100 und Dow Jones Industrial Average
Von allen Aktien, welche sich in den 3 US-Aktienindizes befinden, haben heute mehr als 90% schön im Plus geschlossen. Na, wenn das keine good news sind :-)
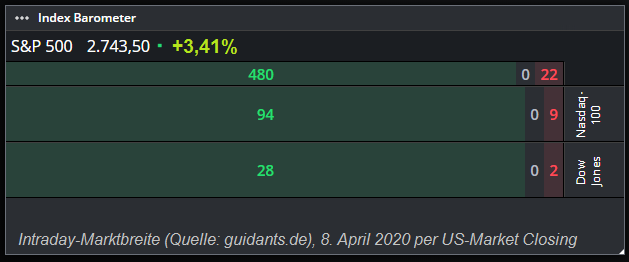
Alle Angaben ohne Gewähr
Das war STARRK
p.s. ich bin auch noch gespannt, ob es ...
Nachtrag und Nachschlag zu letzter Woche
(Freitag, 8. Mai 2020)
Quer über verschiedene Aktienmärkte, sei es nach Geographie oder Investment-Stil, ist der Markt zum Schluß der letzten Woche angestiegen. Eigentlich ein starkes Zeichen der globalen Märkte, sei es der japanische...
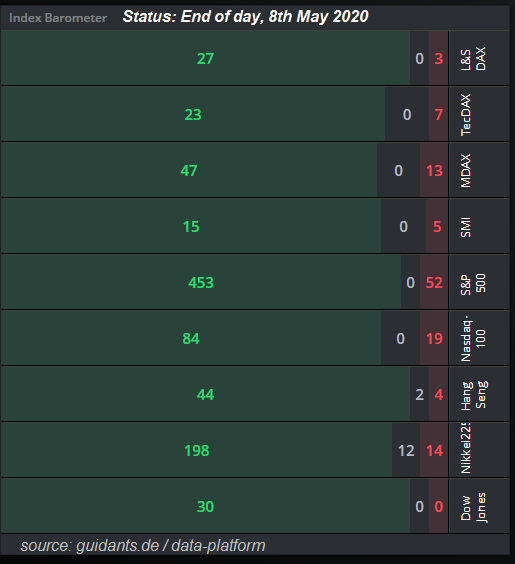
...Nikkei, ...
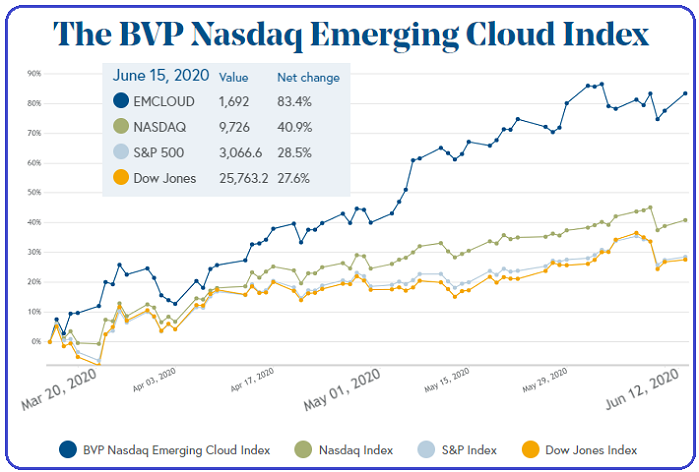
Cloud and some Cloud-companies
The Covid-19 crisis accelerated the short-term and medium-term push towards Cloud-computing. It can be seen immediately when spotting the Bessemer Venture Partners "Cloud Index" (timeframe: 16th March until 15th June):
(HIGH) Inflation & the US-Stock Market
Let's recheck how the Stock Market did in the high-Inflation era (mainly) of the 70s. To begin with, the historical data provided by portfoliovisualizer showed an average inflation number of ca. 9.2% from the years...
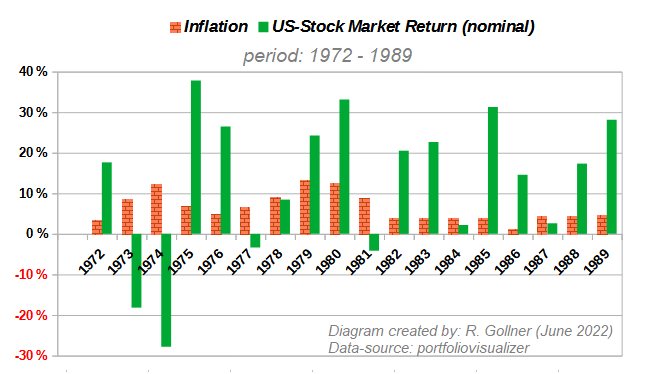
...1973 until 1981. In these ...
(Historical) Stock Market Returns
Many might be surprised to learn, however, that since about 1800, stocks have consistently returned an average of 6.5 to 7.0 percent per year (after inflation). In 2001, the market capitalization of...
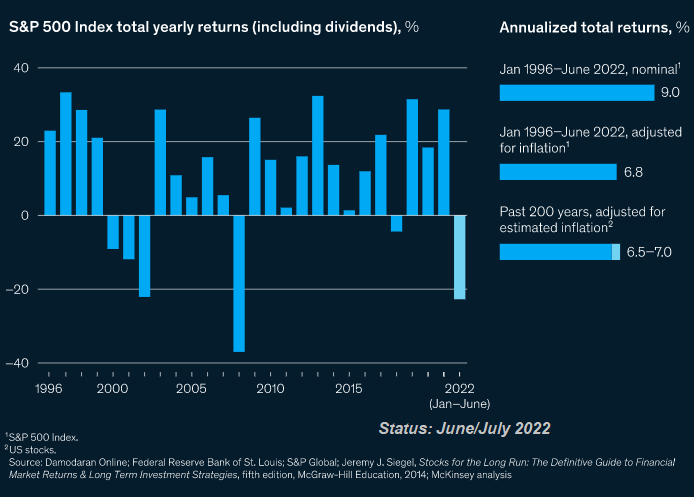
...the companies that made up the S&P 500 was about USD ...
2022 - one of the worst years ever...
While the S&P 500's 18.1% decline was painful, it was only the fourth-worst stock market year in the last 50 years, only half as bad as the 37% decline in 2008, and better than the 22.1% decline in 2002 and 25.9% decline in 1974.
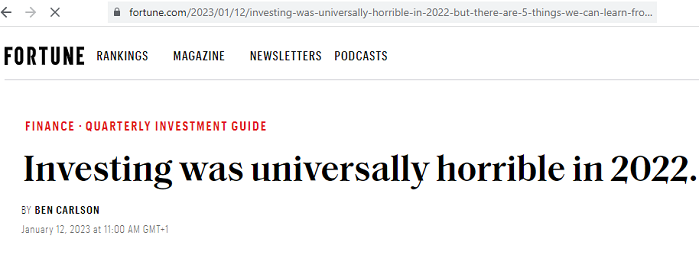 Yet in each of those ...
MSCI World - interessantes Chartbild
Persönlich finde ich den Kursverlauf vom Weltaktienindex "MSCI World" sehr interessant. Relativ stabil kämpft sich der Index seit Jahresanfang Richtung Allzeithoch zurück. Es wird nun spannend, ob der Index sein Level auch über...
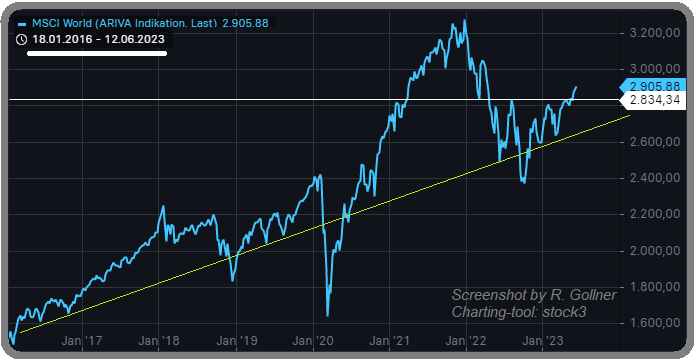
...die Sommermonate ...


