Related Categories
Related Articles
Articles
Dow Jones Utility Average
A bullish signal in U.S. stocks is being issued by an indicator that few investors ever focus on: the Dow Jones Utility Average. That's because this benchmark which was created 88 years ago, in 1929, is thought to be a leading indicator...
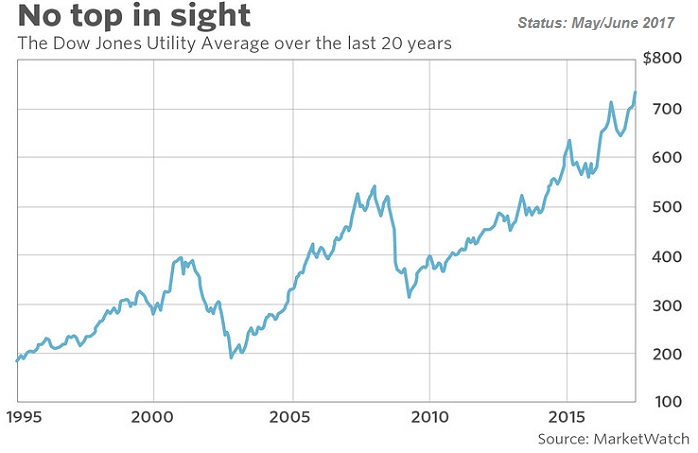
...of tops and bottoms in the broad equity market. And, by virtue of hitting an all-time high last week, it is suggesting that the market still has further to rise.
How much further? Kelley Wright, editor of the Investment Quality Trends newsletter, says the "the DJU [historically] has tended to bottom and top three to six months before the Dow Industrials." If the future is like the past, therefore, the DJU's new high means that the earliest the broad market would top out is the last quarter of this year.
So the picture the Dow Jones Utility Average is painting is of near-term strength and long-term weakness. Let's hope the stock market over the next 12 months does even half as well as it has over the past year.
link:


