Related Categories
Articles
Oktober 2018
(vor der Tür)
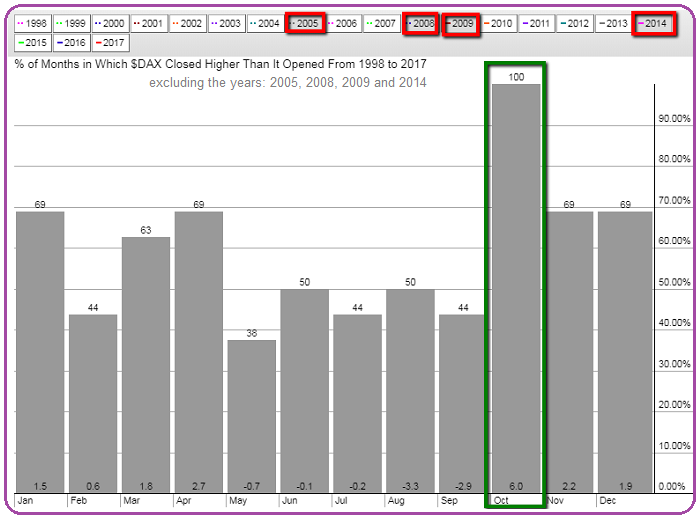
In den letzten 20 Jahren gab es in 16 Jahren einen positiven Oktober für den deutschen Aktienmarkt (DAX). Schauen wir mal, was der Oktober 2018 so bereit hält..
LG Ralph
Related Articles
statistics over the period 2005 to 2014 (as per May 2015)
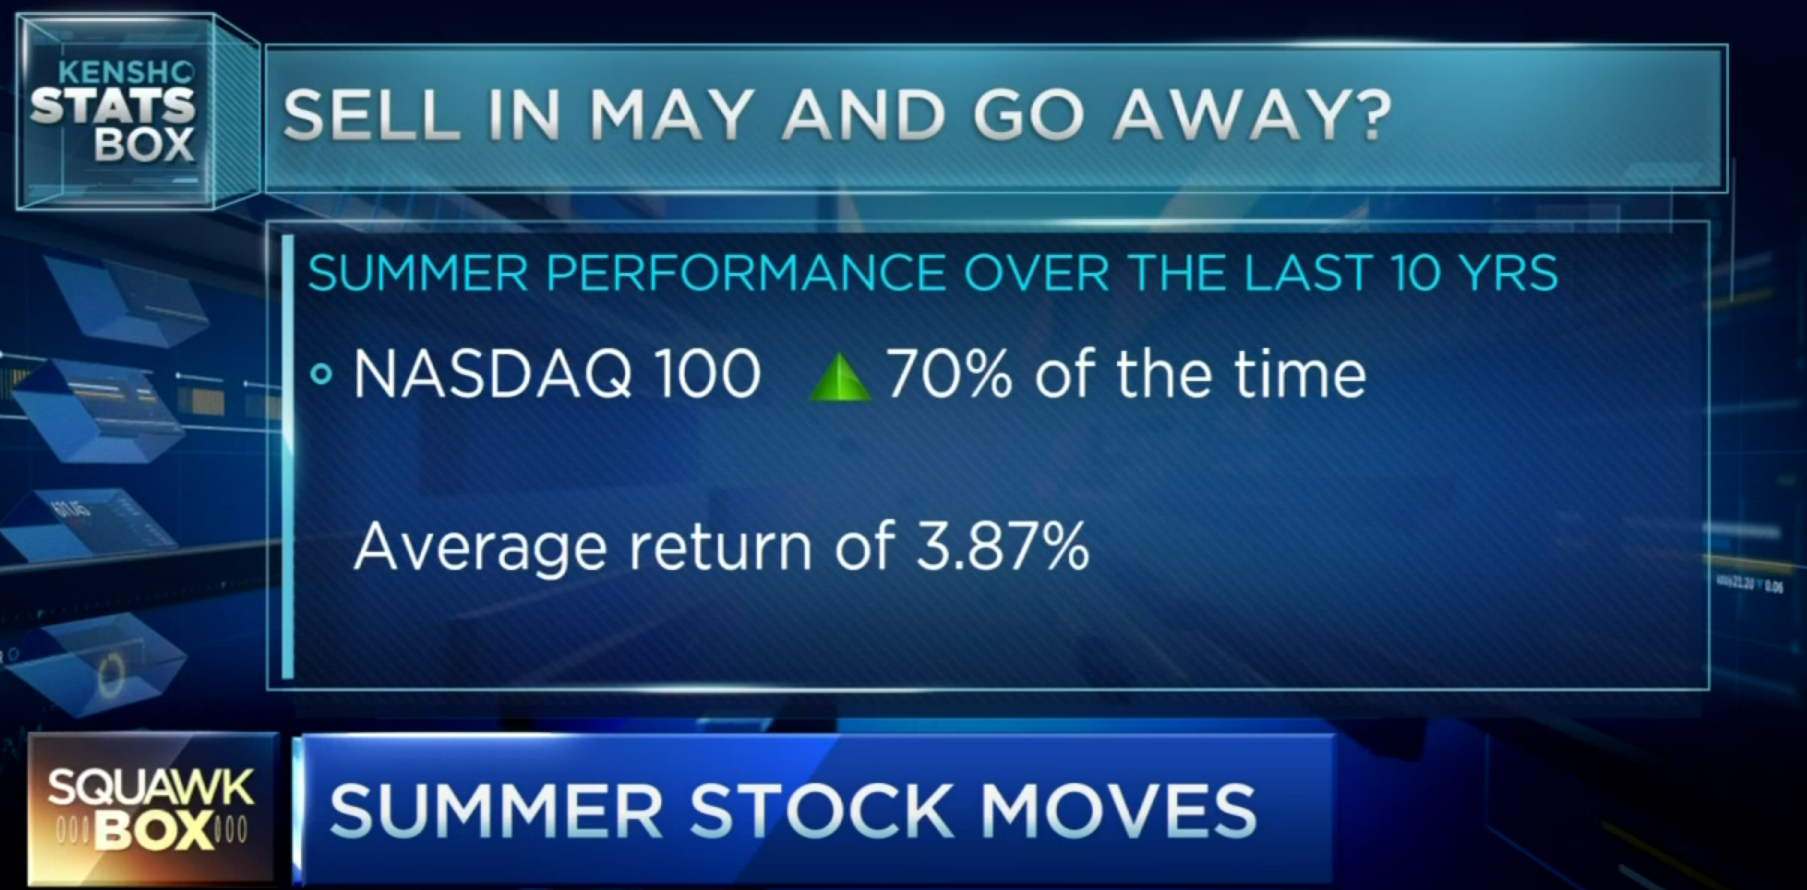
check out the whole video here on CNBC: http://video.cnbc.com
Are Monthly Seasonals Real? (A Three Century Perspective)
statistics over the period 1693 to 2009
In 2012, Ben Jacobsen and Cherry Y. Zhang from Massey University (New Zealand) wrote very interesting articles. Compiling available data since 1693 in 108 countries, they claim that not only the ...
Seasonality / July for 3 selected BIOTECH-stocks (as per 13th July 2015)
monthly gain(loss)/average Statistics as per equityclock.com (as per June 2015),
**20 years-history (only 4years-cycle years used: 1995, 1999, 2003, 2007, 2011), source: stockcharts.com
**xy% probability = % of months in ...
What follows a negative performance in the month of August in the S&P 500?
The S&P 500, together with the global financial markets being in turmoil for around one week already (staus as per 27th Aug. 2015 after market close) may end the month of August with a negative performance.
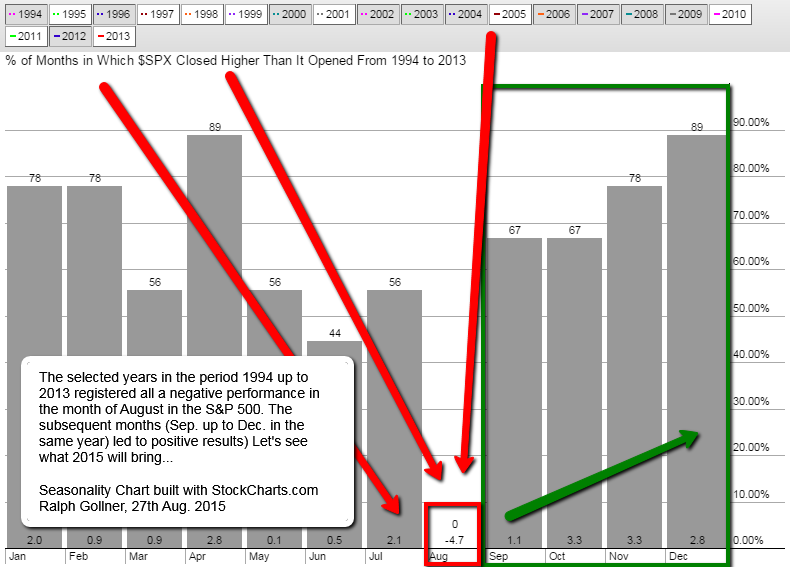
As the ...
Selected sectors starting their positive season later in Sep. or Oct. (Seasonality calculated up to 2008)
source: http://www.seasonalcharts.de
The best six months for stocks is ?
Odds are that the Halloween Indicator may be especially good for the stock market this year. But before starting this article (source: marketwatch.com), take a look at the history in the S&P 500 period: 1950 up to the year 2010.

It is obvious, that there ...
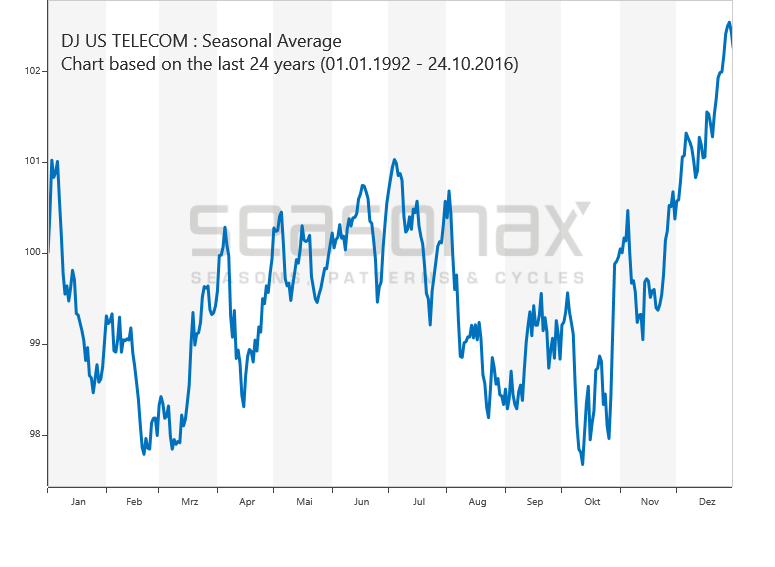
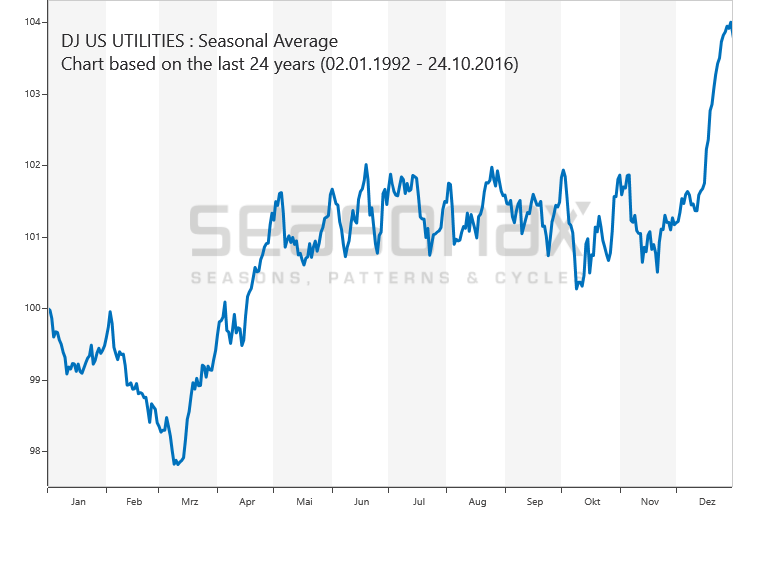
Sector Seasonalities (refocus Oct. up to June)
Following the history of seasonalities up to May 2012 (15yrs-history) each market-sector has its "season" to stay LONG (buy & hold stocks) or short ( = "better reduce ones exposure in equities of these sectors during that period").
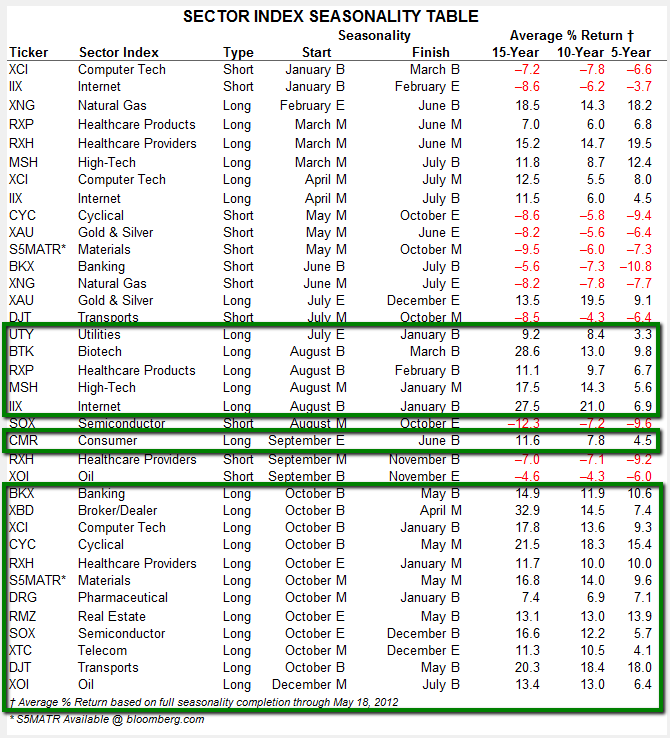
"History ...
Last 2 months of the year / SANTA RALLY
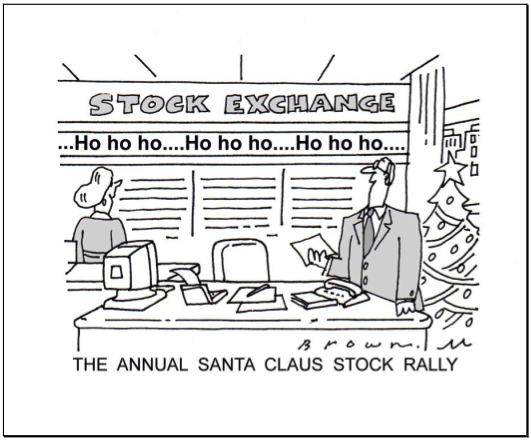 Since the 31st Dec. 1945 the S&P 500 rallied in over 77% of the time in the final two months of the year to reach an average gain of 3% in that short period. These odds are pretty good i may say. To put this into perspective: If you were to invest every ...
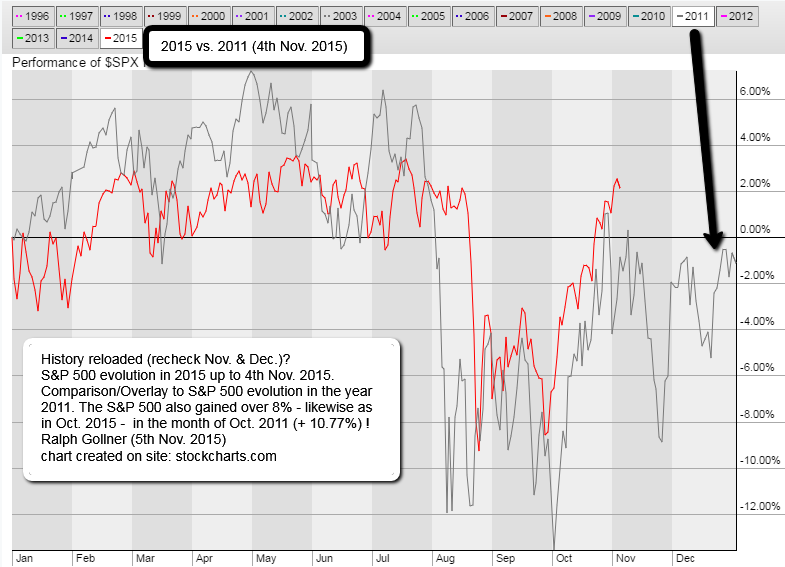
S&P 500 2011 versus 2015 (4th Nov. 2015)
(bessere?) 6-Monatsperiode (histor. Auswertung US-Aktien)
Die Jahresendrally findet seit Jahrzehnten satt. Hier soll es nun nicht nur um die Jahresendrally von Oktober bis Jahresende gehen, sondern um den 6-Monatszeitraum von Oktober/November bis März/April. Diesem Halbjahr wird nachgesagt, ...

upfront / direct link: http://www.equityclock.com
Next week (starting 23rd Nov. 2015) is Thanksgiving in the US and investors should know about the equity market tendencies during this period. With less activity surrounding the Thanksgiving holiday on Thursday, stocks have a tendency of ...
S&P 500 (last weeks of the year/Dec.)
Over the past 12 years, the S&P 500 has uniformly stayed positive for the final 30 trading days of the year, as Ryan Detrick, a Cincinnati-based portfolio manager and strategist, detailed:

source: http://ryandetrick.tumblr.com
Also, in 11 out of the 10 ...
Santa Claus Rally (different stock styles)
On average since 1927 (up 'till Dec. 2014), November and December have been consistently kind months to stocks across the board — growth and value, dividend payers and non-dividend stocks. (Michael Brush / marketwatch)

Dow Jones Xmas-New Year Rally (History 1896 - 2014)

As one can see from the chart above, December’s average return is higher than that of many other months. Since 1896, when the Dow Jones Industrial Average was created, for example, the Dow has gained an average of 1.4% in December, in ...
Seasonality Dec./Q1-2016 possibilites (?)
Seasonality refers to particular time frames when stocks/sectors/indices are subjected to and influenced by recurring tendencies that produce patterns that are apparent in the investment valuation. (source: www.equityclock.com)
Tendencies can range ...
Santa Claus Rally (one) definition
The stock market rallies at some point during December. This is the most commonly used definition, and the least precise...
above the daily updated EMA-"Melange" of the last quarter (Dow Jones Industrial Average)
And, without such precision, it is somehow ...
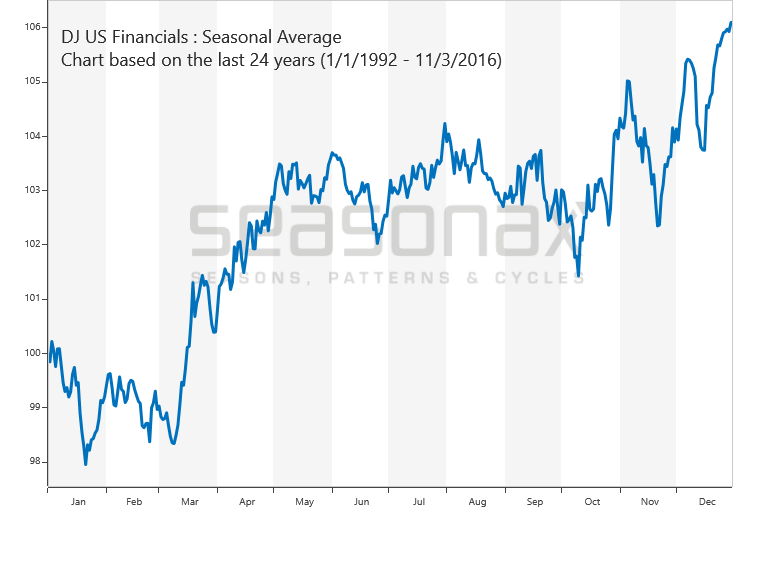
Seasonality/Integrated Oil & Gas Industry Seasonality
Basis is the timeframe/period 20 year-range ending 31st Dec. 2015;
Important, that the Oilprice, as underlying indicator for the industry, stays above - at least 27 USD - for a prolongued time...

March Seasonality (Dow Jones Ind. Average)
Especially over the last 20 years (also over 50 years), the month of March has been a quite good month for stock-investors (Status as per Dec. 2014):
 source: http://www.marketwatch.com
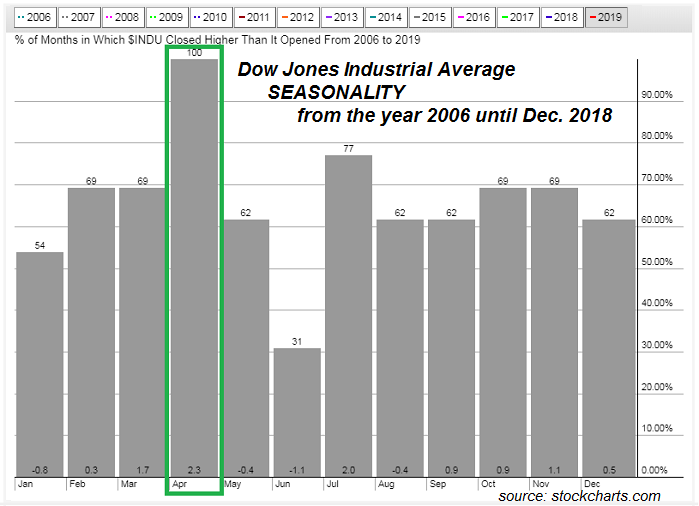
April Seasonality (2016)
well, it doesn't really look that bad :-)
After a strong month of March (>6%), there may be reason to expect another solid return in April. Over the past 50 years, the S&P 500 Index has realized a gain in 70% of Aprils, averaging a return of 1.5%:

The average gain ...
US-Election year (June looks nicer than May...)
historical wrap-up
Does this year -being a presidential election year- provide reason to bet that the "sell-in-May-and-go-away" pattern will be any less pronounced than in other years. Maybe a historical wrap-up will help solving this question?
 ...
...
US-election years (Pre-months)
If you want to get a feel for how the US presidential election will play out, then Byron Wien, Blackstone's vice chairman, has a suggestion: Look at stocks. Reminder: On the 8th Aug. 2016 the S&P 500 stood @ ca. 2,180 points.
Since the 1920s, the incumbent ...
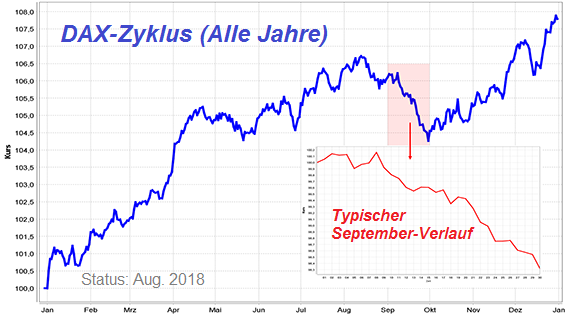
DAX Sep. & Okt.
60er-Jahre bis inkl. 2015 (Historie)
Originalartikel von Andreas Sommer; Der gelernte Bankkaufmann war 10 Jahre Wertpapierberater bei einer Bank und hat über 30 Jahre Börsenerfahrung. In einer seiner Datenbanken wertet A. Sommer die Monats-Schlusskurse des...
...
Last 12 weeks of the year (Dow Jones, S&P 500)
Using data going back to the creation of the S&P 500 in 1957, technical analyst John Kosar of Asbury Research found that "the fourth week of October, which is coming up soon, is seasonally the weakest of the entire fourth quarter."
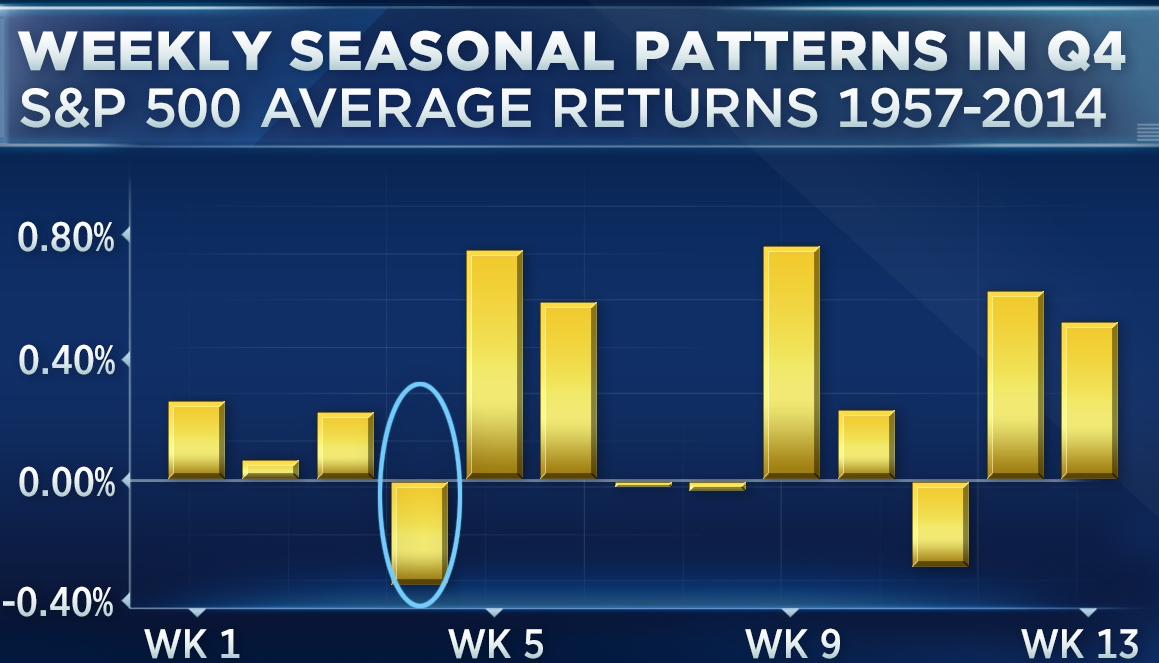 source: ...
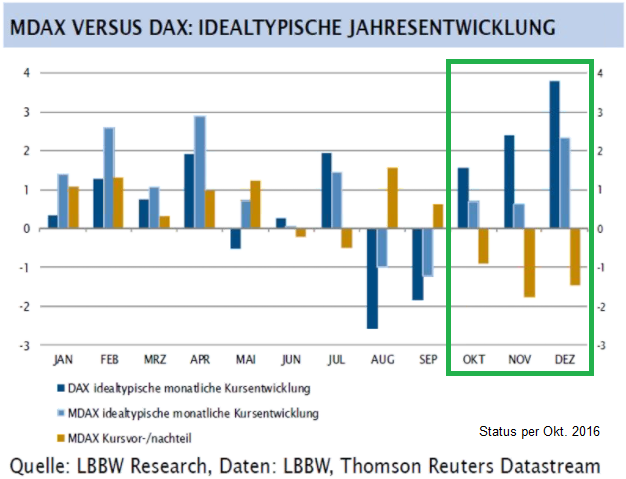
DAX-Aktien versus MDAX-Aktien(Q4-Fokus)
Es ist im folgenden Schaubild klar zu erkennen, dass es im Q4 beim DAX-Index zu einer Outperformance der DAX-Aktien gegenüber dem MDAX kommen kann. Theoretisch und aus der Historie heraus, die Praxis muss dies jedoch erst zeigen:
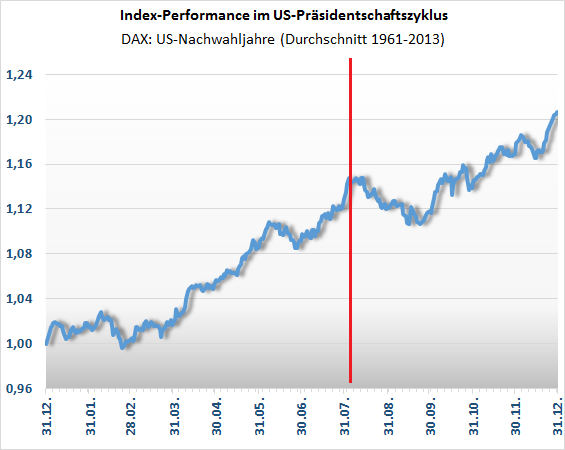
Dow Jones Ind. Average (Nov. - April - "nice" Season)
versus Mai - Oktober
Einmal pro Jahr erreicht der Aktienmarkt sein - aus statistischer Sicht - bevorzugtes Einstiegsfenster. Der folgende Chart zeigt den statistischen Durchschnittsverlauf des Dow Jones Index seit 1946:
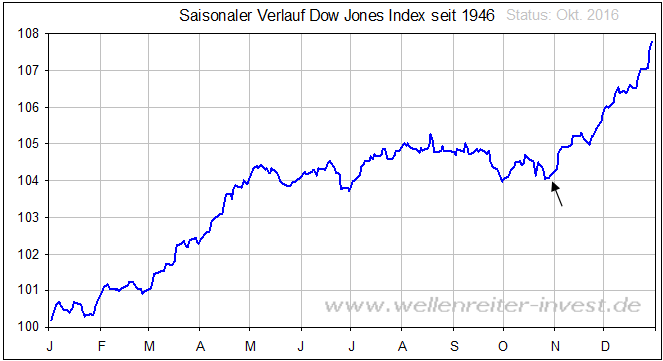
Das Fenster öffnet ...
Value stocks "often" sparkle
in a new president's first 100 days
On average, the so-called value premium is more than 10 times stronger in a president's first 100 days than the rest of the time. If you've ever wanted to tilt your portfolio toward value stocks, the next 75 days might be...
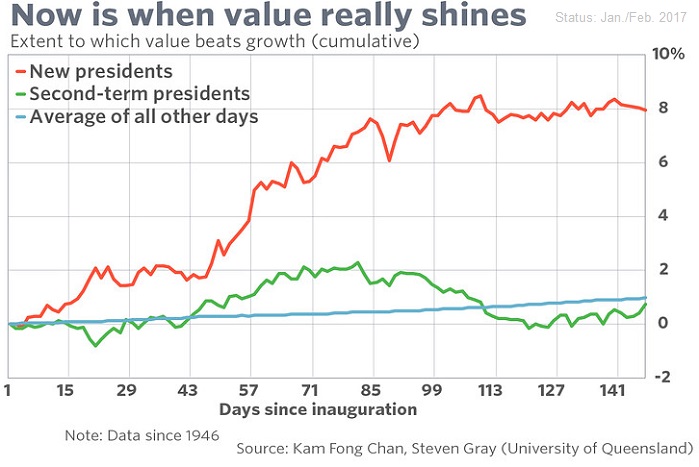
...
Jan. & Feb. UP in the S&P 500
(Status: 7th March 2017)
This bullish stock signal has never been wrong - and the Signal is green since 1st March 2017! CFRA's Sam Stovall notes one interesting indicator got triggered by the last trading day of Feb. 2017.
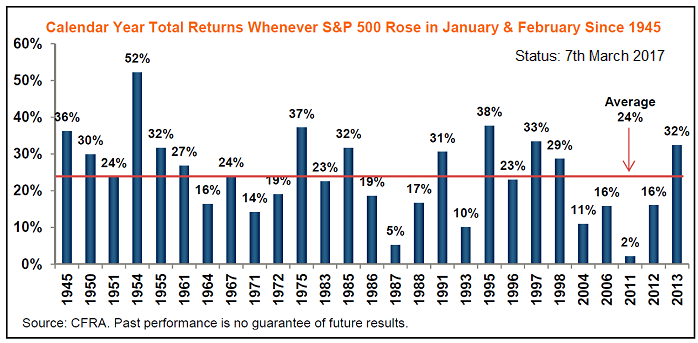
"If you need additional encouragement ...
Sector Performance by Calendar Month
(focusing on April)
The Trading Calendar presents full-year and monthly cumulative performance profiles for the overall stock market (S&P 500 Index) based on its average daily behavior since 1950.
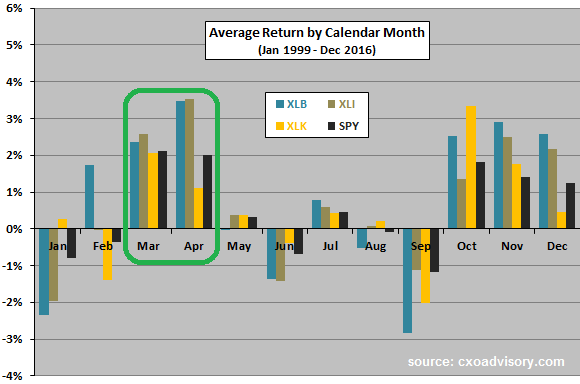
How much do the corresponding monthly behaviors of the ...
Seasonality-Charts (DOW, DAX)
Der DAX, der DOW, aber auch Einzel-Aktien unterliegen häufig saisonalen Schwankungen. Es ist höchst interessant und lukrativ zu wissen, welche Monate für welche Aktie eher bessere Einstiegsmonate sind und welche man vielleicht meiden sollte.
 Quelle: ...
Don't be fearful, but stay cautious !
July - December returns for years ending in 7 have been dismal; Dana Lyons, a partner with J. Lyons Fund Management, recently noted that the performance of the stock market in the second half of years ending in 7s has been among the most dismal:
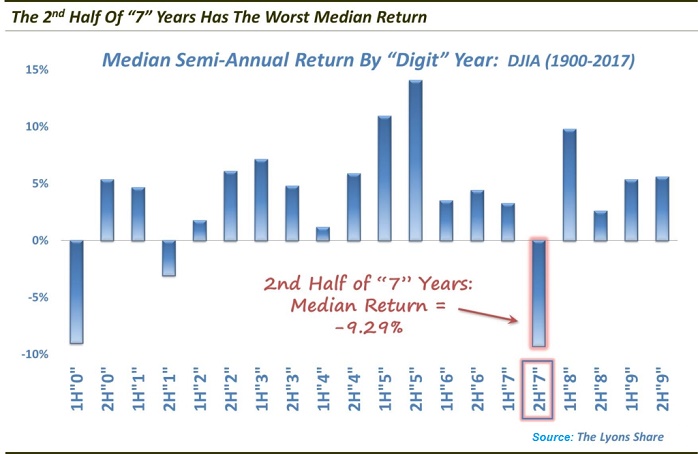
...
One phenomenon of note is the performance during
"Octobers of years ending in 7"
Is October of year 7 just one more statistical quirk, or is there information that investors need to protect themselves? Take a look at the results and judge...As you can see in the following Table,...
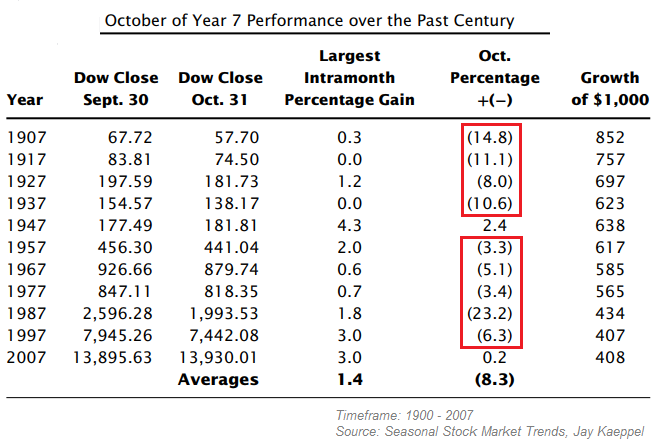
...the ...
DAX-Saisonaltität (Backtest 1970 - 2017)
Mit dieser saisonalen Börsenstrategie konnte bisher (!) eine beachtliche Rendite erzielt werden und man konnte so auf einfache Art den DAX schlagen. Und das Beste, man musste dabei nur zwei Mal im Jahr handeln. Eine Rückrechnung...
... dieser ...
September (aaah)
For investors who are fearful of using market timing but still wish to maximize returns, the idea of sitting out September each year might sound like a strange idea to you, but might be a pretty good trade-off between simplicity and profit maximization. The two...
...
Please look at this video...
Dec. 1st half versus Dec. 2nd half (Seasonality - History)
Kensho is back and helping us out !
Seasonality of European equities in Dec. (more specific: 2nd half of December). What to do from this Friday, 15th Dec. 2017 onwards? Historical check from the year 1990 onwards; Check out this short video:
How important is January to the stock market?
(Stats-article from the year 2016)
Robert Sluymer, a technical analyst at RBC Capital Markets, noted that some consider the first trading day, week and month to be significant indicators of the year ahead. He looked back at the performance of...
...
Seasonal Anomaly
(TOM-Effect)
Lakonishok and Smidt (1988) coined the phrase the "turn-of-the-month effect" to describe the unusually high returns earned by DJIA equities over the four-day interval beginning with the last trading day of the month and ending three days later. Their...
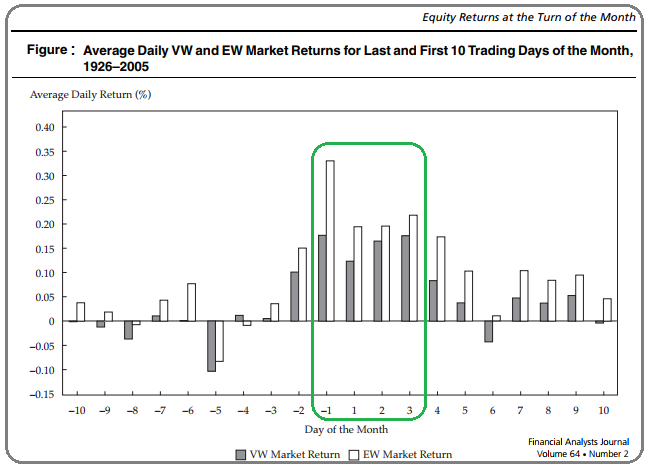
...study ...
2nd Half of April (2018), "Dow-Seasonality"
Let's prepare ourselves (why not?) for a better 2nd half of the current month, being April 2018. I am -more precisely- speaking about the Dow Jones Ind. Average (& its 30 components). Please recheck its relative strength versus...
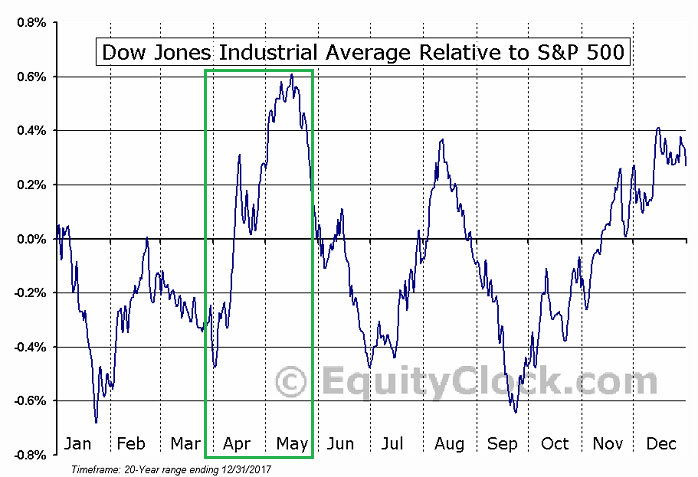
..."his broader" ...
"Have a Vision"
(Midterm-Election and S&P 500-Seasonality)
Nun, ich bin folgend der letzten Wochen etwas defensiver aufgestellt mit dem ECHT-Depot (Aktien-Investments hauptsächlich). Dies habe ich durch eine Reduktion der Aktienquote erreicht. Im folgenden Chart sieht man...
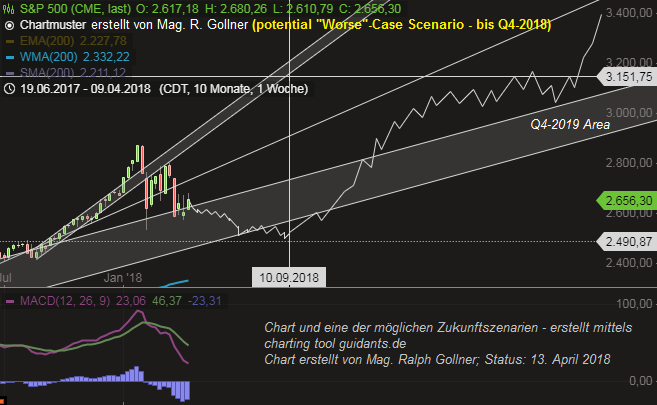
...(nur) EIN! ...
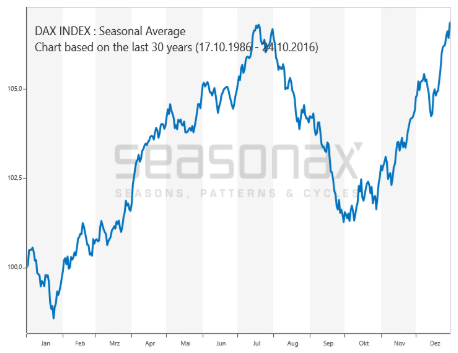
DAX-Saisonalität
(Stay until July ?, somit: "No Sell in May & Go Away"?)
Die Saisonalität des deutschen Aktienmarktes seit 1974 ist ausgeprägt. Deutlich ist ein Haupttrend sichtbar, der Ende September begann, am 2. Mai ein erstes Hoch ausbildete und im Juli endete. Dazwischen war im Mittel...
 ...
...
DAX & MDAX -Seasonality Strategie & Backtest
(1988 bis Mai 2018)
Das Phänomen der Jahresendrally gilt vor allem für die Börsenelite aus dem DAX. Wenn Anleger auch die Aspekte des "Size-effects" und der Seasonality zusammenführen, ergibt sich eine "saisonale MidCap_und_DAX-Strategie". Zu...
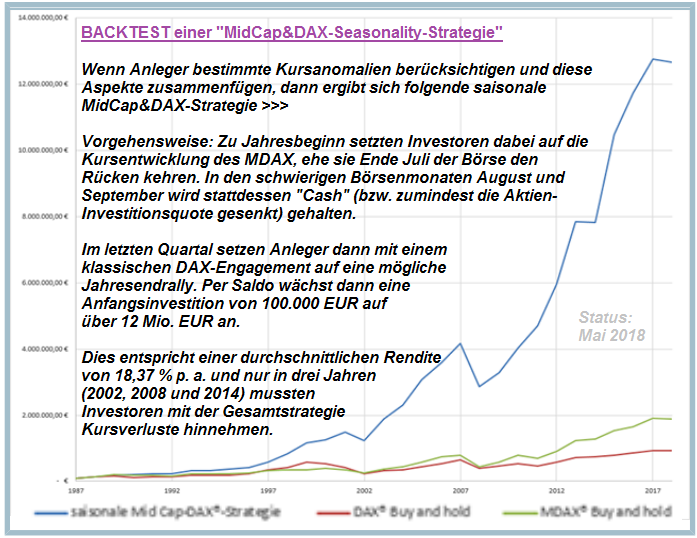
...
Magic Period Aug. 2018 - Year-End 2018
(?)
According to analysts at Bespoke Investment Group, if the market gains from April through July, stocks almost always finish out the year higher and despite Monday's weakness, it's looking good for the S&P 500 (today).
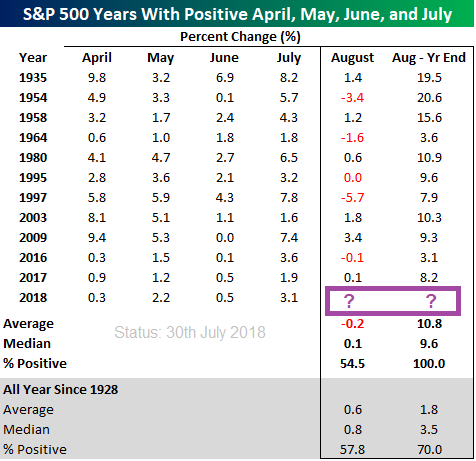
"[...] this will mark the ...
DAX im August (Historie bis 2017)
Nun im August hat einer der schwächsten Monate im Jahresverlauf begonnen. In den vergangenen zehn Jahren fiel die Monatsbilanz sechs Mal negativ aus. Eine vergleichbar schlechte Quote weist nur der Juni auf. Die Durchschnittsperformance...
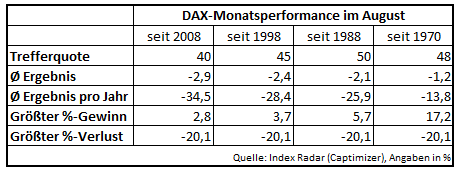
...liegt bei ...
Midterm-elections
in Nov. 2018 (& the Stock-Market, Fin. Markets)
The eye-catching stats: in the 12 months following every midterm ballot since 1945, the S&P 500 has posted average returns of 15%. What a Midterm-election may mean for the markets: Even if the Democrats regain the House in...
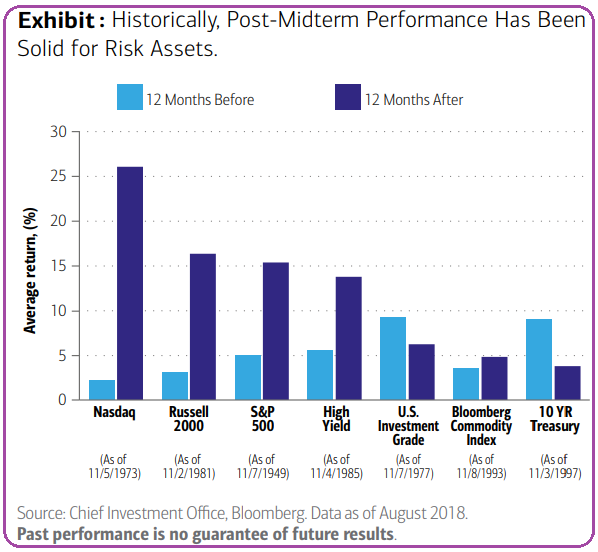
...
3rd Sep. until 30th November
Over the past decade, the one-month period from Tuesday's close (21st Aug. 2018) has been among the strongest for equities, according to analysts at Bespoke Investment Group. "We're (now) entering a period of the calendar year that has...
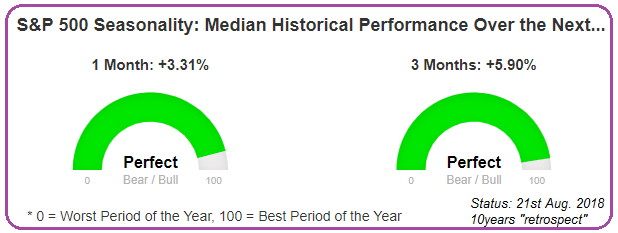
...been exceptionally ...
Das saisonale Preisverhalten beim Dax
Unter einer saisonalen Preistendenz versteht man die Neigung eines Marktes, sich im jahreszeitlichen Rhythmus in eine konkrete Richtung zu bewegen. Vergleichbar mit den vier Jahreszeiten, wo z.B. Im Sommer mit erhöhten Temperaturen gerechnet...
...
Upcoming October (2018)
German DAX & US-Stock Market
Historically speaking, the Dow Jones Industrial Average rises an average of 0.6% over the month of October, a move that makes October the seventh-best of the year. Over the past 67 years, October has been...

DAX-Statistik
Quelle Prime ...
Seasonality Q4
(let's recheck the statistics for the ongoing/upcoming Q4-2018)
From a closing-level of ca. 2,900 points in the broad US-Stock Market Index S&P 500 a rise of ca. 4.75% until the end of the year would mean a closing-level > 3,000 points as per December-end 2018.
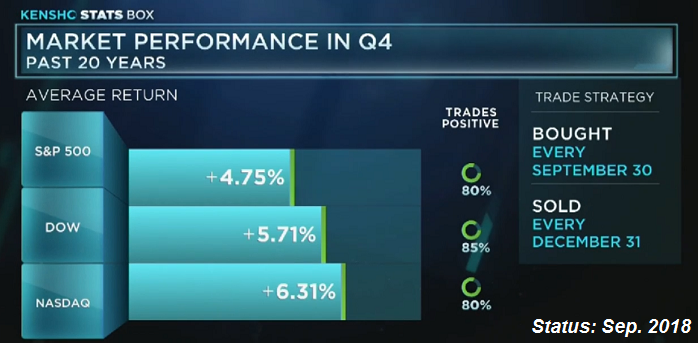
Let's see
Cheers ...
Seasonality
Final 2 months of the year
Since 1980, stocks tend to surge into the new year. The Dow and Nasdaq lead, each gaining about 3.4 % in the two-month stretch to close out the year. The S&P jumps about 3 percent, trading positively 74 % of the time. Among the top performing...
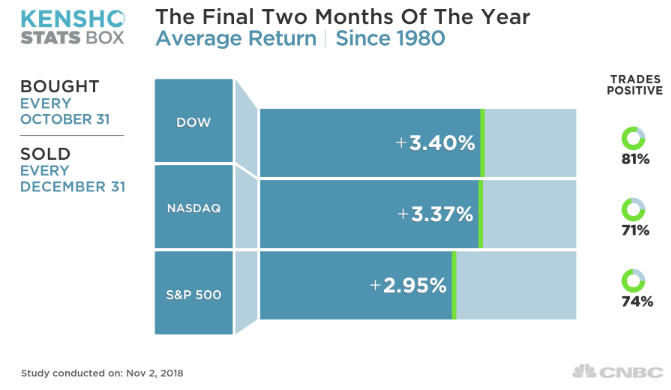
...
S&P 500 (US-Midterm elections)
Status: 5./6. November 2018
In den kommenden Tagen und Wochen werden wir mitverfolgen können, ob die US-Midterm elections den US-Aktienmärkten den nötigen Schub für einen bullishen Verlauf folgend der klassischen Saisonalität geben...
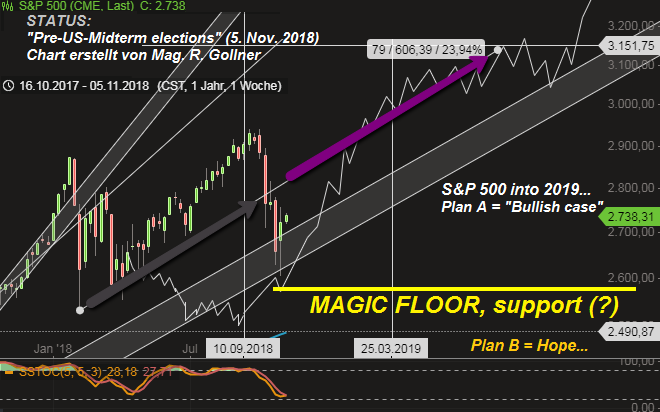
...können, oder es gar ...
Kursanomalien
("Hier eine Neue")
Hier eine Anomalie, welche wohl so an den Märkten noch nicht so stark verbreitet ist und Anlegern deshalb einen entsprechend hohen Nutzwert bringen könnte: In den so genannten Zwischenwahljahren (die "Halbzeitwahl" zwischen...
...den Präsidentschaftswahlen in ...
DAX-Seasonality (Intrayear-summer-DRAWDOWNS)
SELL IN MAY Phasen seit dem Jahr 2000 in %; Wie weit fällt der DAX von einem markanten Hoch, welches nach dem 1. Mai des jeweiligen Jahre ausgebildet wurde:
2000: -10 %
2001: -44 %
2002: -50 %
2003: -10 %
2004: -11 %
2005: -7,2 %
2006: -14 %
2007: -11 %
...
Tough Q4-2018
Well, after severe losses in Q4-2018, the US-Stock Markets face an interesting year 2019. Here one can see, how the US-Small Caps thrived in the year after such a downfall:
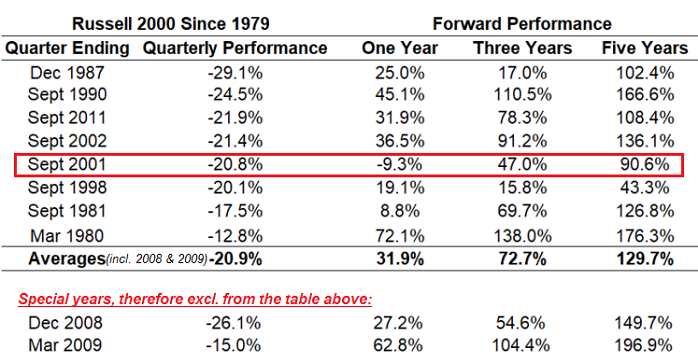
Everything seems possible!
(I marked the year 2001, since I still believe that the markets were extremely ...
Seasonality
April (U.S. Stock Markets)
S&P 500 in the month of April-Statistics (period: 2013 - 2018)
----------------------------------------------------------------------------------
year 2018 +0.55%
2017 +1.11%
2016 +0.42%
2015 +0.86%
2014 +0.53%
2013 +1.81%
link (monthly stats for S&P 500 >> ...
Saisonalität: Der Charme des 1. Monats im Quartal
Der 1. Monat eines Quartals liefert deutlich bessere Ergebnisse als der zweite und dritte Monat! Beim DAX wären aus einer Anfangsinvestition von 1 EURO - jeweils angelegt im 1. Monat eines...
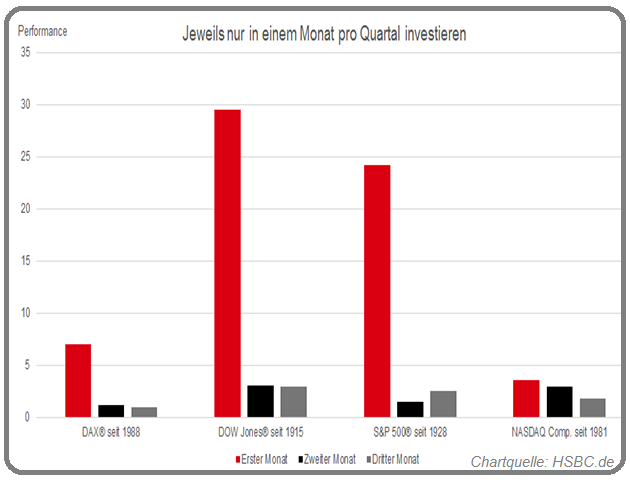
... jeden Quartals seit 1988 - 6,97 EURO ...
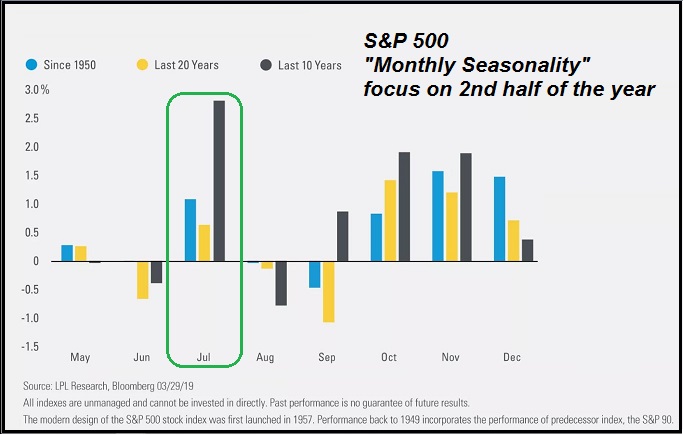
Bald beginnt das 2. Halbjahr
(Stichwort: Monat-Juli Saisonalität, bzw. 1. Monat im Quartal-Effekt)
Ich bin recht guter Dinge, wenn ich jedoch auch eher schon länger auf das Q4-2019 schiele. Aber dennoch: Ein starker Start in das Q3-2019 wäre doch auch passend zum heissen Sommer in Europa :-)
 ...
...
Seasonality in an U.S. Midterm-Election year
Let's remember, as bad as things may seem, statistics in on the side of investors. The average midterm year – like this one – is typically down as of 5th October. It finishes, however, up 6% on average. Further good...
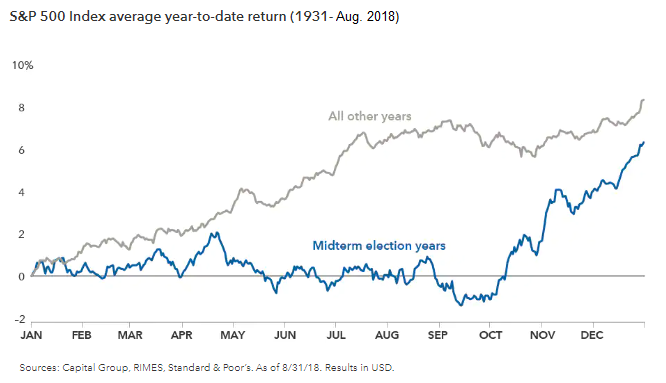
...prospects (Spoiler: ...
Dow Jones (Election Year Seasonality)
According to the 2021 Dimensional Funds report, the market has been favorable overall in 20 of the 24 election years from 1928 to 2020, only showing negative returns four times. When you further examine the years between elections,...
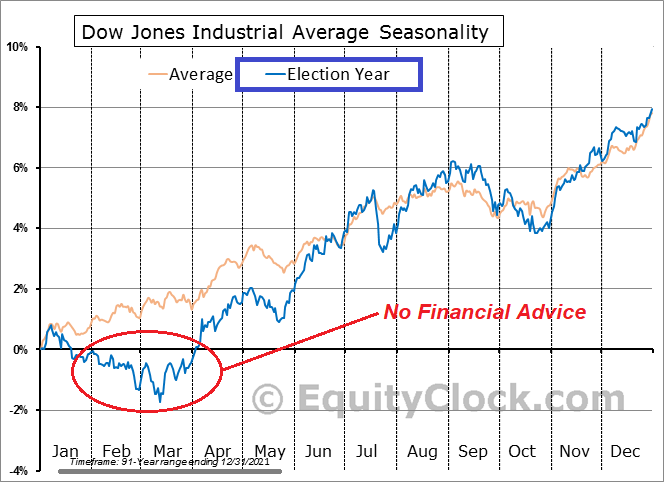
...however, it ...


