Related Categories
Related Articles
Articles
US-Election year (June looks nicer than May...)
historical wrap-up
Does this year -being a presidential election year- provide reason to bet that the "sell-in-May-and-go-away" pattern will be any less pronounced than in other years. Maybe a historical wrap-up will help solving this question?
 source: http://www.marketwatch.com
The May-through-October period is the seasonally least favorable period for the stock market. During this period one year ago, for example, the S&P 500 SPX, fell 0.3%.. ut if this seasonal pattern is less pronounced in presidential election years, investors otherwise tempted to “sell in May and go away” might be better off maintaining their equity positions.
The monthly results in the chart above show that past election-year strength is due almost exclusively to August: The DJIA has gained 2.8% in the average election-year August, versus 0.5% in the Augusts of all other years - a spread of 2.3 percentage points in favor of election years. Without this big August spread, in fact, there would be little difference in the average May-through-October results in election and non-election years.
The bottom line of the DJIA-Diagram: This year (2016) being a presidential election year provides precious little reason to bet that the "sell-in-May-and-go-away" pattern will be any less pronounced than in other years. (so the saying of Mark Hulbert)
From this starting point (Dow Jones/Long-Term History since its inception in 1896), one should also check out other sources like the S&P 500. In this regard Jeff Hirsch laid out a great comparison of the monthly developments in a chart starting from 1952 for each of the election years:
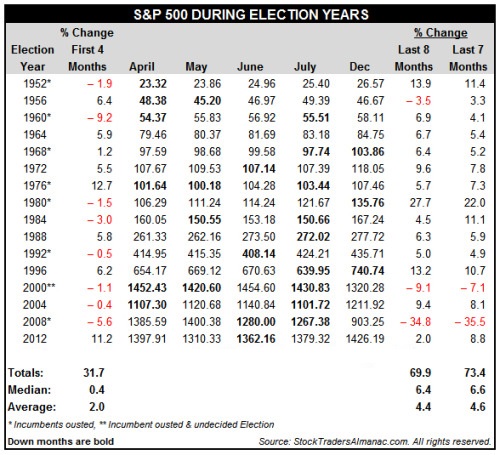
One can clearly see, that the LAST 7 MONTHS of the year (June - Dec.) have a high 73.4% chance of producing a positive performance in that period (see line "TOTALS"). As of today (3rd May 2016) this would mean, staying defensive in the month of May, but looking forward to a positive return starting in June 2016 (IN THEORY ; -).
I also checked out a survey by UBS, which made a computation from the year 1932 onwards (S&P 500) for all the months in an US-election year:
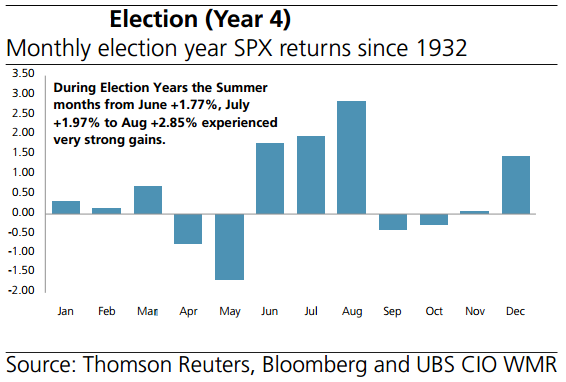 source: UBS-study
cio-wealth-management-research-the-us-presidential-election-year-cycle-study-2013
Conclusion for the UBS-Chart above: Stay cautious in May!
Furthermore I was digging into the data provided by equityclock.com, who managed to gather all performance-data from 1952 onwards in the S&P 500 between the period: May - Oct in each year. I extracted the data only for the US-election years and come up with following result (watch out for the "missing" year 2008...):
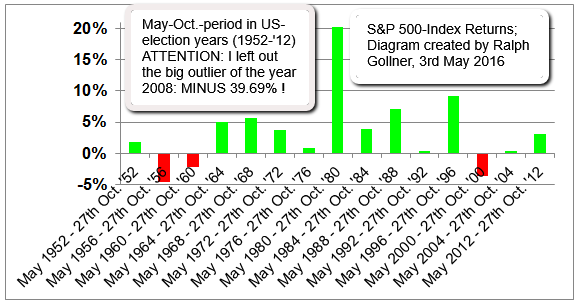
My conclusion for the last 16 US-election years: 12 times positive outcomes for the 6-month-period versus 4 times negative outcomes leaves a positive percentage of 75% of having a positive 6-months-period (in theory ;-).
historical S&P 500-returns from 1952 onwards (May-Oct-periods): http://www.equityclock.com/2016/05
historical stock-returns from 1928 onwards: http://pages.stern.nyu.edu
Mark Hulbert-Article (May 2016): http://www.marketwatch.com


