Related Categories
Related Articles
Articles
Bull Market Length (Definition)
Short reminder: from May to October 2011, the Standard & Poor's 500 Index fell 21.6 percent. Upfront: One may argue that the best starting date of a new bull market is when the prior bull-market highs are eclipsed. That is how how one gets a date like...
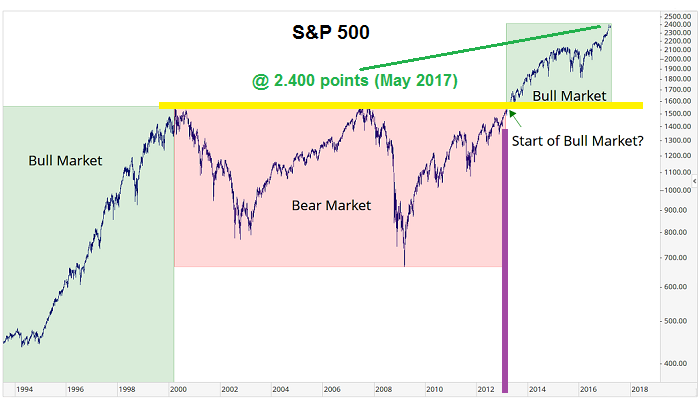
...1982 as the start of the last secular long-term bull market. And it is also how one gets to March 2013 as the start date of this bull market, when the S&P 500 topped the earlier high of 1,565 set in October 2007.
Regarding the (US !) Small-Caps:
During that same May-October period, however, the Russell 2000 Index fell 30.7 percent. To claim this wasn't a short-term bear market in the context of a long-term secular bull market seems like a stretch if you're using the 20 percent definition.
Furthermore:
Please also consider the period running from mid-2015 to early 2016. Michael Batnick (Head of Research @ Ritholtz) argues that this "absolutely was a bear market." Here are the peak-to-trough numbers from that period:
♦ Median S&P 500 stock down 25 percent (the index itself fell 15 percent)
♦ Russell 2000 down 27 percent
♦ Japan stocks down 29 percent
♦ Dow Jones Transportation Average down 32 percent
♦ Emerging-market stocks down 40 percent
♦ Chinese stocks down 49 percent
♦ Small-cap biotech stocks down 51 percent
♦ Crude oil down 76 percent
♦ New York Stock Exchange new 52-week lows were at their highest point since November 2008; 80 percent of S&P 500 stocks fell below their 200-day moving average
This points to another issue: relying on one index, even the S&P 500, isn't necessarily the best measure of bear markets.


