Related Categories
Related Articles
Articles
Election year (staying invested until -LATEST- 31st Dec. 2016)
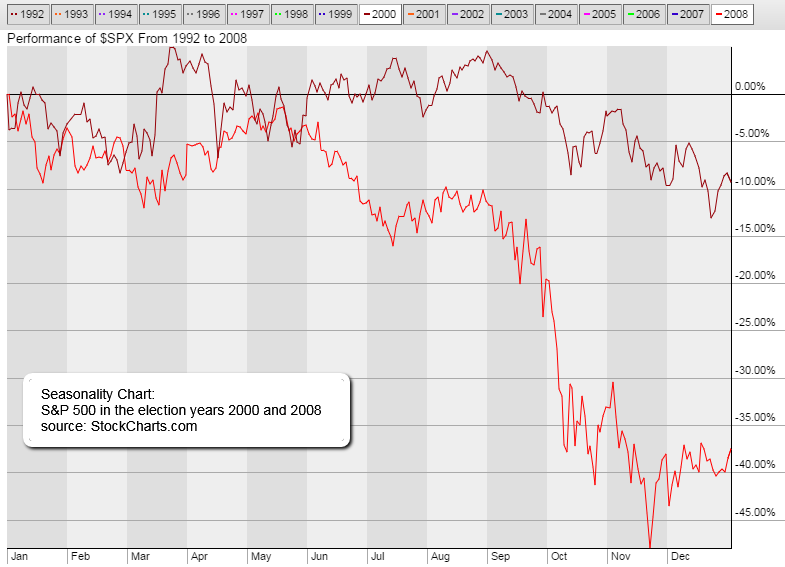
Be careful: in 2008 this idea did not work ;-)
Price data for the S&P 500 Index was compiled and averaged on a weekly basis over the period from 1942 to 2003. Analyses of these data suggest that a potentially lucrative investment strategy would have included buying on 1st October of the second year of the presidential election term and selling out on December 31 of year four.
>> This again would have ("now") meant buying on 1st October 2014 and planning to sell at the end of this year (2016).
This simple strategy would have sidestepped practically all down markets for the 60 years (BUT ONLY) UP to 2003! (2008 unfortunatelly was a real disaster!!). For the most part, bear markets have historically occurred during the first or second years of presidential terms. (A bear market is defined here as the S&P 500 Index’s decline approximately 15 percent or more over a period of one to three years, while a bull market is an environment of consistently rising prices)
It is also apparent that markets are subject to change from time to time because of unforeseen macro events. As a result, some cycles have been shorter and some longer than the norm. For example, 1946 to 1949 was a shorter cycle, while 1982 to 1987 and 1994 to 1998 were longer than average cycles. One cannot point to any one factor that has directly caused bull market runs of the last two decades to be longer in duration than those during previous decades. To speculate on the above is beyond the scope of the paper (which can be read under the link below), although fundamental economic conditions and the role of the Federal Reserve are factors.
"2 Investors": Imagine that the first investor had consistently purchased the S&P 500 Index 27 months before presidential elections and had sold near election time on December 31 of the election year. Because a 27-month period seems to provide better returns than other studied periods before the election, a 27-month period was selected for this test. This strategy kept Investor 1 out of the market from January 1 of the inaugural year through September 30 of the second year during the test period.
On the other hand, imagine further that Investor 2 bought the S&P 500 on the first trading day of the inaugural year of each presidential election during the test period and liquidated the portfolio on September 30 of the second year of the presidential term. Would either or both of these simple procedures have consistently made money for the investors?
To read more about the fascinating results, which were valid for the LAST CENTURY !! (Status now as per Feb. 2016 looks a little bit different - due to "2008"), please click following link and read through the tables:


