Related Categories
Related Articles
Articles
U.S. Dollar Index (DXY, 1973 - 2015)
To stock market technicians, the Long-Term Chart below is the mother of all "descending wedge" patterns. It's the U.S. Dollar Index, as measured and reported monthly by the Treasury Department, going back more than four decades.
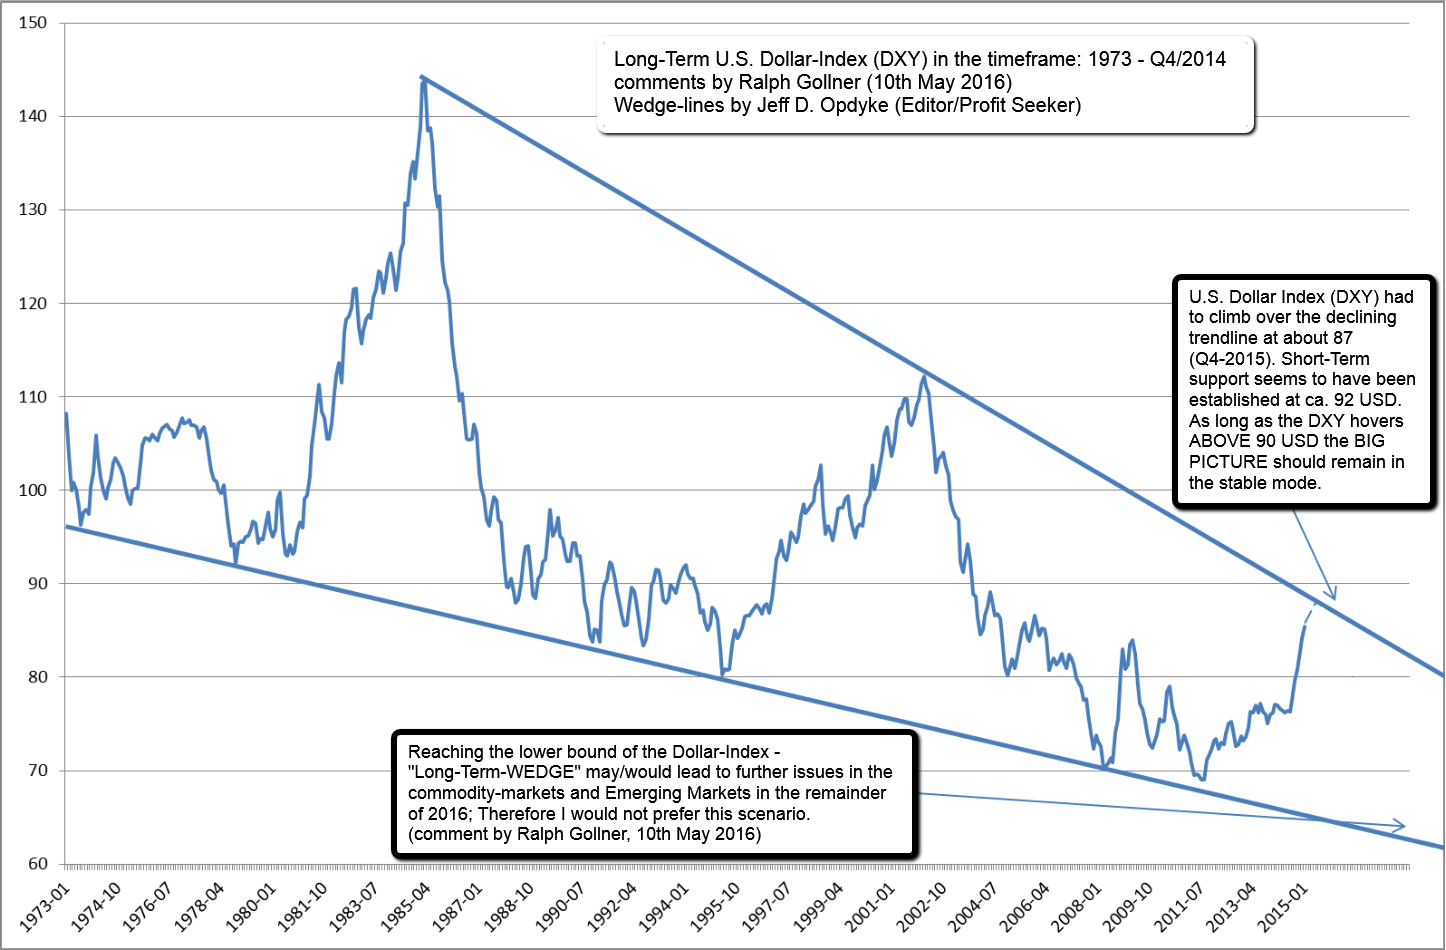 Please click for the BIG PICTURE: http://www.private-investment.at/USD-Index-Long-Term-Chart
Technically, as the index breached the trendline to the upside, the dollar may keep falling or at least stabilising for a while. If USD rebreaks to the downside and rises sharply, the world is in a hell of a fix because of the knock-on effects a stronger dollar will have on emerging-market nations - not to mention their companies that have used the weak dollar in the post-global-crisis era to take out dollar-denominated loans. A strong dollar MAY spark (again the topic of) repayment problems that could fuel another crisis.
In the following (DAILY! updated chart) you can follow the weekly development of the U.S. Dollar Index (DXY) during the last weeks, months. Stay focused, rechecking IF the DXY hovers ABOVE the 90 USD-threshold:


