Related Categories
Related Articles
Articles
S&P 500 (TTM/Trailing Twelve Month Earnings)
There are different sources regarding EPS-figures out there in the market. Here I want to show the EPS-figures, distributed by factset-research. Below following chart I will show then a longterm-P/E-history since 1990.
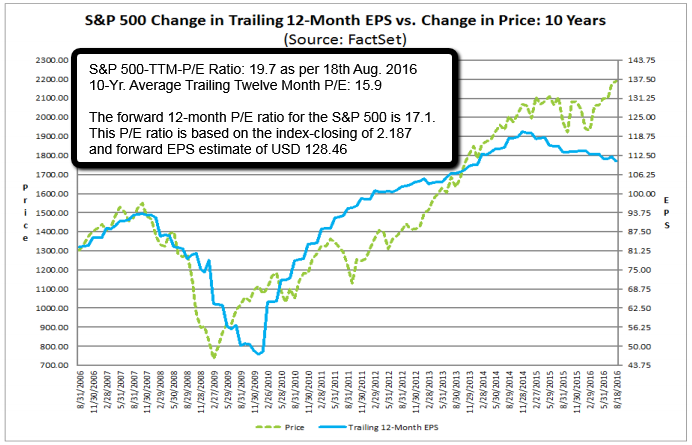 original chart-source: https://www.factset.com
Of course, one can see, that the market is currently not carrying a single-digit P/E-Ratio. Still, one has to think about the FED-Model and its implicit comparison between stocks and bonds. Bonds normally serve as the alternative to stocks - but with a bond-yield below the dividend-yield of many stocks, bonds may not be the real alternative?!? This is nowadays often referred to as TINA ("there is no alternative" - to stocks).
Anyway, in the years 1991 up to 2005 TTM-PE-ratios were pretty high (> 19) for a longer period of time!
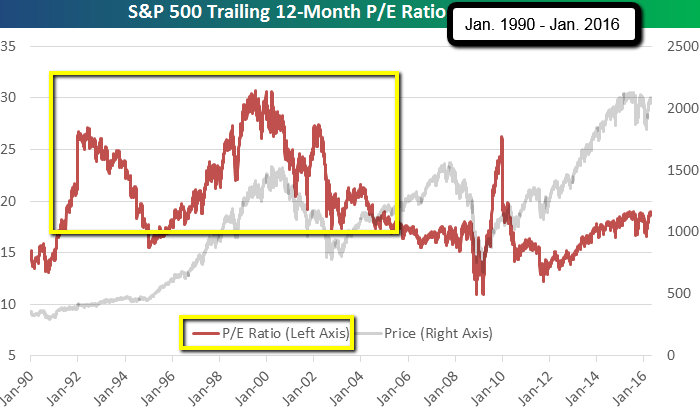
original chart-source: www.bespokepremium.com


