Related Categories
Related Articles
Articles
S&P500 dividend yield vs. 30-year U.S Treasury bond
On 8th July 2016, the dividend yield on the S&P 500 was higher than the yield on the 30-year U.S Treasury bond for the first time since March of 2009 and this, of course, makes no logical sense at all...
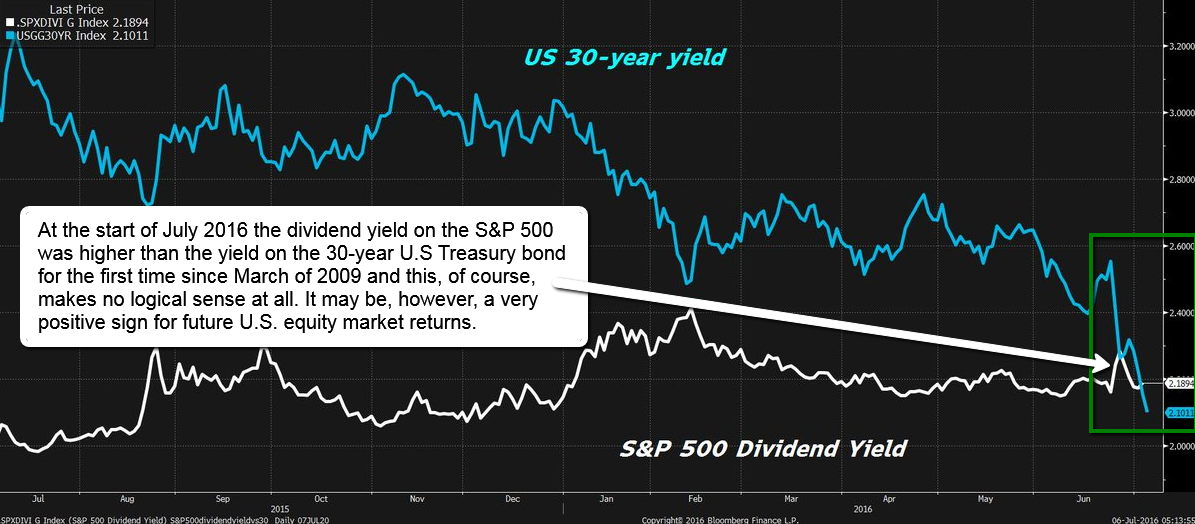
It is, however, a very positive sign for future U.S. equity market returns. On that day the yield on the 30-year Treasury bond fell to 2.10% , below the 2.14% dividend on the S&P 500.
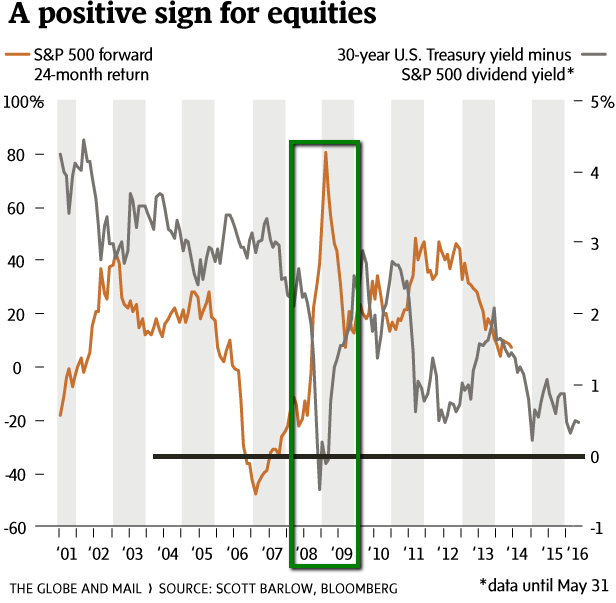
The reason this is illogical is that it means investors were willing to lock in a smaller income stream in the bond, instead of the higher indicated yield in equities. The grey line on the chart above shows the difference between the U.S. 30-year bond yield and the S&P 500 (that is, the bond yield minus the trailing dividend yield on the S&P 500). The orange line shows the cumulative performance of the U.S. equity market in the two years following each result. For example, the first data point in the chart above/on the grey line shows that in July of 2001, the Treasury bond yield was 4.2-per-cent higher than the S&P 500.
The lines clearly move in opposite directions. As the bond yield rises relative to equity yields, future equity market returns decline. When, like now, the bond yield falls closer to equity yields, history shows that investors can be optimistic about overall equity market returns.
Just a short reminder: The average S&P 500 2-Year Return is ca. 19.07%, this number stood recently at 7.07%, compared to 9.01% last month and 28.44% last year. If the S&P 500 therefore would catch up again to its average the S&P 500 would have to rise from a level of ca. 2.075 at the start of July 2016 up to ca. 2.470 in July 2018 ( = 2.075 x 1.1907).
As just mentioned, the last reading for forward two-year returns for the S&P 500 was 7.1% (3.5% per year) for the period of June, 2014, to June, 2016. If previous market patterns persist, this number should move significantly higher in the coming months as the orange line moves away from the falling grey line!
But there is always a point to stay alarmed: Market conditions are, of course, different from 2001. Most importantly, an aging developed world population has little stomach for equity risk, and many investors will park assets in safer bonds regardless of how low the yields go.
links:
"TINA" is back (.pdf) http://consensus-inc.com
Recap from June 2015 (!) already (Stocks NOT overvalued) http://www.cnbc.com/2015/06/01/a-45-year-chart
S&P 500 - 2year-rolling-returns https://ycharts.com


