Related Categories
Related Articles
Articles
The Fed Model
The basic theoretical idea behind the model is simple. An investor faced with buying bonds or equities might choose between a 10-year U.S. Treasury yielding, say 5%, or buying an equity with an earnings yield (earnings/price) of 5%.
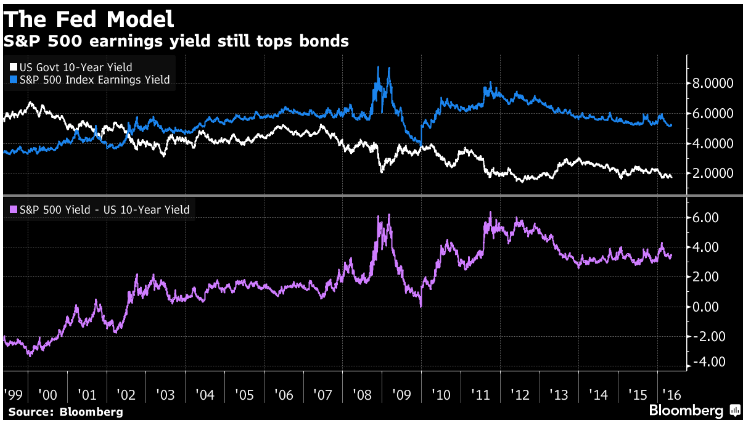
Roughly speaking, when the Treasury yield is below that of equities then it makes sense to buy equities, and vice versa.
The chart above compares the long-term performance of these two variables. As said: As a rough guide, when the earnings yield (in blue) is above the 10-year Treasury yield (in white) then equity markets are seen to be cheap and vice versa.
Judged against bonds, though, stocks remain stubbornly cheap.
Plotting the index's per-share earnings against the yield on the 10-year Treasury note, the Fed Model shows that the S&P 500 is still less expensive than any time during the 2002 to 2007 bull market. Stock valuations are held down in the comparison by some of the lowest bond payouts ever.
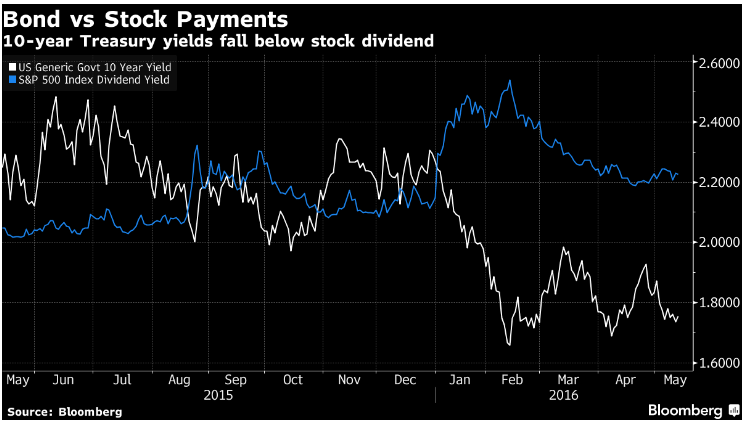
The stock market's still-healthy earnings yield underpins a number of bull cases, including ones based on dividends that are funded by corporate profits. The average payout by S&P 500 companies is 2.18 percent, about 0.5 percentage point higher than the 10-year yield and a wider gap than 94 percent of the time since 2002.
"It puts a floor beneath the market to some degree," Marshall Front, chief investment officer at Front Barnett Associates LLC in Chicago, said. "It's a relative analysis that provides you with a perspective on how equities are priced relative to a risk-free rate, and if investors expect a reacceleration of earnings, then it could presage a significant move in the equity market.”
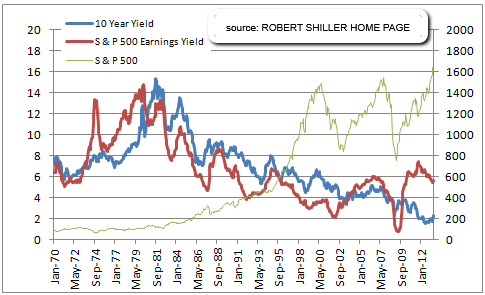
In the chart above you can see the Long-Term evolvement from 1970 until 2012; Still: The model is far from universally beloved on Wall Street.
Bonds vs. stocks (Status May 2016): The comparison between stock and bond yields offers a way to look at valuation metrics in terms of how much owners of each instrument can expect to get back in profits or interest payments on the money they invested. Those that ascribe to the model see an advantage to owning the equity market, where the S&P 500 yields 5.2 percent in earnings. The gap to the Treasury yield, while narrower than at the start of the bull market, is almost seven times wider than its smallest point in 2007.
"The spread between the dividend yield and the 10-year Treasury is in some ways more important in today’s world," Michael Purves, chief global strategist at Weeden & Co LP in Greenwich, Connecticut, said by phone. “During risk-off periods, investors can consider the dividend yield relative to the 10-year yield, which provides a lot of buffer for downside protection." Stock-dividend yield > Bonds-interest-yield:
links:


