Related Categories
Related Articles
Articles
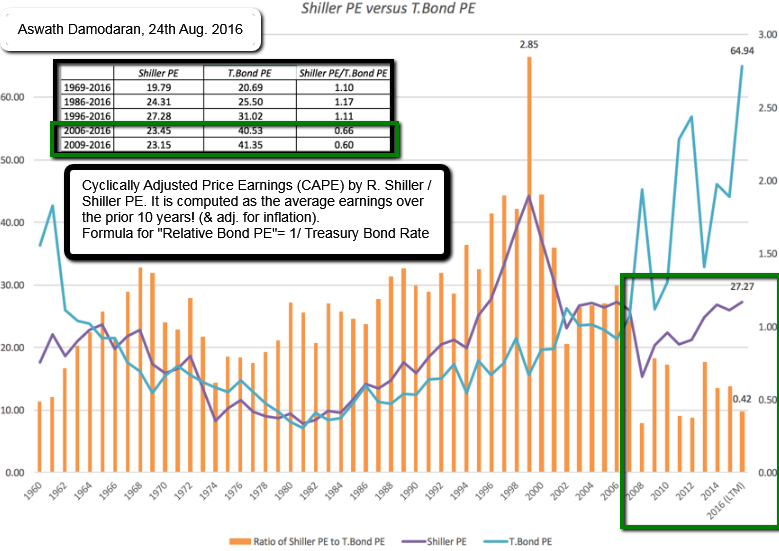
CAPE-Ratio vs. T.BOND PE
The current CAPE of 27.27 is well above the historic average of 16.06 and if you buy into the notion of mean reversion, the case makes itself, right? Not quite! (Status: 24th Aug. 2016)
As you can see, even within the CAPE story, there are holes, largely depending upon what time period you use for your averaging. Relative to the full history, the CAPE looks high today, but relative to the last 20 years, the story is much weaker. Contrary to popular view, mean reversion is very much in the eyes of the beholder.
Investing is relative, not absolute
Notwithstanding its weak spots, let’s take the CAPE as your measure of stock market valuation. Is a CAPE of 27.27 too high, especially when the historic norm is closer to 16? The answer to you may sound obvious, but before you do answer, you have to consider where you would put your money instead. If you choose not to buy stocks, your immediate option is to put your money in bonds and the base rate that drives the bond market is the yield on a riskless (or close to riskless) investment. Using the US treasury bond as a proxy for this riskless rate in the United States, I construct a bond PE ratio using that rate:
Bond PE = 1/ Treasury Bond Rate
Thus, if you invest in a treasury bond on 22nd August 2016, with a yield of 1.54%, you are effectively making 64.94 (1/.0154) times your earnings. In the graph above, Aswath Damodaran graph Shiller's measures of the CAPE against this T.Bond PE from 1960 to 2016.
A. Damodaran also computes a ratio of stock PE to T.Bond PE that will use as a measure of relative stock market pricing, with a low value indicating that stocks are cheap (relative to T.Bonds) and a high value suggesting the opposite. As you can see, bringing in the low treasury bond rates of the last decade into the analysis dramatically shifts the story line from stocks being over valued to stocks being under valued. The ratio is as 0.42 right now, well below the historical average over any of the time periods listed, and nowhere near the 1.91 that you saw in 2000, just before the dot com bust or even the 1.04 just before the 2008 crisis !
original (full) article: www.valuewalk.com


