Related Categories
Related Articles
Articles
S&P 500, ROE & Price/Book-Ratio
(1999 - June 2016)
Return on Equity (ROE) is now lagging for several quarters. One should highlight in this respect the historical relationship between ROE and the S&P 500-price/book ratio. Investors typically reward superior profitability with...
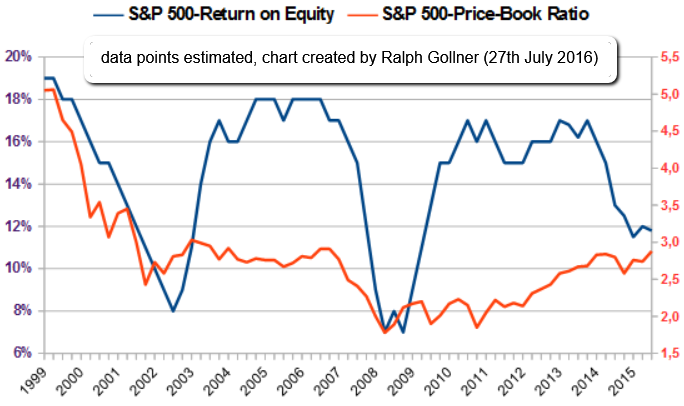
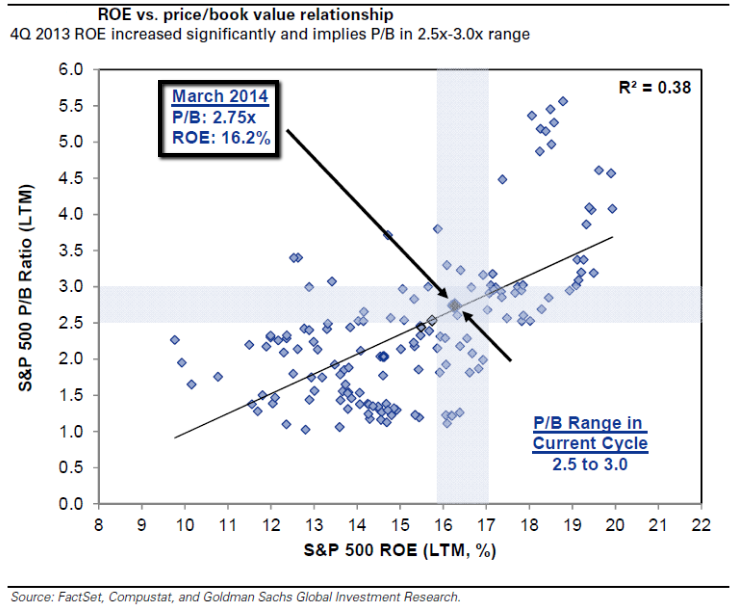
...higher valuation (higher ROE leading to higher PB-Ratios). History-RECAP: Q1-2014 & Q4-2013 (!) S&P 500 ROE dropped to 16.2% that time, and the book value reached USD 688, indicating a price/book value of 2.75x at that time.
The analysts pointed out that time the relationship between profitability and valuation was consistent with history where ROE in the 16% to 17% range has been associated with P/B ratios in the 2.5x to 3.0 range. Interesting to say that the current ROE in the S&P 500 is BELOW this range, while the current P/B-ratio in the Index lies ab 2.8 !
The following graph captures the relationship between ROE and PB:
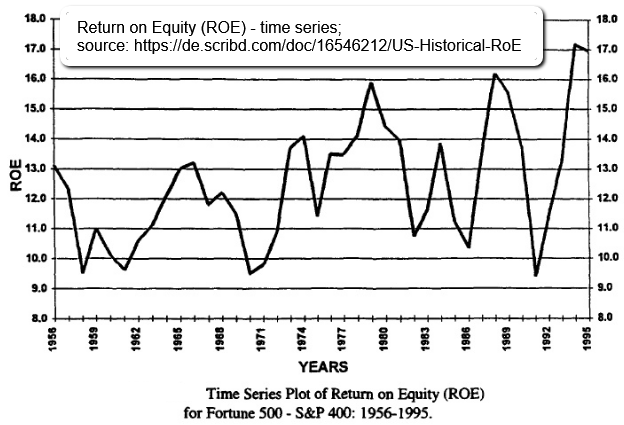
The chart below contains the ROE-data for the 40-year period 1956-1995 wherein the data is for the Fortune 500 during the period 1956-1976 and for the S&P 400 for the period 1977-1995. The figure shows that the ROE ranged from about 10 to 17 % but began at about 13 % and was at 13 % in 1993 prior to a spurt to about 17 % in 1994 and 1995.
links:
www.valuewalk.com/2015/02/sp-500-roe-ex-financials
www.valuewalk.com/2014/07/sp-500-roe
current ROE (Jan. 2016): http://pages.stern.nyu.edu/~adamodar


