Related Categories
Related Articles
Articles
Cash Flow Yield
Question: What best explains the next five years of equity returns?
Answer: Based on the historical record since 1970, the correct answer is: Today's cash flow yield.
Initial cash flow yields offer the best explanation since 1970 (Status: 2013). They account for...
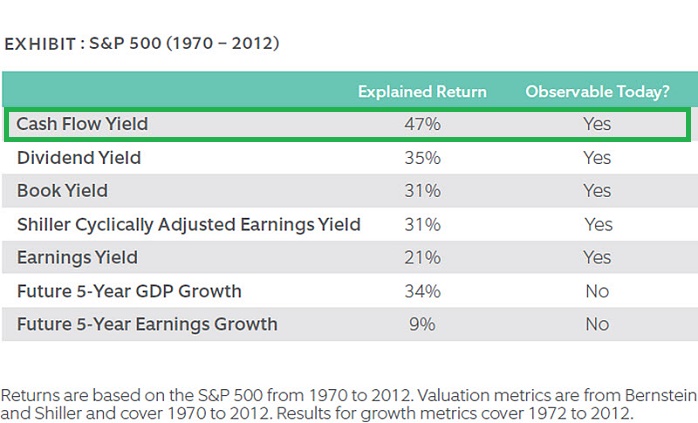
...47% of the variation in subsequent five-year (!) equity returns versus 34% for future GDP growth and just 9% for future earnings growth, a possibly surprising result.
Following exhibit below plots the relationship between 5-year global equity returns predicted from initial cash flow yields (teal) and realized subsequent 5-year global equity returns (green). For example, the first observation at January 1970 shows the predicted 5-year annualized return from the initial cash flow yield in January 1970 (teal) versus the subsequent
realized return from Jan. 1970 to December 1974 (green).
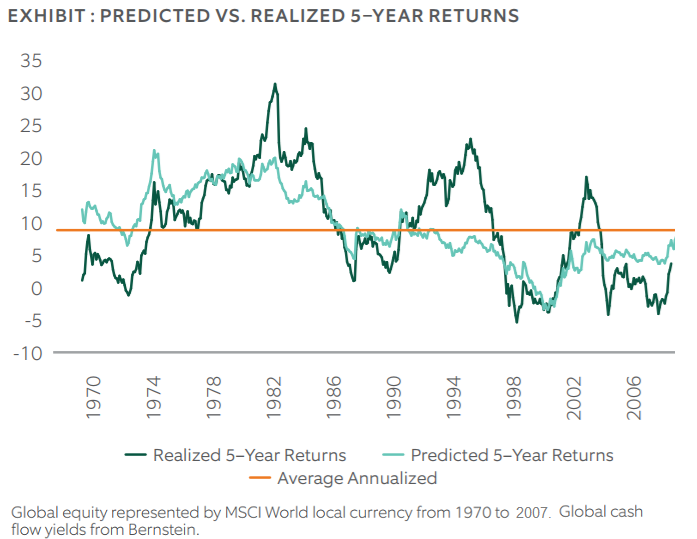
The orange line represents the 8.7% compound annualized return of global developed equities from Jan. 1970 to March 2013.
Clearly not a perfect predictor, the graph shows that the predicted 5-year returns based on initial cash flow yield explain about half of the variation (47%) of subsequent realized 5-year returns.
One key observation to be highlighted for long-term investors:
Many investors exited the stock market in 2008 as they experienced the acute distress of the financial crisis. However, as stock prices fell, cash flow yields increased an the predicted 5-year return spiked upwards. Investors were exiting the market precisely when predicted 5-year returns were increasing. In contrast, predicted 5-year returns trended downward and turned negative during the technology bubbly in the late 1990s. Investors chased returns exactly when cash flow yields suggested caution.
One Conclusion:
Investors should stay the course and occasionally consider cash flow yields when they are extreme.
Another remark on (free) cash flow:
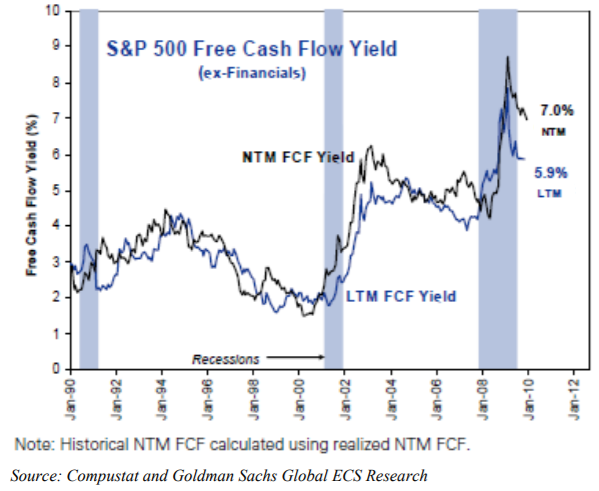
Dividend growth rates are largely determined by the growth in free cash flow, which can be defined as the cash available for distribution to shareholders after all planned capital expenditures and all cash taxes. The following graph below then highlights the fact that free cash flow yields were relatively stable in the past quarters as a result of the pullback ("holdback") in corporate capital spending. Free cash flow yields are therefore still near their 20-year averages. Assuming modest real economic growth this year and next year, the outlook for growth in dividends should be positive.
Reminder on what a company can do with "free cash" available:
Frms should intelligently allocate free cash flow among the five strategic choices available to them: cash dividends, share repurchases, debt pay downs, acquisitions and eventually internal capital projects.
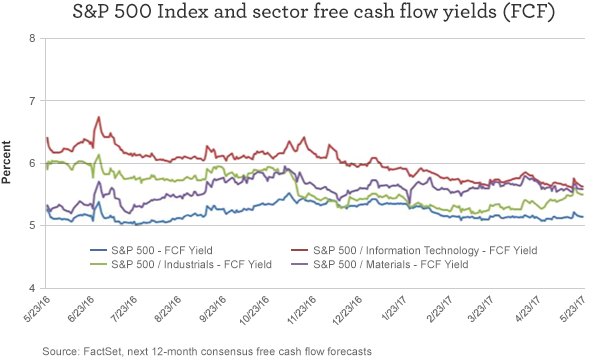
Currently the Free-Cash-Flow yields of the S&P 500 Tech Sector are around 5% (versus 0.9% in March 2000!). As can be seen in following chart, the chart below shows the free cash flow yields for the industrials, information technology, and materials sectors of the S&P 500 Index, which have remained higher than the broader S&P 500 Index during the past 12 months. (Note: the industrial sector includes the defense industry).
Technology companies in general should continue to grow relatively faster than the overall economy. The companies that produce the best technologies may offer investors above-average growth prospects. In addition, many technology companies have had strong earnings growth and attractive free cash flow yields. Another potential argument for theses stocks: In the event of an economic setback or a market correction, stocks with high cash flows may hold their value more consistently.
Last but not least, a German Proverb: "Cash ist fesch"
links:
www.eipny.com/epoch_insights/papers
http://tagstonecapital.com/second-quarter-2017
https://blogs.wf.com/assetmanagement/2017
Great backtest on investing in developed markets following the FCF-yield in the period 1990 - 2017
www.smarter-beta.com/en/smarterbeta
https://matasii.com/sp-500-overvalued
.pdf - paper
https://m.northerntrust.com/documents


