Related Categories
Related Articles
Articles
Dividend Discount Model S&P 500
(potential fair valuation)
update to the posting #1239
In Oct. and November 2018 the U.S. 10Year-Treasuries reached a yield of ca. 3.25%. Around Christmas Eve the S&P 500 reached its intermediary LOW at around a level of ca. 2,336 points...
...(but I did not look up the exact level). Just by coincident, that level would be confirmed by the DDM-matrix cross-section of 3,25% (10YR-Treas.) and an EPS-level of ca. 160 USD per S&P 500.
"DDM = Dividend Discount Model"
"SPX = S&P 500 / U.S. Stock-Market Index" (see following chart)
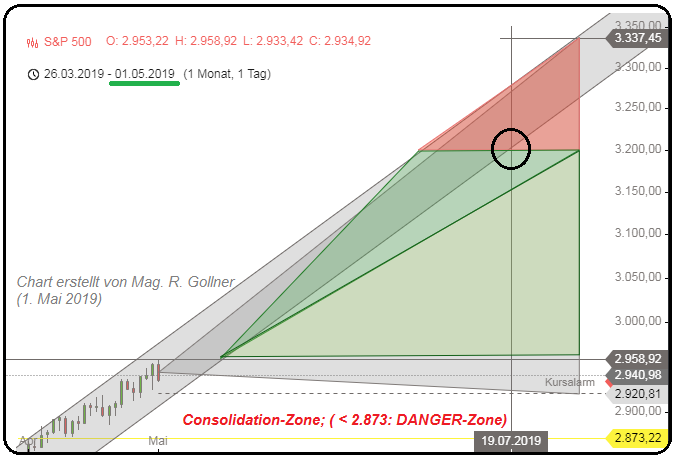
If the S&P 500-earnings for this year would level out at ca. (minimum) USD 160 this year, and the 10 Year Treasury Yield would be steady at ca. 2.50 % a possible outcome by Q3-2019 (expecting a choppy Q4-2019) could be a S&P 500 level of ca. 3,333 points.
But, well, if the S&P 500 should "crash" below the 2,844 level everything could be possible! Even an indication of an upcoming recession in the latter part of the year 2020...


