Related Categories
Related Articles
Articles
Rule of 20 (PE of 18.9 reasonable?)
Status: June 2016
Many market commentators have been banging the drum about the stock market being overvalued for a long time and they primarily cite the almighty and high P/E ratio. But there is also the "famous (?) Rule of 20":
Looking only at the "naked Price/Earnings" may only give you half the picture of the current possible "overvaluation" of the market. The current forward P/E-ratio of the S&P 500 is (slightly above) around 16.5; One should also remember the S&P 500-P/E-ratio/its post-recession low of 11.1 times in August 2011. That compares to an historical average of ca. 15.5. One can see, the P/E-datapoints are all over the place (11.1 versus 15.5 versus 16.5 - 17).
Let's take a look at the Rule20:
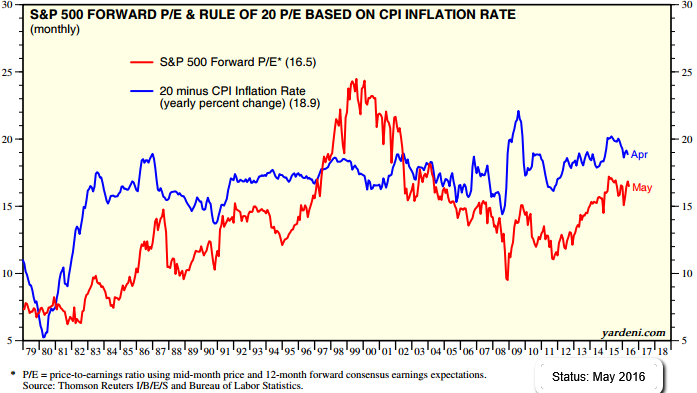
According to the "Rule of 20" valuation model, which relates the P/E ratio to inflation conditions, inflation numbers (CPI) should be taken into account. Looking only at the absolute level of the P/E ratio leaves out the fundamentally important impact of inflation on valuations.
But as can be seen in the graph above from yardeni-research (as the CPI has been increasing at a 1.1% annual rate), the "Rule of 20" model would suggest the S&P 500 P/E ratio should be valued fundamentally closer to 18.9 times earnings.
As presented in the chart below, the long-term (45 years) average rate of inflation (Annual CPI%) has been 5%! (Status as per Aug. 2013):
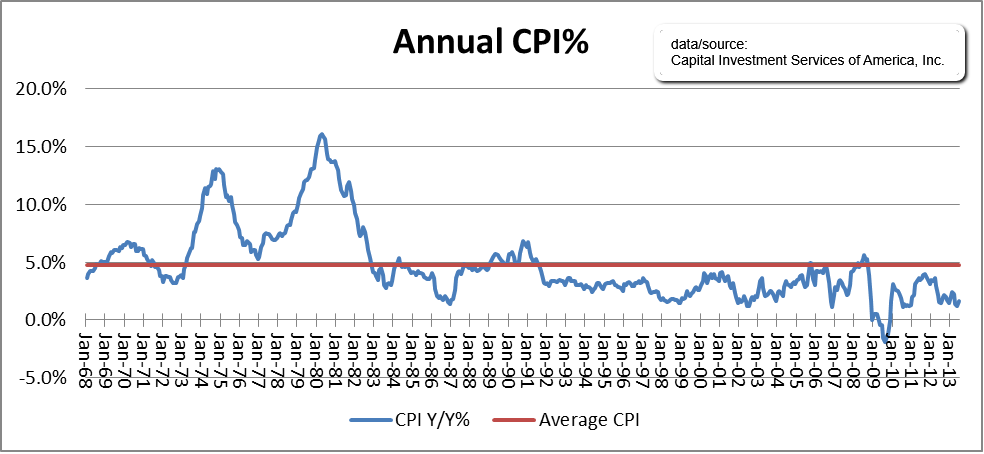
When the long-term average inflation rate (5%) is added to the long-term average P/E ratio (15X), the sum totals 20, hence the "Rule of 20" valuation model. This simple model has been very effective over time at identifying periods of over and under valuation.
One may argue, the reason the long-term average P/E ratio has been 15X is because the long-term average inflation rate has been 5%. It isthe existing inflation rate that is the primary determinant in setting the fundamentally appropriate P/E ratio level:
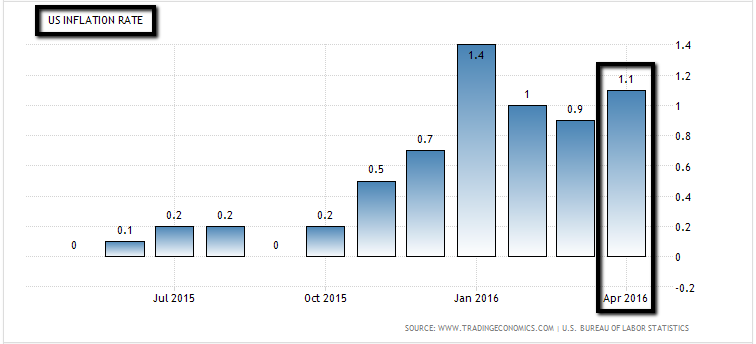
Short reminder (RECAP) how one arrives to a P/E-Rule2 0 of 18.9 in the first chart above? Well, the current US-CPI-data (US-Inflation/Consumer Price Index) is rising 1.1%:
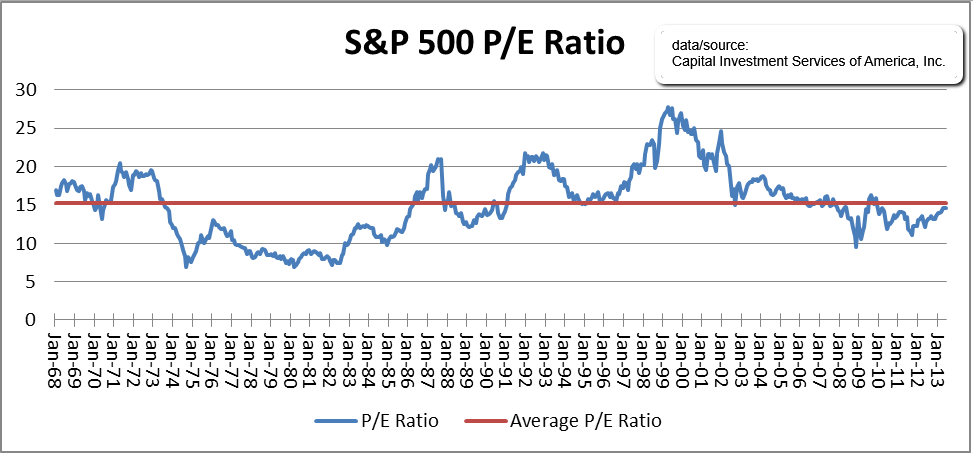
Presented in the following chart are historical P/E ratios calculated using the "Rule of 20" valuation model (blue line) and the P/E ratio (red line) between 1968 and 2013:
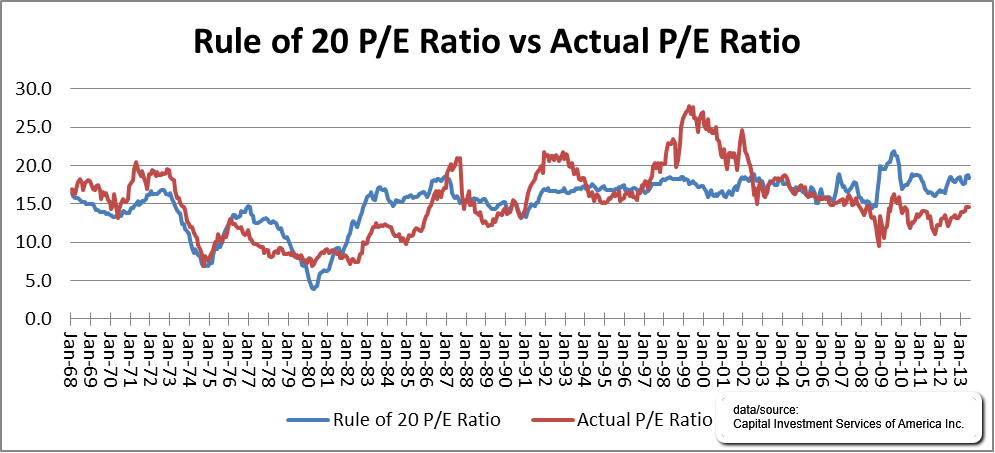
Graph interpretation: The actual P/E ratio, not surprisingly, moves with greater variability both above and below the "Rule of 20" P/E ratio. However, it does effectively regress back towards this fundamental valuation over time. This simple valuation model has provided investors with a very good framework for determining valuation conditions.
Some may ask if the "Rule of 20" still holds true if you remove the high inflationary 1970s and only consider the more modest inflationary period since the early 1980s. The following data suggests the model remains effective:
♦ years: 1982 to 2013
♦ Average CPI% was 3%
♦ Average Actual P/E ratio was 16.7X
links:
♦ Stock Market Valuation Model/yardeni-research http://www.yardeni.com/pub/valucbnew.pdf
♦ Rule of 20 http://www.capinv.com/rule-of-20/


