Related Categories
Related Articles
Articles
EPS and S&P 500
(Earnings and the broad US-Stock Market)
Nobody knows why markets move as they on a day-to-day or month-to-month basis. But long-term returns hinge on earnings-per-share (EPS) growth & dividends, as can be seen below. "It's not the economy, stupid", but the earnings-per-share.
As one has been able to read in several studies from different sources, overall GDP growth seems to have no effect on long-term stock returns if it’s not accompanied by earnings-per-share growth and dividend growth.
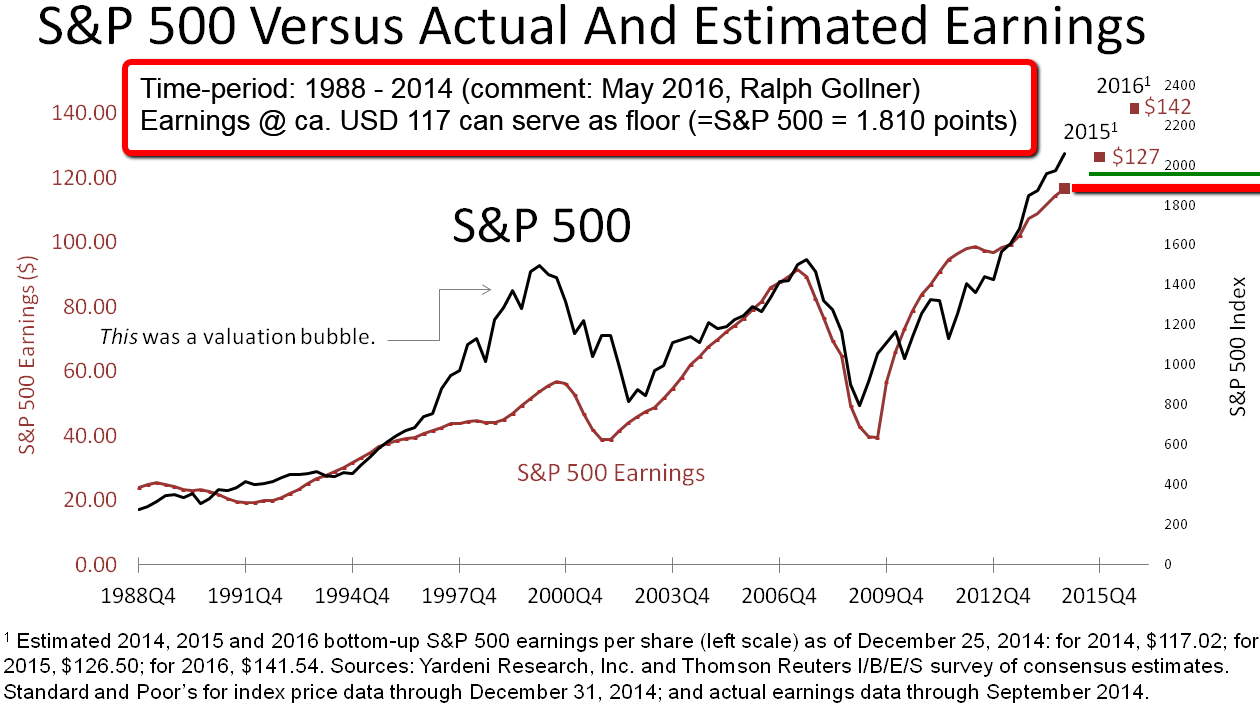
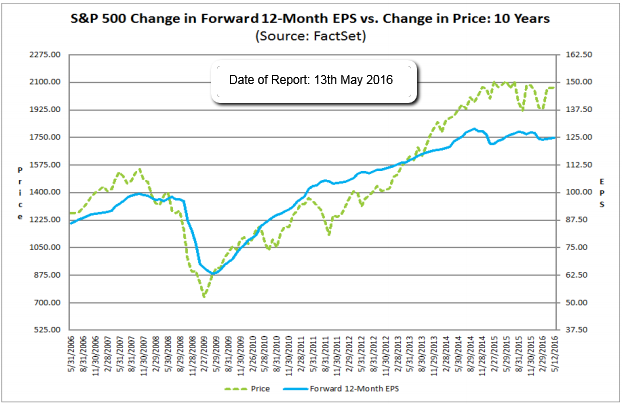
In the two graphs above one could follow, that a Forward-EPS as per May 2016 of ca. USD 125 in the S&P 500 could match up with a S&P-Index-level of ca. 1,750 to 1,810 points. Interesting to mention, that the S&P 500 reached a level of ca. 1,810 in the course of Feb. 2016.
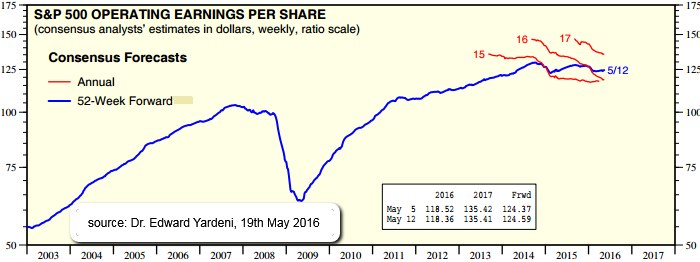
As per 12th May 2016 Yardeni-Research comes up with an Earnings-Estimate of USD 118.52 for the S&P 500:
Putting all that infos together (regarding the obvious correlation between earnings development and the broad US-Stock Market), one may conclude, that a possible floor might be seen in the range of 1,760 up to 1,900 if everything gets worse again in the weeks up to June/July 2016 (or even in other upcoming months - which I do not expect with a high probability; But -of course- a Recession would spoil any positive picture anyway!). One should keep such information in ones backmind, since this could mean a further 10% - 15% correction-potential from the current close of 2,052 in the S&P 500-Index (as per 21st May 2016).
comments by Ralph Gollner
links:
♦ "It's the earnings, stupid" http://www.marketwatch.com/story/its-the-earnings-stupid
♦ FactSet Insights https://www.factset.com/websitefiles/PDF
♦ Yardeni Research (May 2016-estimates/.pdf) http://www.yardeni.com/pub/peacockfeval.pdf
♦ S&P 500 versus Earnings (Graph above)/source: http://www.advisorperspectives.com


