Related Categories
Related Articles
Articles
Economic Confidence Model
Martin A. Armstrong, a former chairman of Princeton Economics International Ltd, developed The Economic Confidence Model. He proposes that that economic waves occur every 8.6 years, or 3,141 days, which is Pi X 1,000. At the end of each cycle is a crisis...
...after which the economic climate improves until the next 8.6 year crisis point.
In the language of a true academic, Michael Alexander divides equity market behavior itself into two cycles - a "monetary" one and a "real" one - that can take four basic permutations:
1) High inflation, high real earnings
- generally sideways periods of market chop
2) Low inflation, high real earnings
- periods of market boom
3) Low inflation, low real earnings
- periods of deflation/depression and booming bond markets
4) High inflation, low real earnings
- stagflationary periods of equity market
Hence, while earnings growth in the U.S. was effectively the same in the seventeen year period between 1965 and 1982 as it was between 1982 and 1999, Alexander blames the sideways performance of equities during the first of these periods on a negative inflationary monetary environment. Conversely, markets boomed in the latter period because of a better monetary environment.
Let's take a closer look at this 17-year cycle Alexander so adroitly discusses, but then fails to expand upon. More precisely, one may believe it is actually a 17.2-year cycle. Why 17.2 years? Well, here one should mention the work of Martin Armstrong who, by measuring the average distance between market panics through the 19th and 20th centuries, believed that he had discovered a cycle he referred to as the Princeton Economic Confidence Interval of 8.6 years.
He believed that multiple 8.6 year cycles in the markets existed that build in intensity to form a long-wave of economic activity measuring 51.6 years. Now 8.6 years happens to equate to 3,141 days which is pretty damn close to the mathematical value of pi (3.14159) times a thousand. Twice pi times 1,000 is 6,283 days or 17.2 years.
Well, assume r, or the radius, is equal to a base unit of 1. This equation would then reduce to just 2 *PI, or in our thought process, the circumference of a circle equating to the completion of one full cycle. Pretty neat, eh? After all, if concepts like calculating the circumference of a circle hold in the physical world of geometry, why shouldn't they hold in the financial world of Wall Street?
From 1914 onwards several 8,6-year cycles:
1914-1922 - Type 1: high inflation, high growth , WAR
1922-1931 - Type 2: low inflation, high growth boom
1931-1939 - Type 3: low inflation, low growth
1939-1948 - Type 1: high inflation, high growth, WAR
1948-1957 - Type 2: Low inflation, high growth boom
1957-1965 - Type 2: Low inflation, high growth boom
1965-1974 - Type 4: High inflation, low growth, WAR
1974-1982 - Type 1: High inflation, high growth
1982-1991 - Type 2: low inflation, high growth, WAR
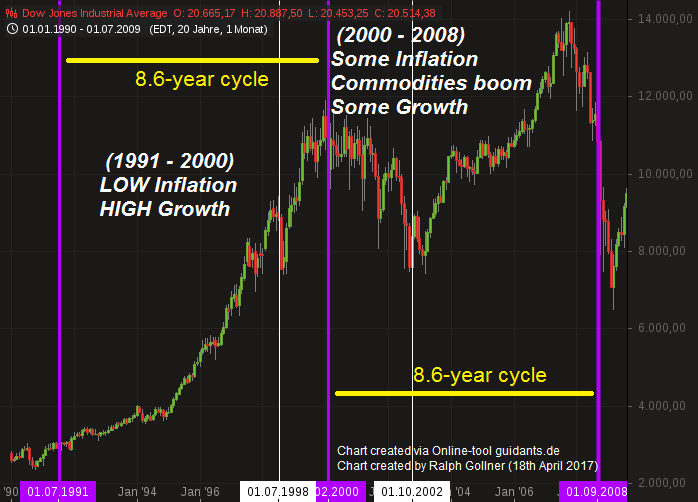
1991-2000 - Type 2: low inflation, high growth
2000-2009 - Type ?
From 7th May 2017 onwards (France - election-date)
Longer term, the next 17.2 year cycle would then start on 7th May 2017 and fall in July 2034, which coincidentally perhaps, is 314 years (PI again) from the 1720 South Sea Bubble.
links:
The New Yorker-article about Martin Armstrong
www.newyorker.com/magazine
2001-article "predicting Sep. 2008..."
www.safehaven.com/article
"Recheck Approach #2 in this Draft-paper" (.pdf)
www.stat.berkeley.edu


