Related Categories
Related Articles
Articles
Deconstructing 30 Year Stock Market Returns
& "Gimmick"
One of the most impressive long-term stock market statistics has to be the historical 30 year returns on the S&P 500: this graph shows the rolling annual 30 year returns from the corresponding start dates. The worst 30 year...
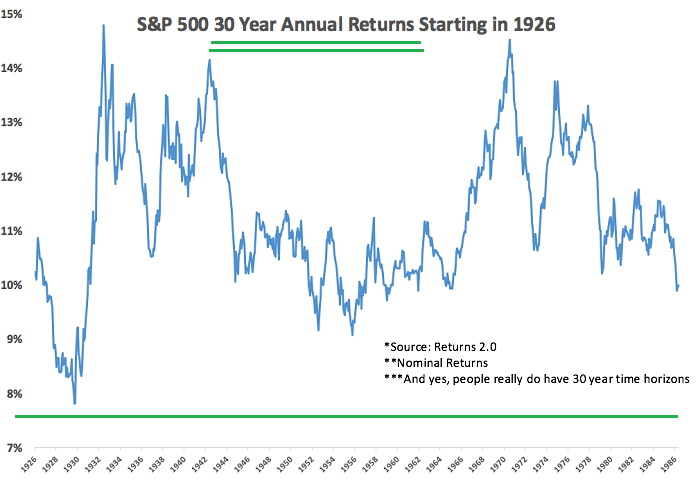
...return - using rolling monthly performance - occurred at the height of the market just before the Great Depression and stocks still returned almost 8% per year (!) over the ensuing three decades.
If you break things down into non-overlapping periods there have really only been three separate 30 year periods in this data set. So the calculation goes that the annual returns from each of those three 30 year periods are playing out following results:
♦ 1926-1956: +10.77% per annum
♦ 1956-1986: +9.63% p.a.
♦ 1986-2016: +9.99% p.a.
The consistency of returns is fairly remarkable when you consider some of the events that have transpired in each of those 30 year periods:
1926-1956: The Great Depression, a stock market crash of more than 80%, World War II, The Korean War and four recessions.
1956-1986: The Civil Rights Movement, the Vietnam War, a president was assassinated and another forced to resign, an oil price shock from the OPEC embargo, double digit inflation and interest rates and six recessions.
1986-2016: Black Monday in 1987, the Savings & Loan crisis, Desert Storm, 9/11, wars in Iraq and Afghanistan and three recessions.
The usual caveats apply here: Past is not prologue.
- We're a more mature economy now.
- These numbers don’t take into account inflation, taxes, fees, etc.
- 90 years is a small sample size in the grand scheme of things.
- 30 years is a long time to hold an investment.
- Things could certainly be worse from this point forward. You just never know.
- Still, it’s hard to look at these numbers and not be optimistic about the future.
>> Bad things happen and human progress continues to march on.
Now to something "else", but in connection with a 30-years-investment horizon and not caring, whatsoever the Stock-Market might be doing with your selected bunch of 15 stocks (Dividend payers / Dividend growers) over time.
Some LONG-TERM investors never stopped walking down that same sidewalk, also cracked by another tree root, straight to the mailbox to collect their dividends. Their biggest Mailbox Math positions will not be disclosed here, but... Not caring one bit about price action, or the overall market, and never fixing the sidewalk, they got to focus on WHY to be retired. (I'm no scientist, but with a large focus group I'd note: giant smiles and longevity seem to be associated with good Mailbox Math.) One should simply believe that certain companies are able to create their own economies with enough cash flow to pay dividends without interruption...
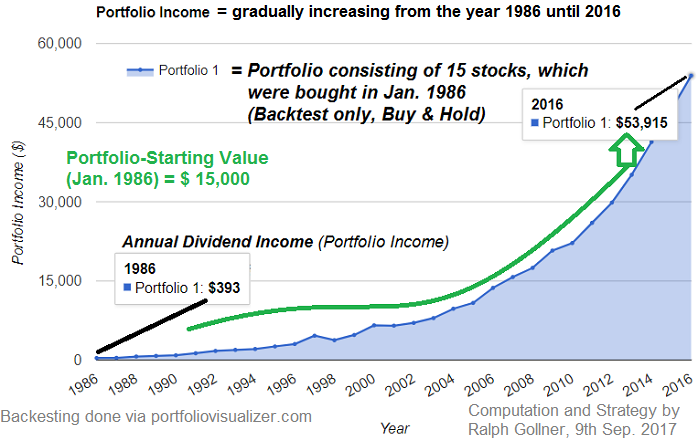

That is what a 30-years backtest will give you back as a straightforward answer - No more questions? Understood :-)


