Related Categories
Related Articles
Articles
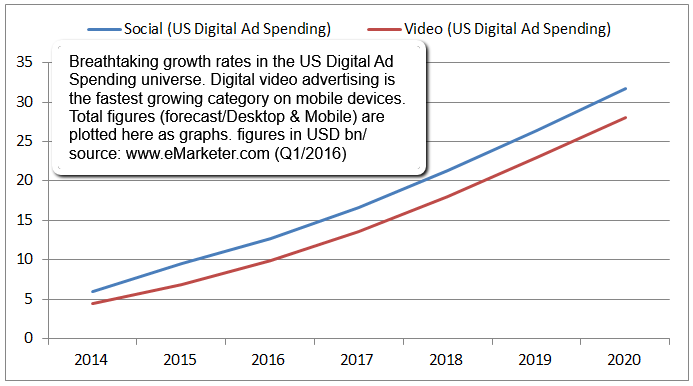
US Media Ad Spending (2014-2020)
Next year (2017) will mark a major milestone for ad spending, as total digital surpasses TV for the first time. In 2017, TV ad spending will total USD 72 billion, or 35.8% of total media ad spending in the US.
 source: eMarketer’s newest quarterly ad spending forecast (Q1/2016)
Meanwhile, total digital ad spending in 2017 will equal $77.37 billion, or 38.4% of total ad spending. In the long term, TV ad spending will continue to grow by about 2% a year. But by 2020, TV ad spending’s share will drop below one-third of total media ad spending for the first time in the US.

“As consumers continue to increase engagement with mobile devices for daily activities and content consumption, marketers will further integrate all marketing activities—including advertising—to the mobile category,” said said eMarketer senior forecasting analyst Martín Utreras.
For the moment (Q1/2016) the Online-Video-platform YouTube by Alphabet Inc. (Google) will still be playing the leading role in the US into 2017. Facebook and its Picture-and-Video-Sharing-Plattform Instagram are catching up.
In the year 2018 US Ad Spending for Mobile should overtake the position held by Desktop so far. Up to 2020 the biggest share of the pie should be held by Search, then comes Social and Video.
data/source: http://www.scottmonty.com/2016/03
eMarketer-article: http://www.emarketer.com


