Related Categories
Related Articles
Articles
Black Swan/2008 Market Crash
Diversification
If 2008-09 teaches us anything, it’s the truth in the old adage: "The only thing that goes up in a market crash is correlation." Diversification is overrated, especially when we need it most.
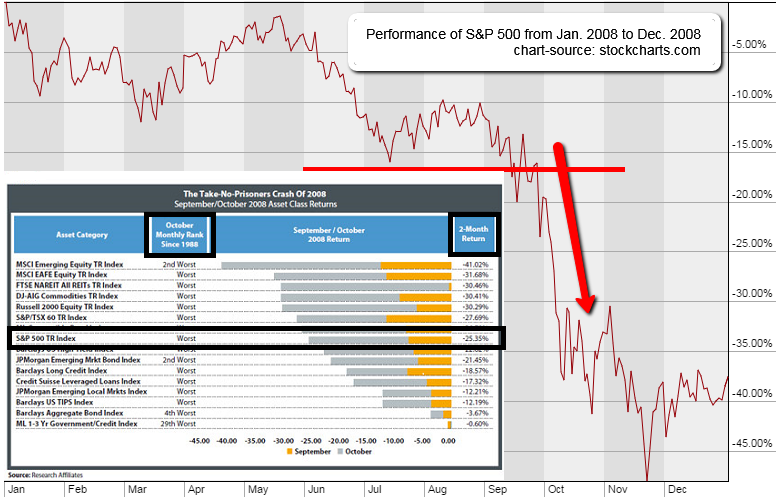
In the asset allocation work for North American clients, one often sees some model like the 16 different asset classes above (stocks & bonds - mix). In September 2008, how many of these asset classes gave us a positive return? Zero. How often had that happened before in our entire available history? Never. During that bleak month, the average loss for these 16 asset classes - including many asset classes that are historically safe, low-volatility markets - was 8%. Had that happened before? Yes; in August 1998, during the collapse of Long Term Capital Management (LTCM), the average loss was 9%. But, after the LTCM collapse, more than half of the damage was recovered in the very next month!
By contrast, in the aftermath of the September 2008 meltdown, we had the October crash. During October, how many of these asset classes gave us a positive return? None. Zero. Njente. How often had that happened before in our entire available history? Only once...in the previous month. How bad was the carnage in October 2008? The average loss was 14%. Had so large an average loss ever been seen before? No. As is evident in following Figure, October 2008 was the worst single month in 20 years for three-fourths of the 16 asset classes shown. For most, it was the worst single month in the entire history at our disposal:
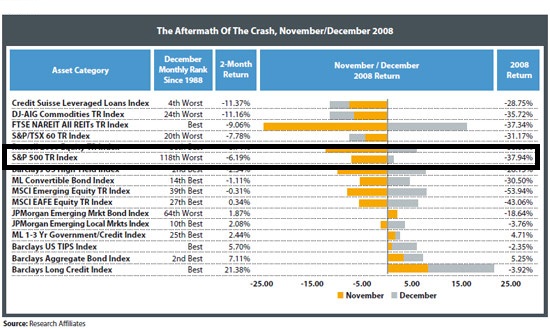
The aftermath of the September-October 2008 crash was, unsurprisingly, a period of picking through the carnage to find the surviving "walking wounded." As the Figure above shows, the markets began a sorting-out process in November/December 2008. Some markets - the safe havens with little credit risk or liquidity risk - were deemed to have been hit too hard, and recovered handily.
link to the tables (better view/resolution): www.etf.com


