Related Categories
Related Articles
Articles
What's your risk number?
"Risk Tolerance"
Do you really know how much you can afford to lose in the market (in German aka: "Rumrutschfaktor")? The Portfolio-management process starts with you setting an acceptable range of outcomes, be it in percentage or absolute terms (in EUR, USD, etc.).
But how do you set boundaries to do this, so that you get to where you want to be? Well, every investor has a break point. That is the amount of wealth at which their investment decision making (and maybe their sleeping pattern) is overcome by their concerns about the potential lifestyle impact of their investments.
Even though they realize that investment returns are cyclical, volatility comes with the territory, a mental switch flips for everyone at some point. And the closer we get to retirement, the faster that switch flips, and typically at a lower level of loss than when we were younger. This is natural, and no investor should be distressed by it.
BUT: What's your "number?"
However, most investors do not truly know what their stress point of loss is. Ignoring several "risk tolerance" surveys and tools, the most direct way to figure out your true tolerance for loss is ... ask yourself. This sounds simple, but there is a catch.
You see, this is a tradeoff. You can't talk about how much you are willing to see your portfolio drop without also understanding what that means about how you limit your upside by doing so. But how do you figure that out? It would be nice if you could simply say "sign me up for 40% upside and 5% downside," but that is not realistic.
Real-life experience
The table below summarizes the historical six-month return ranges of some popular asset investment indexes going back to 2008. You may be asking why a six-month time frame is used, when one usually makes such a big deal about judging investment results over a longer time period. The reason is that we are talking about the outer limits of what an investor can stomach over a shorter amount of time. If they can't take more short-term-risk over any half a year, that excludes many potential approaches that require three years' worth of patience.
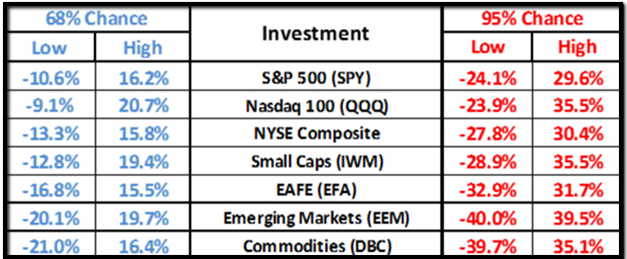
These are not the absolute best- and worst-case scenarios that have occurred. Instead, here is a "standard deviation" approach used by having the research analyst of Sungarden Investment Research, Mark Jakupcik, calculate the ranges within which each investment's returns fell 68% of the time and, separately, 95% of the time.
(Jargon alert: The statistics students among us will recall that these are often used to express the possibility of something within one and two standard deviations of the mean, respectively. The key for you is that viewing it in this way, instead of expecting worst- and best-case scenarios to repeat themselves exactly, will help you to better understand what is possible and what is reasonable.)
Some observations
The ranges are a lot larger than many investors are comfortable with. This is why comparing your portfolio to the S&P 500 is not a good idea for many investors. It sounds brazen, bold and heroic to say that you will be cool and calm when the "dips" occur, but take a gander at those numbers on the right and ask yourself if you are really up for that ride.
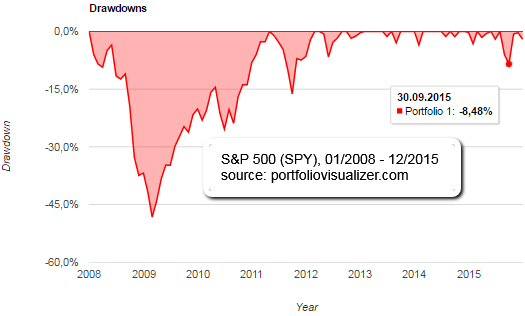
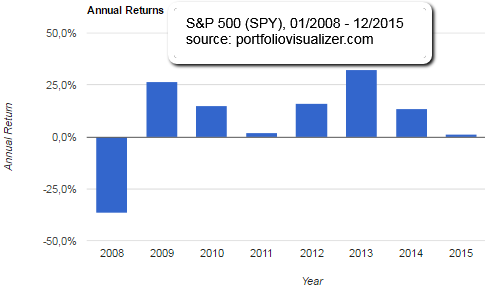
Risk is a natural part of investing. So it's up to you to find your comfort level and build your portfolio and expectations accordingly. Following "Reward-outcome"-table of the S&P 500 over the last years from 2008 onwards may help?!
 Original/full-text link (includes a link to the Riskalyze risk-tolerance-quiz "Find your risk-number"):


