Related Categories
Related Articles
Articles
Baltic Dry Index (Snapshot July 2016)
Chart 2007 - 22nd July 2016
Since the Baltic Dry Index débuted, in 1985, economists of all stripes have routinely consulted it as a trusted proxy for trade activity. Based in London, the Baltic Dry Index (B.D.I.) reflects the rates that...
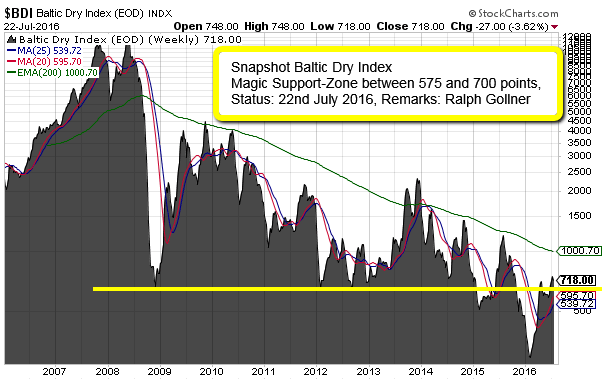
...freight carriers charge to haul basic, solid raw materials, such as iron ore, coal, cement, and grain. As a daily composite of the tonnage fees on popular seagoing routes, the B.D.I. essentially mirrors supply and demand at the most elementary level. A decrease usually means that shipping prices and commodities sales are dropping (the latter because shippers are competing over fewer consignments). Shipping is a direct indicator of whether people want goods, and softness in shipping prices is therefore a sign of weakness in manufacturing and construction.
In January 2016, when the B.D.I. surfaced as a heated topic in certain geeky economic corners of the Internet, it had fallen to a record low of 429, an eighty-per-cent decline from December, 2013, and far below its record high, in May, 2008, of 11,793. It continued to plunge for another month, hitting a nadir of 291 on 12th February 2016.
To economists, the Baltic Dry Index is a rare gem: a coincident indicator. You might be familiar with lagging indicators, such as the prime rate, which reflect the economy as it was months earlier. And you may also have come into contact with leading indicators, such as initial claims for unemployment insurance and the S&P 500, which supposedly presage the short- to medium-term future state of the economy. But their predictive track record is poor, because any number of exigencies - from a terrorist attack to a devastating natural disaster to an overnight rate change in Europe - could intervene to detour the economy.
By contrast, a coincident indicator, like non-farm payroll and industrial production, is an immediate and frequent snapshot of some aspect of the economy. Absent extenuating circumstances, any sharp and continuous movement in a coincident indicator will more than likely foreshadow a significant change, even if its implications aren’t immediately obvious. Indeed, the simplicity of the Baltic Dry's message is what made it so attractive to global financial analysts. Howard Simons, the president of the economic consultancy Rosewood Trading, once described the index as "totally devoid of speculative content."
The index best showed its foresight in 2008, however, when it lost more than twenty-five per cent of its value between May and July. It turns out the dip was capturing the tightening of international credit, as financial-services firms, hampered by bad mortgage investments, struggled to maintain liquidity; in that environment, only the most well-heeled commodity buyers and shipping agents could get loans to bring in their goods. The dip in the B.D.I. presaged IndyMac's bankruptcy, the first major bank failure of the global financial recession.
Soon after, though, the Baltic Dry Index began to lose its lustre as a predictive tool. The primary reason was a shipbuilding spree in China, intended to support the country’s position as the world's largest consumer of commodities, most of which were needed to feed uncontrolled construction and industrial expansion.
additional links:
text above based on full text: www.newyorker.com/business
current Bloomberg-view / Chart: www.bloomberg.com/quote/BDIY:IND
equityclock - Longterm-Chart technical Analysis (2007 - July 2016) http://equityclock.com


