Related Categories
Related Articles
Articles
US-Recessions since 1929 & Stock-Returns
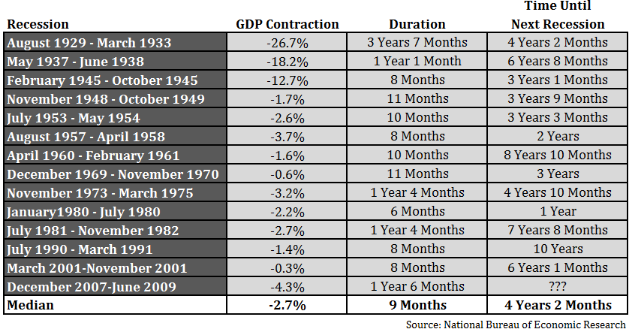
Reminder: Normally, recessions are a fact of life, so we need to get used to them every 4-10 years or so. The following table shows each US-Recession since the late-1920s:
The next logical step from here is to see how stocks performed in and around these past Recessions. Here one sees the return-statistics based on the monthly S&P 500 data going back to the mid-1950s. This database should be good enough to show the total returns leading up to, during and after each of the past nine recessions:
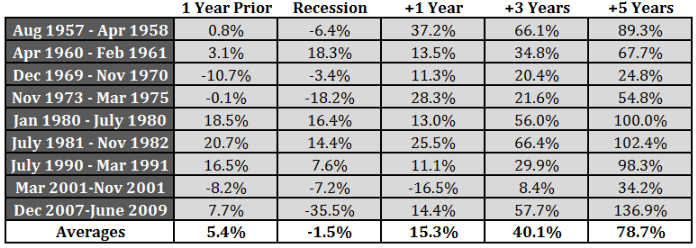
This is another piece of evidence that shows why investing during periods of unrest usually pays off for investors. Three years out from a recession the annual returns showed an average annual gain of 11.9%. Five years out the average annual gain was 12.3%. Only one time since 1957 was the stock market down a year later following a recession, which occurred during the 2000-2002 bear market.
Recap on History/Stock-performance BEFORE an upcoming recession: Stocks were positive 6 out of the past 9 times in the year leading up to the start of a recession, dispelling the myth that the stock market always acts as a leading indicator of economic activity!
How was it in even earlier times (even BEFORE WWII)? Take a look:
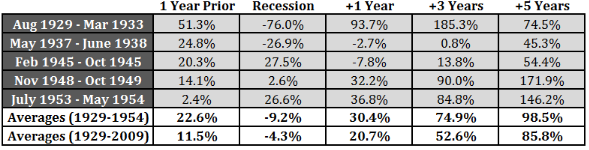
All of which is to say, what these numbers really tell us is that, in general, stocks tend to perform below average in the year leading up to and during a recession and perform above average in the 1, 3, and 5 years following the end of a recession (with the usual caveats that there are always outliers and this is a small sample size).
So all you have to do is figure out how to predict the next recession and you've got it made. Easy, right?
>> Brett Arends of MarketWatch (who himself was trying to figure out if we were already in a recession in late-2012) showed why it can be so difficult to predict recessions in real-time: Remember the Great Recession that began in December, 2007? The economists at the National Bureau of Economic Research, who are basically the official scorekeepers of recessions, didn't discover the recession until December, 2008 – a year late, and only a few months before the episode (officially) ended.
The previous recession began in March, 2001 – but the NBER didn't call it a recession until 26th November of that year. By amazing coincidence, that was actually the month it ended (as they told us many months later). The recession that began in July, 1990 wasn't called until April the following year. The recession that began in July, 1981 wasn't recognized until January of 1982. And so it goes. We'll go into another recession at some point.
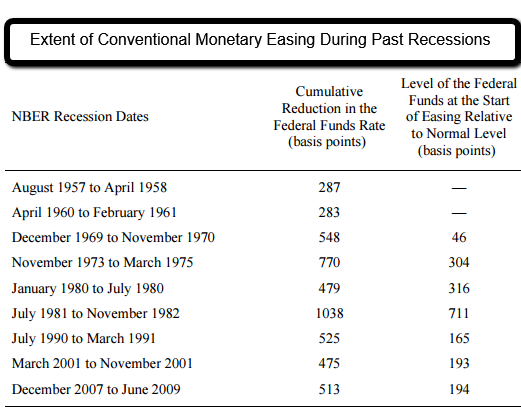
How can Monetary Policy fight against an extremely hard landing, when a recession hits in? Well, the FED can do it the "old fashioned way" via its Interest-Rate-Policy - measures or nowadays (since the Great Recession around 2007 - 2009) via extraordinary measures:
Secular Stagnation and Other Caveats:
Of course, current or past simulation results may paint an overly optimistic picture about the ability of the Federal Reserve to use forward guidance and asset purchases to compensate for a limited ability to cut the federal funds rate in response to a future recession.
In...
[small "FOOTNOTE"
In hindsight, the 2007-2009 recession appears to have been largely attributable to the collapse of a housing bubble whose macroeconomic effects were greatly exacerbated by many overleveraged households and firms and a financial system that was quite vulnerable to shocks. That said, the housing bubble itself may not have been completely independent of monetary policy, in that low short-term interest rates from 2001 through 2005 may have contributed to the rise in house prices during this period. But as discussed by Dokko et al (2011), the primary driver of the housing bubble - which was not just a U.S. phenomenon - appears to have been overly lax lending standards. Moreover, the FOMC's decision to keep the federal funds rate low on average during those years was itself motivated by weak underlying economic activity and core PCE inflation that remained subdued.]
...this regard, one key risk is that future policymakers may have even less room to cut the federal funds rates than currently predicted by forecasters.
!! As Lary Summers (2015) has argued, aging populations, slower productivity growth, and a heightened global reluctance to spend and invest may have pushed the United States and other advanced economies into a state of secular stagnation, in which interest rates will remain extremely low for the foreseeable future unless offset by expansionary fiscal policy !!
This hypothesis is broadly consistent with updated estimates from the Laubach-Williams model indicating that persistently slow productivity growth in recent years has caused the current value of the real equilibrium federal funds rate, as well as its projected long-run value, to fall to about zero; accordingly, the average value of the nominal federal funds rate in the future might be only 2 percent.
Conclusion
The federal funds rate now appears likely to settle down over the next few years at a rather low level by historical standards, thereby limiting the ability of future policymakers to support real activity and inflation through lower short-term interest rates in the event of an economic downturn. Nevertheless, even in fairly adverse circumstances the FOMC should be able to compensate by using large-scale asset purchases and "lower-for-longer" forward guidance about the federal funds rate to put additional downward pressure on longer-term interest rates.
links/study-paper (for further reading):
Jackson Hole/commentary/study www.marketwatch.com/story
Gauging the ability of the FOMC to respond to future Recessions www.federalreserve.gov/econresdata
March 2015 http://awealthofcommonsense.com
Feb. 2015 http://awealthofcommonsense.com
Dec. 2012 www.marketwatch.com


